Transcription
Interactive Visualisation forPrecision andTranslational MedicineDr. Christof GaenzlerHUMAN HEALTH ENVIRONMENTAL HEALTH 2014 PerkinElmer
Introduction Precision and Translational medicine change healthcare Visual Interactive Analytics should drive decision-making Customers need more complete solutions Too much effort is invested in Data Collection and Curation A shift towards higher value activities is needed2
Shift Effort Towards the Higher Value Activities3
Shift Effort Towards the Higher Value Activities4
Shift Effort Towards the Higher Value Activities5
Visual Information Seeking Visual browsing & interacting with data Graphical interactive display of data drill-down, drill-across, filtering Important in Translational Science Disparate datasources not designed to fit together6
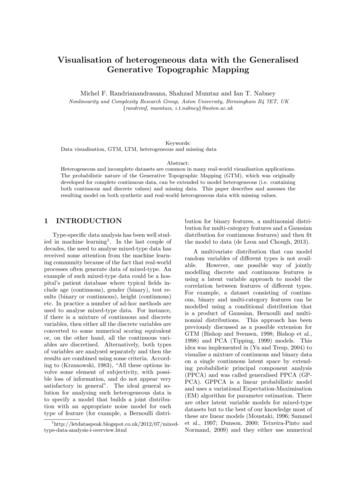
Translational Medicine WorkflowsReview SecondaryAnalysisSelect ClinicalSubject & SamplesSecondaryAnalysisSelectProcessed DataTranslationalScientistBioinformatician/Data ScientistStart with scientifichypothesisand use scientificEntitiesFocuses on singleexperimentand starts withinstrument atedAnalysisDataProcessingRaw Data7
Spotfire as „Query Tool“ for Selection steps8
How does it all fit together?Signals for TranslationalCombines technologies intoa single solution for thetranslational scientistPublic Data SourceConnectorsLeverage existing datasources with the power ofthe platformSignals PerspectivesAdds data discovery fordisparate data sets9
PerkinElmer Signals Embedded in TIBCO Spotfire 10
Visual Metadata Exploration 11
and Data Filtering12
Real World Evidence across the Pharma Value Chain R&D Translational, Trial Simulation & Recruitment Medical & Safety AE / Signal Detection, Risk Management HEOR Local Burden of disease and cost Market Access Speed to market, outcomes-based pricing Commercial Patient flow, Launch planning13
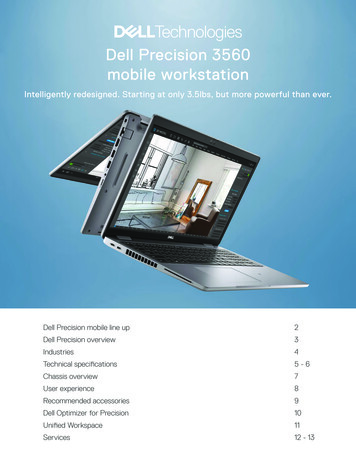
RWE Use Case Specific AnalysisForest Plot of hazard ratiosby cohortKaplan-Meier Plot - alsoknown as the product limit/survival estimator14
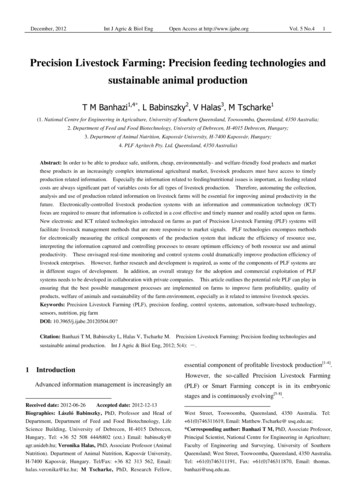
Cohort Studies - Data Mashup: Combining Clinical andBiomarker DataPatient PopulationIHCStratified Patient ACNV andTranslocations15Getting the right drug to the right patient at the right time
Translational Medicine will becomePersonalized cise diagnosisNGSGEACNV andTranslocations16Targeted TherapyGetting the right drug to the right patient at the right time
Features of Desired Analytical Ecosystem Open and Collaborative Within and between Business units Also with Vendors Comprehensive Deep set of “out of the box” capabilities From data to insight Flexible Exists as part of current architecture without disruption Grows and changes over time!17
18
2 Introduction Precision and Translational medicine change healthcare Visual Interactive Analytics should drive decision-making Customers need more complete solutions Too much effort is invested in Data Collection and Curation A shift towards higher value activities is needed