Transcription
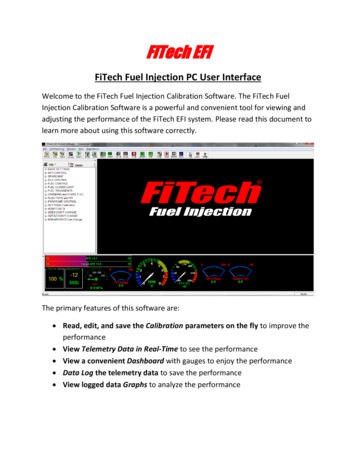
FiTech EFIFiTech Fuel Injection PC User InterfaceWelcome to the FiTech Fuel Injection Calibration Software. The FiTech FuelInjection Calibration Software is a powerful and convenient tool for viewing andadjusting the performance of the FiTech EFI system. Please read this document tolearn more about using this software correctly.The primary features of this software are: Read, edit, and save the Calibration parameters on the fly to improve theperformance View Telemetry Data in Real-Time to see the performance View a convenient Dashboard with gauges to enjoy the performance Data Log the telemetry data to save the performance View logged data Graphs to analyze the performance
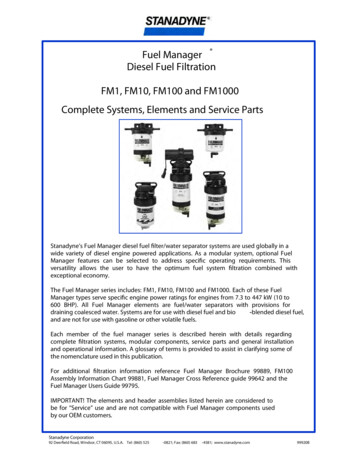
Connecting to the ECU via the Handheld Controller – After a successfulinstallation of this software and the K-Line drivers, simply insert one end of theUSB cable into the handheld micro USB port, and the other end into the laptop.On the Handheld screen, select “Switch to K-Line Mode.” Open this FiTechCalibration software on your laptop, and read these instructions to learn how touse it.About the File Menu1. File1. Open ECU Project (this is only necessary if you have updated software in the throttlebody, or are tuning several different products from the same laptop) – same function asthis button:2. Open Calibration from file– same function as this button:3. Save Calibration to file – same function as this button:4. Exit/Close FiTech Software – Self-explanatory.
2. Cal/Dash/Log:1. Calibration File: These buttons can program the calibration that is open in the software, or readthe calibration from the ECU to synchronize.Same function as these buttons. If you are just connecting to a working throttle body, click the“read” button, and synchronize from the throttle body first before making changes. Also, savecopies as you do work so that you can go back if you don’t like a change.2. Dash Data Monitor: Can start and stop the communications. If “Comm” is connected, pushingthe “Dash” button can also start the live telemetry communications.3. Data Log: Can start, stop, pause, resume, and save log files of the open dash windows
4. Settings Files: This points to the configuration files that are being used to read and display thedata. Do not change these file paths unless the files have been moved for some reason, or newfiles were downloaded or received to replace these.5. K-Line AutoConnect Select this if you want the software to auto-detect and connect to the handheld De-select this if you want to work offline (and not see the cursor frequently bug out)3. Window: Basic stuff here – it arranges the open windows in a few choices if desired.4. View: The different things on the screen can be closed or shown individually
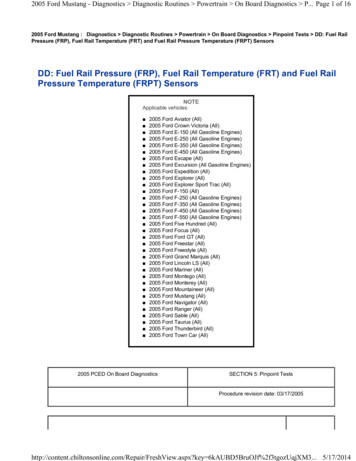
5. Help/About: Basic useless information about the software6. The "Help" Quick Button can open a help dialog (see right side) to explain whateach parameter in the calibration or dash communications means (double click onthe name of the parameter you want explained) – not so useless!
7. Quick Buttons: USE THESE INSTEAD!8. These are the calibration group names (note the asterisk (*) near the word"CAL" on the tab to indicate these are calibration items, and not DASH telemetryitems. The names are mostly similar to the Handheld calibration items.
9. Expand any group and open it by clicking on the group name and then on anyname inside it10. Options are changed by clicking on the WORDS of the choices on the rightside under the "unit" column
11. Constants are changed by double clicking on a number to edit it. The /- andother buttons at the top can be used to make calculated changes. Click the "Send- ECU" button to make just the things that are changed get sent to the ECU.Remember to save early and often. It’s a good idea to keep many calibrationswith the date and a special note in the file name.
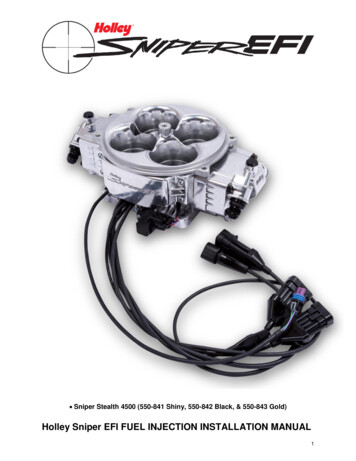
12. 3D Tables are shown in table format13. Clicking the 3D graph Quick Button, or 3D View button from the menu in theopen table will show a graphical view of the data that can be rotated for easyviewing
14. 2D Calibration Data can be viewed in a chart as well. Just click "2D plot" fromQuick Buttons, or "2D View" from the editing window.15. DASH Telemetry groups can be chosen here (note the * next to DASH)
16. Expand and click on a name in the group, or click on the group and right clickon the group name to open a window. Multiple windows can be openedsimultaneously.17. Open many windows to see everything necessary for the task at hand
18. Click the "Log" Quick Button at the top and create a file name (use somethinglogical and methodical so that it's easy to find and analyze later). Then click “Open”to create the file, and then use the Quick Button “Start” to begin logging ALL ofthe OPEN windows! Click the “Stop” Quick Button to stop logging.19. Click the "Chart" Quick Button to access logged *.csv files that were recordedfrom the system
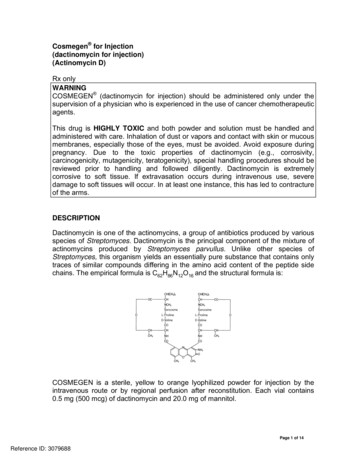
20. Select some items to view, and click OK to show in a large graph21. Log charts can be viewed in full screen for easier viewing
22. Zoom by clicking and dragging on the graph. Undo zoom by shift Z or rightclick and selecting undo zoom
FiTech EFI FiTech Fuel Injection PC User Interface . Data Log the telemetry data to save the performance . to create the file, and then use the Quick utton “Start” to begin logging ALL of the OPEN windows! lick the “Stop” Quick utton to stop logging. 19.File Size: 1MB