Transcription
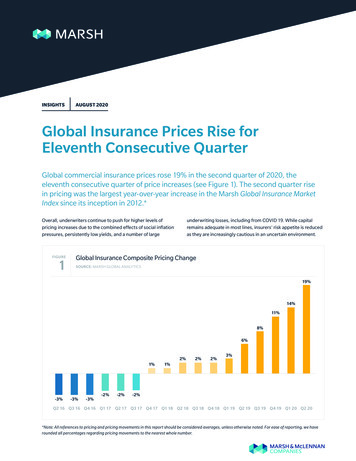
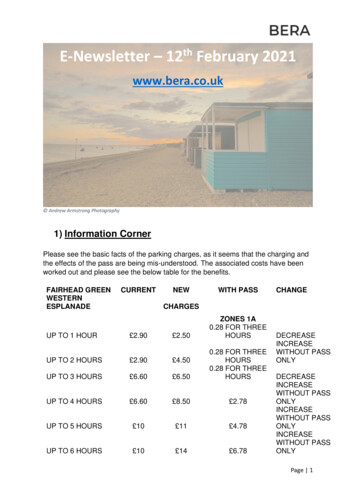
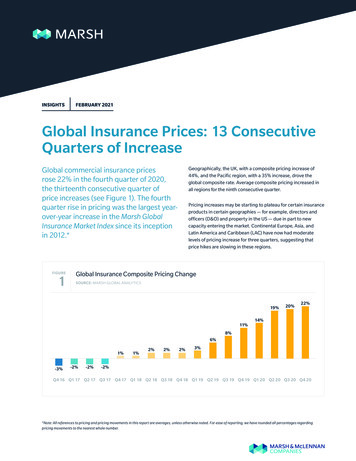
INSIGHTSFEBRUARY 2021Global Insurance Prices: 13 ConsecutiveQuarters of IncreaseGlobal commercial insurance pricesrose 22% in the fourth quarter of 2020,the thirteenth consecutive quarter ofprice increases (see Figure 1). The fourthquarter rise in pricing was the largest yearover-year increase in the Marsh GlobalInsurance Market Index since its inceptionin 2012.*FIGURE1Geographically, the UK, with a composite pricing increase of44%, and the Pacific region, with a 35% increase, drove theglobal composite rate. Average composite pricing increased inall regions for the ninth consecutive quarter.Pricing increases may be starting to plateau for certain insuranceproducts in certain geographies — for example, directors andofficers (D&O) and property in the US — due in part to newcapacity entering the market. Continental Europe, Asia, andLatin America and Caribbean (LAC) have now had moderatelevels of pricing increase for three quarters, suggesting thatprice hikes are slowing in these regions.Global Insurance Composite Pricing ChangeSOURCE: MARSH GLOBAL 2%Q4 16 Q1 17 Q2 17 Q3 17 Q4 17 Q1 18 Q2 18 Q3 18 Q4 18 Q1 19 Q2 19 Q3 19 Q4 19 Q1 20 Q2 20 Q3 20 Q4 20*Note: All references to pricing and pricing movements in this report are averages, unless otherwise noted. For ease of reporting, we have rounded all percentages regardingpricing movements to the nearest whole number.
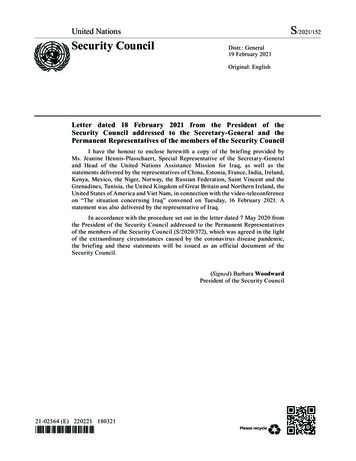
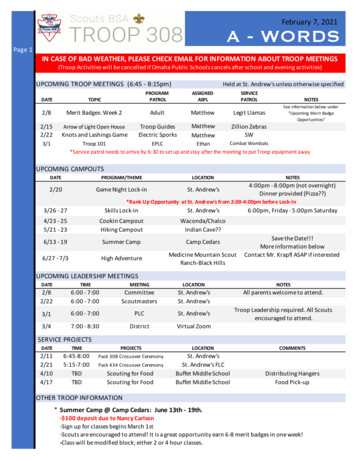
FIGURE2Composite Insurance Pricing Change — By RegionSOURCE: MARSH GLOBAL ANALYTICSUSUKCont. EuropeLatin AmericaAsiaPacific44%31%35%33%34%31%23%21%18% 18% 17%15% 15%14%14%12% 11%8%Q1 20 Q2 20 Q3 20 Q4 20Q1 20 Q2 20 Q3 20 Q4 20Q1 20 Q2 20 Q3 20 Q4 20Regionally, composite pricing increases for the fourth quarter wereas follows (see Figure 2): US: 17%. UK: 44%. Continental Europe: 14%.2 Global Insurance Market Index Q4 20208% 9% 9%6%Q1 20 Q2 20 Q3 20 Q4 209%6%Q1 20 Q2 20 Q3 20 Q4 20 Latin America and the Caribbean: 9%. Asia: 11%. Pacific: 35%.Q1 20 Q2 20 Q3 20 Q4 20
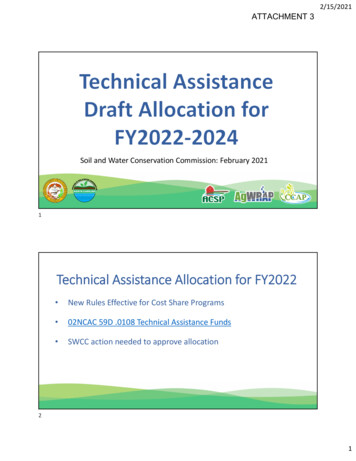
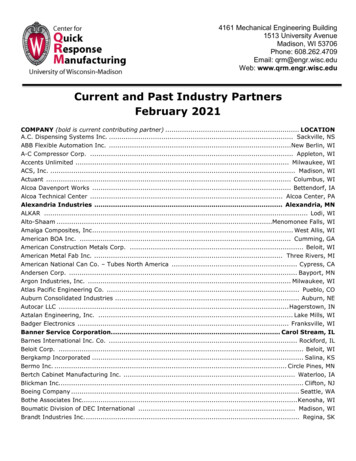
FIGURE3Global Composite Insurance Pricing Change — By Coverage LineSOURCE: MARSH GLOBAL ANALYTICSGlobal PropertyGlobal CasualtyGlobal FinPro47%40%37%26%19%21%20%15%7%5%Q1 20Q2 20Q3 20Q4 20Q1 20Q2 20Pricing in financial and professional lines again had the highestrate of increase across the major insurance product categories (seeFigure 3): Property insurance: 20%.6%Q3 207%Q4 20Q1 20Q2 20Q3 20Q4 20It is important to note that reported pricing changes are averagesand that the data used to estimate the changes cover a wide rangeof clients in terms of size, industry, location, claims history, andother parameters. Many clients experienced pricing changes thatdeviated from the average, some higher and some lower. Casualty insurance: 7%. Financial and professional lines insurance: 47%.Marsh 3
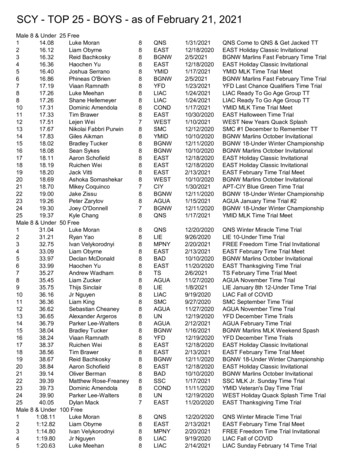
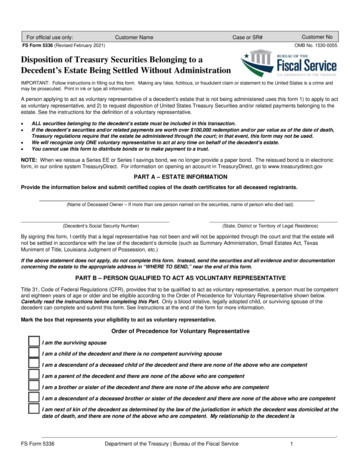
US Pricing: Increases Continue; Plateau PossibleInsurance pricing in the fourth quarter of 2020 in the US increased 17%, year-over-year (seeFigure 4). Although pricing continues to increase, the rate of increase has slowed and thereis evidence that price increases are starting to plateau for some products (see Figure 5).FIGURE4US Composite Insurance Pricing ChangeSOURCE: %2%1%0%-1%-3%-3%Q4 16-2%-2%-2%-2%-3%-3%2%2%1%0%3%1%0%-1%Q1 17 Q2 17 Q3 17 Q4 17 Q1 18 Q2 18 Q3 18 Q4 18 Q1 19 Q2 19 Q3 19 Q4 19 Q1 20 Q2 20 Q3 20 Q4 20Property pricing has increased for 13 consecutive quarters.Casualty pricing in the US increased 9%. Property pricing increased 18%, with 75% of renewing clientsexperiencing an increase, slightly lower than the previousseveral quarters. Excluding workers’ compensation — which declined 4% —casualty pricing increased 15%. Most insurers now indicate their underwriting portfolios arebalanced, and some carriers are starting to become moreaggressive and targeting new business. The average rate of increase is expected to drop in 2021, butdifficult renewals will continue for some. Some industries — including mining, metals, wood products,habitational, chemical, energy, heavy manufacturing, and othertechnical risks — continued to see a contraction of capacity, andthus faced a difficult environment.4 Global Insurance Market Index Q4 2020 Excess liability pricing rose 28%, with 75% of clients experiencingan increase. Most clients were able to fill tower limits; however,many clients elected to purchase less coverage due to cost orrestrictions on terms. In a few instances, a shortage of capacitydictated limit purchases. Prior years of soft pricing on excess liability, combined with poorlosses and continued high jury verdicts, have led to insurerstrying to achieve perceived rate adequacy. Workers’ compensation pricing continued to decrease slightly,but with claim reserves trending upward and the continued lack
FIGURE5US Composite Insurance Pricing Change — By Major Coverage LineSOURCE: MARSH21%22%24%19%18%13%US Property10%4%-5%-4%-4%3%3%3%4%4%-4%US 2%-1%23%28%15%11%US FinPro7%0%-2%-2%-2%-3%1%1%2%3%-2%Q4 16 Q1 17 Q2 17 Q3 17 Q4 17 Q1 18 Q2 18 Q3 18 Q4 18 Q1 19 Q2 19 Q3 19 Q4 19 Q1 20 Q2 20 Q3 20 Q4 20of interest income, some insurers have begun to seek higherrates at renewal. The pandemic has decreased the desire of someinsurers for specific classes of business, including health careand hospitality. Auto pricing increased 8%, but remained competitive.Financial and professional lines rates increased 28%, driven byD&O pricing. D&O for publicly traded companies increased 44%, lower thanthe 51% increase in the prior quarter. 95% of D&O clients experienced pricing increases in the fourthquarter, and 15% reduced limits. Insurer responses to excessive fee litigation has put pressureon fiduciary pricing, making it more challenging to findprimary capacity. Cyber pricing increased 17%, the largest increase since 2015.The increase in ransomware attacks has seen average ransompayments top US 1 million.–– Insurers in many cases have scaled back to a maximum ofUS 10 million in limits on any one risk, and narrowed coveragefor ransomware-related losses.–– All industries have been affected, particularly health care,manufacturing, education, and public entities. D&O pricing moderated as the fourth quarter progressed. In thefirst half of 2021, it is expected that average pricing increases willcontinue to soften, barring unforeseen changes in conditions,although some challenging renewals will exist.Marsh 5
UK Pricing: Thirteenth Consecutive Quarterof IncreasesOverall, insurance pricing in the fourth quarter of 2020 in the UK increased 44% (seeFigures 6 and 7).FIGURE6UK Composite Insurance Pricing ChangeSOURCE: Q4 16 Q1 17 Q2 17 Q3 17 Q4 17 Q1 18 Q2 18 Q3 18 Q4 18 Q1 19 Q2 19 Q3 19 Q4 19 Q1 20 Q2 20 Q3 20 Q4 20Property pricing increased 24%.Casualty pricing increased 6%. The market remained challenging, with pricing increasesconsistent with those observed in the third quarter. General liability (public and product liability) generally increasedmore than other casualty products for both large and midsizeclients. Increases typically ranged from 10% to 15%. In general, larger clients experienced higher increases, in the30% to 35% range. Renewals for larger companies featured significant negotiationson terms and conditions. Increases for smaller companies averaged 15%. Exclusions continued to be a concern in relation to COVID-19 andcyber risk.6 Global Insurance Market Index Q4 2020 The employers liability market remained competitive, with pricingincreases in the low-single digits. Capacity continued to reduce for excess of loss placements. Auto liability clients continued to see pricing increases of 1% to2% as competition remained.
FIGURE7UK Composite Insurance Pricing Change — By Major Coverage LineSOURCE: MARSH24%20%16%UK Property6%-5%UK %UK FinPro15%1%-5%-5%-5%3%5%7%7%7%-3%Q4 16 Q1 17 Q2 17 Q3 17 Q4 17 Q1 18 Q2 18 Q3 18 Q4 18 Q1 19 Q2 19 Q3 19 Q4 19 Q1 20Financial and professional lines pricing increased 90%, largely dueto D&O. Renewals continued to be extremely challenging, with someD&O clients receiving triple-digit increases as capacity departedthe primary and low excess markets. New insurers in the marketin 2021 should bolster the mid-excess space and providesome relief. Insurers justified large D&O price increases and restrictedcoverage terms by citing a deterioration in claims, a COVIDimpacted economy, insolvencies, wrongful trading, and a lag onclaims post government support.Q2 20 Q3 20Q4 20 Commercial crime pricing increased 80%, on average, as insurerscontinued to withdraw from this class of business. Increases of100% were common. For financial institutions (FI) clients, markets continued to monitorcapacity and pushed for higher rates, though there was someslowing in the magnitude of increases from the prior quarter.Pressure on capacity and rate may ease in the future as newentrants come into the market. Cyber pricing increased 25% to 30% due to an increase infrequency and severity of claims. Capacity remained available,but carriers closely managed total capacity deployed on anygiven risk. Some cyber insurers introduced co-insurance/specificransomware strategies.Marsh 7
Latin America and Caribbean Pricing: Property, D&OLead IncreasesInsurance pricing in the fourth quarter in the Latin America and Caribbean (LAC) regionincreased 9% (see Figures 8 and 9). The overall average composite pricing in LAC has nowincreased for 13 consecutive quarters, but the rate of pricing increase has lagged that ofother regions.FIGURE8Latin America Composite Insurance Pricing ChangeSOURCE: 2%-2%1%1%2%2%1%2%1%3%2%8%7%6%5%1%0%-1%-2%-2%Q4 16 Q1 17 Q2 17 Q3 17 Q4 17 Q1 18 Q2 18 Q3 18 Q4 18 Q1 19 Q2 19 Q3 19 Q4 19 Q1 20 Q2 20 Q3 20 Q4 20Property pricing in the region increased 16%.Casualty prices declined 4%. Pricing increases exceeded 15% in several countries, includingChile, Colombia, and Mexico. Insurers pushed to increase price as capacity decreased forcomplex risks. Local capacity and competition in many countries — includingMexico, Brazil, Peru, and Argentina — continued to mitigatecasualty pricing increases. Pricing was somewhat firmer incountries that rely more on facultative capacity, such as Colombiaand Chile. Carriers asked for more information as they analyzed exposuresand selectively deployed capacity. Adequate loss ratios and insurers’ desire to increase their top-linecontinued to mitigate pricing increases across casualty products. Global insurers generally excluded strikes, riots, and civilcommotion (SRCC) from property programs; local marketscontinued to provide that coverage. Auto exposure and claims drove a reduction in auto liabilitypricing, which decreased in many countries, including Argentina,Colombia, and Brazil. General liability pricing increased in the single digits acrossthe region.8 Global Insurance Market Index Q4 2020
FIGURE9Latin America Composite Insurance Pricing Change — By Major Coverage LineSOURCE: MARSH9%9%2%2%14%15%16%-4%-4%-4%LAC Property6%3%0%-4%-5%7%-4%6%-4%5%3%LAC %8%7%LAC FinPro3%2%1%1%2%2%2%1%-1%-2%Q4 16 Q1 17 Q2 17 Q3 17 Q4 17 Q1 18 Q2 18 Q3 18 Q4 18 Q1 19 Q2 19 Q3 19 Q4 19 Q1 20 Q2 20 Q3 20 Q4 20Financial and professional lines pricing rose 22%. D&O generally had the largest price increases, averaging 15%to 20%. Some companies experienced increases above 50%,particularly in Brazil, Colombia, and Chile. Among D&O accounts, 65% of clients experienced aprice increase. D&O pricing increased due to restrictions in market appetite andoverall lack of capacity. The FI and energy, power, and utilities sectors experienced thelargest increases.Marsh 9
Continental Europe Pricing: Increases Stay BelowGlobal AverageInsurance pricing in the fourth quarter of 2020 in Continental Europe (CE) increased 14%(see Figures 10 and 11).FIGURE10Continental Europe Composite Insurance Pricing ChangeSOURCE: %Q4 4%Q1 17 Q2 17 Q3 17 Q4 17 Q1 18 Q2 18 Q3 18 Q4 18 Q1 19 Q2 19 Q3 19 Q4 19 Q1 20 Q2 20 Q3 20 Q4 20Property pricing in CE rose 19%, the ninth consecutivequarterly increase.Casualty pricing increased 5%, the sixth consecutivequarterly increase. Large, complex multinational clients generally experiencedincreases greater than 25% to 30%. Clients’ decisions to increaseretentions and/or reduce limits mitigated some of the impact. Excess casualty and US-exposed placements continued to be themost challenging. Pricing increases for smaller clients were generally in the highsingle to low-double digits. The quarter’s challenges included changes in wordings andinsurers to pursue exclusions, particularly for communicabledisease and cyber. Pricing pressure and capacity limits continued to drive the useof traditional wholesale markets (London and Zurich) and thedemand for alternative structures.10 Global Insurance Market Index Q4 2020 General liability pricing increased in the single digits inmost countries. Pricing for workers’ compensation generally increased in thesingle digits across the region due to tightening capacity. Auto pricing remained generally stable/flat.
Continental Europe Composite Insurance Pricing Change — By Major Coverage LineFIGURE11SOURCE: MARSH10%20%21%5%5%19%9%CE Property8%3%0%-2%CE 2%-2%-1%-4%-1%-2%22%24%22%12%5%CE FinPro2%1%-3%-2%-2%-2%-2%-2%-4%1%2%-3%Q4 16 Q1 17 Q2 17 Q3 17 Q4 17 Q1 18 Q2 18 Q3 18 Q4 18 Q1 19 Q2 19 Q3 19 Q4 19 Q1 20 Q2 20 Q3 20 Q4 20Financial and professional lines pricing increased 22%. Average D&O pricing increases in the larger countries —Germany, France, and Italy — ranged from 25% to 40%, withgenerally higher increases for major programs in distressedsectors or with US exposure. More than 65% of clientsexperienced an increase. Insurers continued to be selective in their approach and theirwillingness to deploy D&O capacity. Pricing increases for financial institutions and professionalliability generally ranged from 10% to 25%.Marsh 11
Pacific Pricing: All Major Lines Continue to IncreaseOverall insurance pricing in the fourth quarter of 2020 in the Pacific region increased 35%,continuing an upward trend that began in 2015 (see Figures 12 and 13).FIGURE12Pacific Composite Insurance Pricing ChangeSOURCE: 2%3%1%-2%Q4 16 Q1 17 Q2 17 Q3 17 Q4 17 Q1 18 Q2 18 Q3 18 Q4 18 Q1 19 Q2 19 Q3 19 Q4 19 Q1 20 Q2 20 Q3 20 Q4 20Property pricing increased 31%, similar to the prior quarter, as theAustralian market suffered heavy catastrophe losses in 2020.Casualty pricing rose 15%, the largest year-over-year increasesince 2012. There continued to be a focus on coverage restrictions andwording to mitigate pricing increases. Bushfire, including power distribution; US-exposedorganizations; and those with frequency claims records oftenexperienced higher increases. Clients reduced limits on large-limit programs to minimizepricing impacts. Underwriters continued to concentrate on pandemic and cyberclauses, catastrophe (CAT) limits and contingent businessinterruption exposures.12 Global Insurance Market Index Q4 2020 Excess layer pricing increased at a higher percentage than didprimary layers. Casualty claims increased due to systemic issues and specificCOVID-19 impacts. Social inflation is rising due to increasedmedical costs, plaintiff friendly jury pools, and third-partyclaims litigation financing — all of which put pressure oninsurer performance.
Pacific Composite Insurance Pricing Change — By Major Coverage LineFIGURE13SOURCE: MARSH28%31%31%23%18%Pacific CasualtyPacific 6%6%6%6%6%6%6%6%9%11%3%0%48%33%23%Pacific FinPro8%13%7%16%23%26%26%28%49%51%33%28%15%7%2%Q4 16 Q1 17 Q2 17 Q3 17 Q4 17 Q1 18 Q2 18 Q3 18 Q4 18 Q1 19 Q2 19 Q3 19 Q4 19 Q1 20 Q2 20 Q3 20 Q4 20 Several underwriters have reduced line sizes, contributing topricing pressure on excess layers.professional indemnity (PI), and FI — were affected by reducedinsurer appetite.Financial and professional lines pricing rose 51%, marking 14consecutive quarters of double-digit increases. Major claims continued to impact the market, particularly aroundlisted company D&O and construction/engineering PI. The financial and professional lines market continued todeteriorate in the fourth quarter. All major lines —D&O, Listed D&O accounts experienced increases above 100% in manycases, with reduced limits common.Marsh 13
Asia Pricing: Property, D&O Increase; Casualty FlatInsurance pricing in the fourth quarter of 2020 in Asia increased 11% year-over-year (seeFigures 14 and 15).FIGURE14Asia Composite Insurance Pricing ChangeSOURCE: 2%1%2%1%0%-3%-3%Q4 16-2%-2%-3%-3%-1%-2%3%2%0%0%-1%-1%-2%Q1 17 Q2 17 Q3 17 Q4 17 Q1 18 Q2 18 Q3 18 Q4 18 Q1 19 Q2 19 Q3 19 Q4 19 Q1 20Property pricing rose 16%, the ninth consecutive quarterof increase. Pricing differentials continued to exist between international anddomestic insurers. The domestic marketplace across most countries insulated smallto medium enterprise clients from the sharpest increases. Clients with large CAT exposures and those requiringinternational capacity continued to experience double-digitpricing increases.Casualty pricing remained generally flat, as it has for three years. The benign claims environment helped to maintain insurerappetite and competition, and slowed pricing movements. Clients with US exposures faced a more challenging market, withupward pressure on pricing.14 Global Insurance Market Index Q4 2020Q2 20 Q3 20 Q4 20Financial and professional lines pricing rose 22%, the largestincrease observed in several years and the seventh consecutivequarter of increase. A reduction in capacity, particularly from global insurers,driven by poor global underwriting results, contributed topricing increases. US-listed D&O was most affected by the increases, which rangedto 100% amid limited insurer appetite. Many clients elected for increased retentions to minimizepremium increases. FIs experienced another quarter of pricing increases. For largerFIs in Asia, insurers pushed to increase retentions, which havehistorically been significantly lower than in rest of the world.Coverage restrictions were imposed on some clients.
Asia Composite Insurance Pricing Change — By Major Coverage LineFIGURE15SOURCE: MARSH18%16%12%8%8%0%0%5%1%0%-1%-2%-2%Asia CasualtyAsia %1%0%-0%22%18%-5%14%8%5%5%Asia FinPro3%0%-3%-5%-3%-3%-2%-1%0%-1%-6%Q4 16 Q1 17 Q2 17 Q3 17 Q4 17 Q1 18 Q2 18 Q3 18 Q4 18 Q1 19 Q2 19 Q3 19 Q4 19 Q1 20 Q2 20 Q3 20 Q4 20 Cyber insurance was more challenging as the underwritingprocess sought increased detail and as coverage was restricted inareas such as ransomware. Commercial crime experienced capacity withdrawal overconcerns about social engineering and phishing-triggered fraud.Marsh 15
For further information, please contact your local Marsh office or visit our website at marsh.com.ASIA AND PACIFICJOHN DONNELLYPlacement Leader 61 (2) 88647736john.donnelly@marsh.comLATIN AMERICAPAULA LOPESPlacement Leader 55 (11) 35327286paula.lopes@marsh.comUS AND CANADACHRISTOPHER LANGPlacement Leader 1 (212) 345 1204christopher.j.lang@marsh.comCONTINENTAL EUROPE,MIDDLE EAST AND AFRICANICK HOLMESPlacement Leader 44 (0)7711 083261nick.j.holmes@marsh.comUK AND IRE
*Note: All references to pricing and pricing movements in this report are averages, unless otherwise noted. For ease of reporting, we have rounded all percentages regarding pricing movements to the nearest whole number. FIGURE1 Global Insurance Composite Pricing Change SOURCE: MARSH GLOBAL A