Transcription
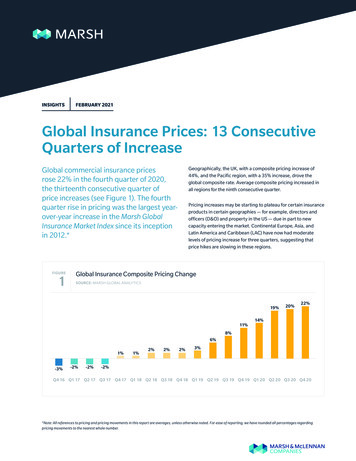
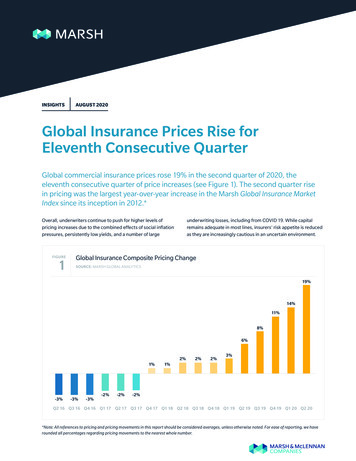
INSIGHTSAUGUST 2020Global Insurance Prices Rise forEleventh Consecutive QuarterGlobal commercial insurance prices rose 19% in the second quarter of 2020, theeleventh consecutive quarter of price increases (see Figure 1). The second quarter risein pricing was the largest year-over-year increase in the Marsh Global Insurance MarketIndex since its inception in 2012.*Overall, underwriters continue to push for higher levels ofpricing increases due to the combined effects of social inflationpressures, persistently low yields, and a number of largeFIGURE1underwriting losses, including from COVID 19. While capitalremains adequate in most lines, insurers’ risk appetite is reducedas they are increasingly cautious in an uncertain environment.Global Insurance Composite Pricing ChangeSOURCE: MARSH GLOBAL 2%Q2 16 Q3 16 Q4 16 Q1 17 Q2 17 Q3 17 Q4 17 Q1 18 Q2 18 Q3 18 Q4 18 Q1 19 Q2 19 Q3 19 Q4 19 Q1 20 Q2 20*Note: All references to pricing and pricing movements in this report should be considered averages, unless otherwise noted. For ease of reporting, we haverounded all percentages regarding pricing movements to the nearest whole number.
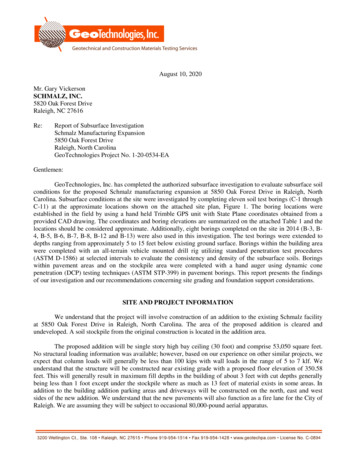
FIGURE2Global Composite Insurance Pricing Change — By Coverage LineSOURCE: MARSH GLOBAL ANALYTICSGlobal PropertyGlobal CasualtyGlobal FinPro37%26%19%18%15%14%13%10%7%5%3%2%Q3 19Q4 19Q1 20Q2 20Q3 19Q4 19Q1 20Q2 20Q3 19Q4 19Q1 20In the second quarter, the insurance market experienced pricing increases across major product categories (see Figure 2): Property insurance pricing increased 19%. Casualty pricing increased 7%.2 Global Insurance Market Index Q2 2020 Financial and professional liability rose 37%.Q2 20
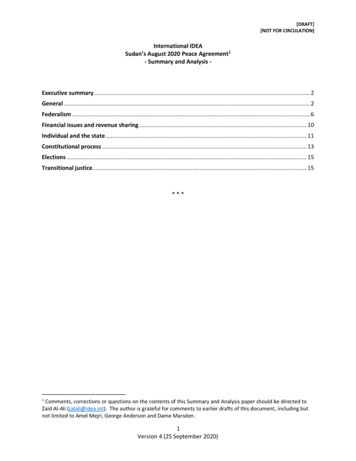
Composite Insurance Pricing Change — By RegionFIGURE3SOURCE: MARSH GLOBAL ANALYTICSUSUKCont. EuropeLatin %12%7% 8%6%4%Q3 19 Q4 19 Q1 20 Q2 20Q3 19 Q4 19 Q1 20 Q2 20Q3 19 Q4 19 Q1 20 Q2 207%5%9%8%6%Q3 19 Q4 19 Q1 20 Q2 205%6%6%Q3 19 Q4 19 Q1 20 Q2 20Q3 19 Q4 19 Q1 20 Q2 20Geographically, composite pricing increased in all regions for the seventh consecutive quarter (see Figure 3): US 18%. Latin America and the Caribbean 8%. UK 31%. Asia 9%. Continental Europe 15%. Pacific 31%.Marsh 3
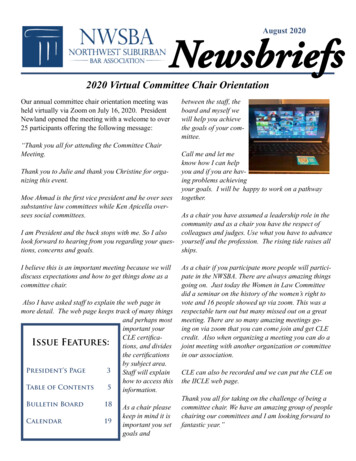
Pricing for D&O Leads US IncreasesInsurance pricing in the second quarter of 2020 in the US increased 18%, year-over-year(see Figure 4). In addition to the overall pricing change, the general trend in the quarter wastoward a firming of prices for the majority of coverages (see Figure 5).FIGURE4US Composite Insurance Pricing ChangeSOURCE: MARSH GLOBAL 2 16 Q3 16 Q4 16-3%-3%Q1 17 Q2 17 Q3 17 Q4 17 Q1 18 Q2 18 Q3 18 Q4 18 Q1 19 Q2 19 Q3 19 Q4 19 Q1 20 Q2 20Property pricing in the US has increased for 11consecutive quarters. Property pricing in the US increased 22% in the second quarter,with many accounts experiencing greater increases. Flow into both the London and Bermuda markets was noticeablyhigher than in prior quarters as clients sought more options. Pricing for smaller organizations generally increased less than formidsize to large risks. Deal structure parameters — for example, limits and deductibles— showed little change from the prior quarter.4 Global Insurance Market Index Q2 2020Casualty pricing in the US increased 8% in the quarter. The excess liability market was up 21%, influenced by concerns ofincreasing claim severity. Auto pricing increased 10%, with over 75% of clients experiencingan increase. Worker’s compensation pricing decreased 2%.
FIGURE5US Composite Insurance Pricing Change — By Major Coverage LineSOURCE: MARSH GLOBAL ANALYTICS22%21%18%13%US CasualtyUS 1%-2%-1%-1%-1%-2%-1%0%-2%-1%1%2%0%30%23%15%11%US FinPro7%0%-2%-2%-2%-2%-2%-3%1%1%2%3%-2%Q2 16 Q3 16 Q4 16 Q1 17 Q2 17 Q3 17 Q4 17 Q1 18 Q2 18 Q3 18 Q4 18 Q1 19 Q2 19 Q3 19 Q4 19 Q1 20 Q2 20Financial and professional liability insurance rates in the USincreased 30%, driven by directors and officers (D&O) pricing. Pricing in the D&O market was up 59%, with more than 90% ofclients experiencing an increase. Overall pricing increased despite the trend toward higherretentions and reduced limits. Incumbent markets generally held onto large portions oftheir D&O portfolios, with very few risks transferring toother carriers. Employment practices liability (EPL) pricing rose 8%, withincreases tied to COVID-19-related issues; many carriers pushedfor higher retentions. Cyber insurance pricing rose 7%.Marsh 5
UK Composite Pricing Rises for the EleventhConsecutive QuarterOverall insurance pricing in the second quarter of 2020 in the UK increased 31%,accelerating the rate of increase observed in recent quarters (see Figures 6 and 7).FIGURE6UK Composite Insurance Pricing ChangeSOURCE: MARSH GLOBAL %-5%Q2 16 Q3 16 Q4 16 Q1 17 Q2 17 Q3 17 Q4 17 Q1 18 Q2 18 Q3 18 Q4 18 Q1 19 Q2 19 Q3 19 Q4 19 Q1 20 Q2 20Property pricing increased 16% in the quarter.Casualty pricing increased 5%. Pricing increased with growing momentum in the secondquarter, a trend that started in early 2019. The sectors of waste,food, and mining are particularly distressed. Clients in any sectorwith poor claims and/or risk management issues are also subjectto above average rate increases. Casualty pricing has increased for four consecutive quarters,following several years of single-digit decreases. Larger organizations generally experienced greater priceincreases than did midsize ones. Flat to minor pricing increases are becoming the norm forgeneral liability and excess liability. Capacity in the market was a challenge, resulting in increasedpremiums, split placements, and more restrictive terms. Little variation in pricing change was observed between largeand midsize clients.6 Global Insurance Market Index Q2 2020 Motor liability coverage showed the largest increases, typicallyin the upper single-digit range. Insurers are closely monitoring the potential impact of COVID19, both in terms of reduced premium income due to a reductionin rateable exposure and eventual COVID-19 claims notifications.
FIGURE7UK Composite Insurance Pricing Change — By Major Coverage LineSOURCE: MARSH GLOBAL ANALYTICS16%10%8%UK %UK %46%28%23%15%UK FinPro7%3%7%7%5%1%-3%-5%-5% -5%-5%-5%Q2 16 Q3 16 Q4 16 Q1 17 Q2 17 Q3 17 Q4 17 Q1 18 Q2 18 Q3 18 Q4 18 Q1 19 Q2 19 Q3 19 Q4 19 Q1 20Q2 20Financial and professional liability pricing increased 64%, drivenlargely by D&O. COVID-19 and increased insolvency exposures drove insurerexpectations of increased claims. D&O pricing showed significant increases with several largeorganizations experiencing hikes above 100%. Generally, midsizeclients saw less pronounced increases, but still experiencedmaterial price changes. The lack of insurer appetite to compete for business has limitedcompetition in the D&O space. The trading environment continued to be a challenge, withinsurers affected by negative prior-year claims development andreduced risk appetites. There were large pricing increases for financial institutionsand commercial crime coverages, in the 30% to 40% range.Significant, but less pronounced, average increases, in the 10% to15% range, were seen for cyber insurance, where capacity is lessconstrained than for other lines.Marsh 7
Latin America Pricing Firms for EleventhStraight QuarterInsurance pricing in the second quarter of 2020 in the Latin America and Caribbean (LAC)region increased 8% (see Figures 8 and 9). The overall average composite pricing in LAC hasnow increased for 11 consecutive quarters.FIGURE8Latin America Composite Insurance Pricing ChangeSOURCE: MARSH GLOBAL Q2 16 Q3 16 Q4 16Q1 17 Q2 17 Q3 17 Q4 17 Q1 18 Q2 18 Q3 18 Q4 18 Q1 19 Q2 19 Q3 19 Q4 19 Q1 20 Q2 20Property pricing in the region increased 14% in the second quarter. Property pricing has increased the last four quarters, afterdeclining or being stable for the prior five years. Increases occurred in all major LAC countries, with increasesgreater than 25% common. Impacts from COVID-19 began to appear in the form of stricterterms and conditions and increased pricing tied to expectationsof future claims. Strikes, riots, and civil commotion affected pricing in Chileand elsewhere.8 Global Insurance Market Index Q2 2020Casualty prices declined 4%, reversing the trend of minor increasesobserved since 2016. Auto and general liability, primarily within Mexico and Brazil,drove casualty pricing decreases in the region. Price reductions in the single digits were typical, and wereconsistent across all segments.
FIGURE9Latin America Composite Insurance Pricing Change — By Major Coverage LineSOURCE: MARSH GLOBAL ANALYTICS14%9%9%2%2%LAC Property6%3%0%-1%-4%-4%-6%-5%7%-4%6%0%-4%5%3%LAC 7%LAC FinPro3%2%0%1%0%-2%1%2%2%2%1%-1%Q2 16 Q3 16 Q4 16 Q1 17 Q2 17 Q3 17 Q4 17 Q1 18 Q2 18 Q3 18 Q4 18 Q1 19 Q2 19 Q3 19 Q4 19 Q1 20 Q2 20Financial and professional liability pricing rose 17% in the quarter. D&O and financial institutions pricing increased 15% to 20%. Pricing increases were consistent with late 2019, suggesting thatfirst quarter 2020 increases of 8% may have been an anomaly. Capacity was increasingly difficult to secure in some markets.Marsh 9
Continental Europe Pricing Driven by Property andFinancial and Professional LinesInsurance pricing in the second quarter of 2020 in Continental Europe (CE) increased 15%(see Figures 10 and 11).FIGURE10Continental Europe Composite Insurance Pricing ChangeSOURCE: MARSH GLOBAL 4%Q2 16 Q3 16 Q4 16-4%Q1 17 Q2 17 Q3 17 Q4 17 Q1 18 Q2 18 Q3 18 Q4 18 Q1 19 Q2 19 Q3 19 Q4 19 Q1 20 Q2 20Property insurance pricing in CE rose 20%, the seventh consecutivequarterly increase.Casualty insurance pricing increased 5% in the quarter, the fourthconsecutive quarterly increase. Property pricing increases in CE accelerated, driven by complexproperty placements and CAT-exposed programs. Excess casualty drove the overall pricing increase, particularly fororganizations with North America exposure. Most major countries — France, Germany, Italy, and Spain — sawdouble-digit increases for CAT and non-CAT property risks. Nocountry in the index reported a decline in property pricing. General liability pricing increases in France, Germany, Italy, andSpain generally ranged from 5% to 15%. Pressure on rate, retentions, and capacity drove an increase in theuse of traditional wholesale markets in London and Zurich, as wellas demand for alternative structures.10 Global Insurance Market Index Q2 2020 Auto pricing was generally stable. Workers’ compensation, whereavailable, increased in the low single digits.
Continental Europe Composite Insurance Pricing Change — By Major Coverage LineFIGURE11SOURCE: Q1 2019 GLOBAL INSURANCE MARKET INDEX20%10%9%CE Property8%3%0%-2%-5%-6%-6%-5%4%4%0%-1%0%-3%CE %22%12%5%CE FinPro2%1%-3%-3%-3%-2%-2%-2%-2%-4%-2%1%2%-3%Q2 16 Q3 16 Q4 16 Q1 17 Q2 17 Q3 17 Q4 17 Q1 18 Q2 18 Q3 18 Q4 18 Q1 19 Q2 19 Q3 19 Q4 19 Q1 20 Q2 20Financial and professional liability insurance pricing increased22% in the quarter. D&O pricing increased more than 50% in France and 25% inGermany and Italy. Pricing increases accelerated particularly for major D&Oprograms in distressed sectors or with US exposure. Pricing for financial institutions and professional liability generallyincreased in the 10% to 20% range in most countries.Marsh 11
Pacific Pricing Continues Upward TrendOverall insurance pricing in the second quarter of 2020 in the Pacific region increased 31%,continuing an upward trend that began in 2015 (see Figures 12 and 13).FIGURE12Pacific Composite Insurance Pricing ChangeSOURCE: MARSH GLOBAL %2%2%1%-2%-2%Q2 16 Q3 16 Q4 16 Q1 17 Q2 17 Q3 17 Q4 17 Q1 18 Q2 18 Q3 18 Q4 18 Q1 19 Q2 19 Q3 19 Q4 19 Q1 20 Q2 20Property insurance pricing increased 28% in the quarter,the eleventh consecutive quarter of year-over-yeardouble-digit increases. Wildfires and other CAT events drove the pricing increase, withconcerns surrounding COVID-19 also having an impact. Policy wordings and coverage edits occurred frequently as ameans to offset or mitigate pricing increases, adjustments todeductibles, and/or SIR increases. There was little competition among insurers, and a generalmove toward reducing line sizes (deployed capacity) on majorplacements, in particular those with CAT exposure.12 Global Insurance Market Index Q2 2020Casualty pricing rose 9%. Casualty pricing continued to increase in the mid-single digits asit has for three years. Wildfire, construction risks, and clients with US exposures facedsignificant increases, ranging from 30% to 50% and above, aswell as reduced capacity. Competition and capacity in the casualty market beganto increase.
Pacific Composite Insurance Pricing Change — By Major Coverage LineFIGURE13SOURCE: MARSH GLOBAL ANALYTICS28%Pacific CasualtyPacific 3%Pacific FinPro8%16%23%26%26%28%33%28%15%7%2%-2%Q2 16 Q3 16 Q4 16 Q1 17 Q2 17 Q3 17 Q4 17 Q1 18 Q2 18 Q3 18 Q4 18 Q1 19 Q2 19 Q3 19 Q4 19 Q1 20 Q2 20Financial and professional liability pricing rose 48% inthe quarter, marking 12 consecutive quarters ofdouble-digit increases. Many listed companies’ D&O programs experienced increasesabove 100%. There were numerous edits to policy wordings to mitigate pricingimpacts, with material changes to deal structure. It was difficult to fill the capacity desired on select programs. Commercial professional indemnity increases ranged from20% to 25%.Marsh 13
Asia Composite Pricing Continues to IncreaseInsurance pricing in the second quarter of 2020 in Asia increased 9% year-over-year(see Figures 14 and 15).FIGURE14Asia Composite Insurance Pricing ChangeSOURCE: MARSH GLOBAL 3%-3%-5%Q2 16 Q3 16 Q4 16Q1 17 Q2 17 Q3 17 Q4 17 Q1 18 Q2 18 Q3 18 Q4 18 Q1 19 Q2 19 Q3 19 Q4 19 Q1 20 Q2 20Property insurance pricing rose 12%. Property pricing increased to varying degrees in all territoriesacross the region with the exception of China, which benefittedfrom abundant domestic capacity. Large, complex, and multinational programs saw the greatestimpact on pricing, deductibles, and limits. CAT-exposed business in the region saw double-digit increasesand a continued reliance on international markets for support. Midsize and SME clients benefitted from strong demand indomestic markets.Casualty pricing was flat in the second quarter. For a ninth consecutive quarter, casualty pricing was generallyflat, following several years of moderate decreases.14 Global Insurance Market Index Q2 2020
FIGURE15Asia Composite Insurance Pricing Change — By Major Coverage LineSOURCE: MARSH GLOBAL ANALYTICS12%8%8%0%0%5%1%0%-5%-3%-1%-2%-2%Asia CasualtyAsia -1%0%0%-0%14%-5%8%5%5%Asia FinPro3%0%-3%-6%-5%-5%-3%-3%-2%-1%0%-1%-6%Q2 16 Q3 16 Q4 16 Q1 17 Q2 17 Q3 17 Q4 17 Q1 18 Q2 18 Q3 18 Q4 18 Q1 19 Q2 19 Q3 19 Q4 19 Q1 20 Q2 20Financial and professional liability pricing rose 14%, the largestincrease observed in several years and the fifth consecutive quarterof increases. A reduction in capacity, particularly from global insurers,contributed to pricing increases. US listed D&O was the most affected by pricing increases, someas high as 100%. Limited insurer appetite drove the market. Financial institutions generally experienced rate increases acrossall coverage lines, as insurer appetite for these risks was limited.The same held true for commercial crime.Marsh 15
For further information, please contact your local Marsh office or visit our website at marsh.com.ASIA AND PACIFICJOHN DONNELLYPlacement Leader 61 (2) 88647736john.donnelly@marsh.comLATIN AMERICAPAULA LOPESPlacement Leader 55 (11) 35327286paula.lopes@marsh.comCONTINENTAL EUROPE,MIDDLE EAST AND AFRICANICK HOLMESPlacement Leader 44 (0)7711 083261nick.j.holmes@marsh.comUK AND IRELANDANDREW CHESTERPlacement Leader 44 (0)20 7357 3774andrew.chester@marsh.comUS AND CANADACHRISTOPHER LANGPlacement Leader 1 (212) 345 1204christopher.j.lang@marsh.comBOWRING MARSHTOM DAVIESGlobal Wholesale Placement Leader 44 (0)20 7357 1030tom.davies@marsh.comMarsh is one of the Marsh & McLennan Companies, together with Guy Carpenter, Mercer, and Oliver Wyman.This document and any recommendations, analysis, or advice provided by Marsh (collectively, the “Marsh Analysis”) are not intended to be taken as advice regarding any individual situation and shouldnot be relied upon as such. The information contained herein is based on sources we believe reliable, but we make no representation or warranty as to its accuracy. Marsh shall have no obligation to updatethe Marsh Analysis and shall have no liability to you or any other party arising out of this publication or any matter contained herein. Any statements concerning actuarial, tax, accounting, or legal mattersare based solely on our experience as insurance brokers and risk consultants and are not to be relied upon as actuarial, tax, accounting, or legal advice, for which you should consult your own professionaladvisors. Any modeling, analytics, or projections are subject to inherent uncertainty, and the Marsh Analysis could be materially affected if any underlying assumptions, conditions, information, or factorsare inaccurate or incomplete or should change. Marsh makes no representation or warranty concerning the application of policy wording or the financial condition or solvency of insurers or reinsurers.Marsh makes no assurances regarding the availability, cost, or terms of insurance coverage. Although Marsh may provide advice and recommendations, all decisions regarding the amount, type or terms ofcoverage are the ultimate responsibility of the insurance purchaser, who must decide on the specific coverage that is appropriate to its particular circumstances and financial position.Copyright 2020 Marsh LLC. All rights reserved. 543193337
Global Insurance Prices Rise for Eleventh Consecutive Quarter *Note: All references to pricing and pricing movements in this report should be considered averages, unless otherwise noted. For ease of reporting, we have rounded all percentages regarding