Transcription
FloMaxSoftware for CytometryOperating Manual- Data AnalysisVersion 2.3, 03.05.2001FloMax Operating Manual – Data Analysis1
ContentsGeneral Information . 4Conventions Used in this Manual . 5Introduction to FloMax Software . 6Software Installation . 8Software Registration . 9Screen Elements . 10Introduction – One-Parameter Histograms. 11Introduction - Correlated 2 Parameter Dotplots. 13Introduction – FloMax Start and Exit . 15Introduction – Typical Steps for a Immunophenotype Analysis . 16Introduction – Typical Steps for a Kinetic Analysis. 17Introduction – Typical Steps for DNA Cell Cycle Analysis. 18Introduction – Typical Steps for Microorganism Analysis . 19Opening a Flow Cytometry Data File . 20Saving an Analyzed Flow Cytometric File . 21Printing the Histogram Page . 22Printer Setup. 23Selecting the Page Layout . 24Selecting Histogram Properties . 25Histogram Properties . 26Analysing Channel Contents. 28Absolute Cell Counting / Analysing the Particle Concentration . 29Rerun From File Function . 30Zoom Function. 31Gating - Defining Regions. 32Gating - Applying Gates. 33Gating - Logical Gates . 34Gating - Saving and Loading Gates and Regions . 35Gating - Moving, Resizing, and Deleting Regions . 36Gating - Obtaining Statistics . 37Gating – Saving Region Statistics to a File . 38Gating – Exporting a Gated File. 39Gating - Color Gating. 40Crosstalk Compensation - Overview. 42Crosstalk Compensation - Setup . 43Crosstalk Compensation – Saving and Loading . 44Crosstalk Compensation – Exporting a Compensated File . 45Crosstalk Compensation - Notes . 46Cell Cycle Analysis . 48Peak Analysis – Numerical Fit Method . 49Peak Analysis – Find Peaks Range Method & Batch Analysis. 50Peak Analysis – Histogram Export. 51Ratio Analysis. 52Calculated Parameters . 53Calculated Parameters – Examples. 54Calculated Parameters – Examples. 55Calculated Parameters – Function Overview . 56Panels - Overview. 57Panels- Definition. 58Panels - Optimizing. 59Generating Reports – Copy & Paste. 60Generating Reports . 61Appendix – Software Support . 62Appendix - Mathematical Formulas. 63Appendix – Computer Recommendations . 74Appendix – Software Specifications. 75Appendix – Menu Function Overview . 77Index. 78FloMax Operating Manual – Data Analysis2
FloMaxSoftware for CytometryOperating Manual – Data AnalysisVersion 2.3 2001 by Partec GmbH, Münster, GermanyFloMax Operating Manual – Data Analysis3
General InformationQuestionsFloMax is made for you! New software versionsand you profit from your requests for new featuresor software changes. Partec is continuouslyworking on software to fulfill your demands. If youhave questions concerning this manual or thesoftware, if you find problems associated withFloMax, or if you have a good suggestion to beincluded in a new version, please let us know bysending an email or a note to Partec.DisclaimerFloMax software and this manual are intended tobe used by experienced flow cytometrists. FloMaxwas developed and tested to make flow cytometrydata analysis more comfortable. Complexsoftware like FloMax and this manual however donot claim to be completely error-free. As with allsoftware, results obtained with FloMax should bechecked and verified critically by the user. Partecrecommends to test FloMax for a specificapplication before running large scale sampleseries. Partec provides FloMax “as is”. Partecdoes not take responsibility that FloMax is suitedfor a specific application. Partec also does nottake responsibility for any direct or indirectdamage that could be caused by FloMax or basedon results obtained by FloMax. Especially noresponsibility can be claimed for data or reagentloss due to the use of FloMax.Trademarks and CopyrightsThis manual contains references to names andproducts from Partec and other companies whichare registered trademarks or protected bycopyright.Partec GmbH: PAS, PA, CCA, Robby .Quantum Analysis GmbH: FloMax .Cytecs GmbH: CyFlow .Microsoft Corp.: Windows, Word,PowerPoint, Paint.Hewlett Packard : Deskjet, Laserjet.Excel,FloMax Operating Manual – Data Analysis4
Conventions Used in this ManualSelection of Menu FunctionsThe location of menu selections is frequentlynoted in a short form as in the following example:Analysis – Calculate Parameters – Formula denotes the following menu selection:Notes and TipsNotes and tips are denoted by this symbol.Mouse Operationclick – single click with the left mouse key.doubleclick – two consecutive clicks with the leftmouse key.right click – single click with the right mouse key.FloMax Operating Manual – Data Analysis5
Introduction to FloMax SoftwareWhat. is Partec FloMax?Partec FloMax software is an all-in-one solutionfor acquisition and analysis of flow cytometricdata. FloMax data analysis works with data fromflow cytometers that support the flow cytometryfile standard (FCS). FloMax operates oncomputers with Windows 95, 98, and 2000. Dataacquisition and instrument control by FloMax isprovided for Partec Flow Cytometers. topics are covered by this manual?FloMax – Data Analysis (this manual) covers allaspects concerning the flow cytometric dataanalysis. Most of the functions are available onlineduring acquisition as well as offline for filesalready stored. other manuals are available?FloMax - Instrument Control and DataAcquisition covers additional functions for use ona Partec flow cytometer.Please consult the Instrument OperatingManuals for your particular flow cytometer fordetails on the instrument operation.Application Notes and Tutorials are available toget started and contain hints to achieve the bestresults. if my cytometer isn’t a Partec?FloMax supports the FCS (flow cytometrystandard) data format. This makes FloMaxsuitable for data analysis from any flow cytometer,offering unique functionality and automation. are the applications for which FloMax canbe used?FloMax offers automation for routine use andflexibility for research use for practically any flowcytometric application. The applications cover: Routine Immunophenotype Blood CellAnalysisLeukocyte CountingRare Event AnalysisDNA Cell Cycle AnalysisPloidy AnalysisMicroorganism Analysis (live/dead)Fermentation ControlParticle Concentration AnalysisTrue Volumetric Absolute CountingParticle Size and Fluorescence DistributionAnalysisFloMax Operating Manual – Data Analysis6
Introduction to FloMax SoftwareWhat. functions are offered by FloMax?FCS Data Analysis and Report Generation additional features offers FloMax inconjunction with Partec flow cytometers andsample automates?Instrument control and data acquisitionfunctions are covered in a separate manual.Flexible data display on pages with 1-8 oneand two-parameter histograms and dotplotsMultiparameter Gating with logical gatesMultiColor GatingColour Crosstalk Compensation by SoftwareDNA Cell Cycle and Peak AnalysisCalculated ParametersPanel SystemAutomated Report Generation in conjunctionwith MS Word and Excel .Instrument Control and Data Acquisition Flow cytometer instrument controlRealtime AcquisitionTrue Volumetric Absolute CountingComplete walk-away sample preparation andanalysis. should I know before operating FloMax?. can I do in case I have questions orproblems?This manual assumes you have basic knowledgeabout flow cytometry. In the best case a wellexperienced "flower" is around - so let her/himhelp you. Many basic books are available aboutflow cytometry which may help you as well.FloMax makes operation as simple as possible.When you are familiar with Windows and otherWindows software, you will find it quite easy tooperate FloMax. We at Partec are proud if wemay assist you with any question you have withyour application. Don’t hesitate to contact us!Partec continuously publishes application noteswhich might contain important hints not coveredby this manual. Please inquire for the latest list ofapplication notes.Partec is available for your support. Don’t hesitateto contact us by email, fax or telephone.FloMax Operating Manual – Data Analysis7
Software InstallationShortguide for FloMax Installation1. Archivate existing FloMax folder: E. g. renameC:\FloMax to C:\FloMax20.IMPORTANT: If you don’t archivate your existingversion it will be overwritten.FloMax Installation CD.If automatic launching of installation programsis disabled on your computer, the installationprogram does not start automatically. In this case,select Start-Run in the Windows toolbar andtype D:\setup.exe. Press OK and proceed withstep 3.2. Insert the FloMax Installation CD– after some seconds, the FloMax installationprogramm starts.3. Follow the instructions given by the installationprogram. Use the defaults whenever possible.- FloMax will be completely installed.- The FloMax icon appears on the desktop (andunder Start - Programs).FloMax Operating Manual – Data Analysis8
Software RegistrationSoftware RegistrationIn order to offer you the best possible support forFloMax, you should register for a full license. A fulllicense allows you to use FloMax on one or morecomputers in your laboratory which are under yourresponsibility.Without software registration, FloMax can be runin a “demo mode” with limited options.About FloMax box.How to get the registration codeIf you purchased FloMax or a flow cytometertogether with FloMax, in order to receive yourpersonal registration code:1. Make sure FloMax is installed on yourcomputer and start FloMax.- When FloMax is not registered yet, the SoftwareRegistration dialog appears asking you forregistration.orSelect Help-About FloMax in the menu- the About FloMax box appears.Click Register - the Registration dialog appears.Software Registration Dialog.3. Click Get Registration Code – the Software Registration Form appears.4. Fill out the form completely with your name,address, and all other information.5. Click “Print Registration Form”, print the formon a printer.Fax the form to Partec to the fax no. given below.orCall Partec at the phone no. below.orClick Editor and cut and paste the registrationform to an e-mail. Send the e-mail to the addressbelow. This is the preferred way.- Within a short perioud, you will receive theFloMax registration code by Partec.Software Registration Form.Each computer requires a separateregistration. For each laboratory computer, aseparate registration form should be submitted toPartec. With a full license, you may inquireregistration codes for one or more computers inyour laboratory you are using.FloMax RegistrationPartec GmbH, Münster, GermanyPhone 49 2534 8008-0Fax 49 2534 8008-90E-Mail flomax@partec.deFloMax Operating Manual – Data Analysis9
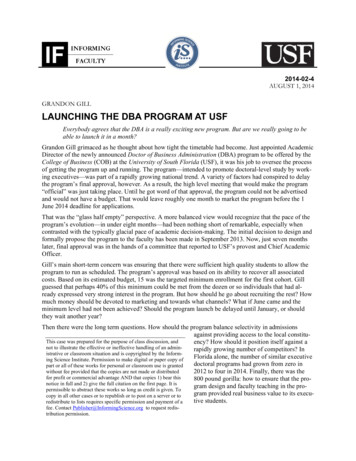
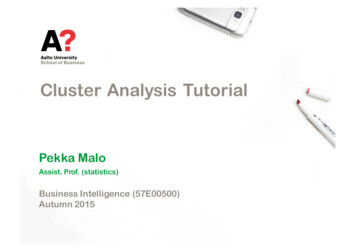
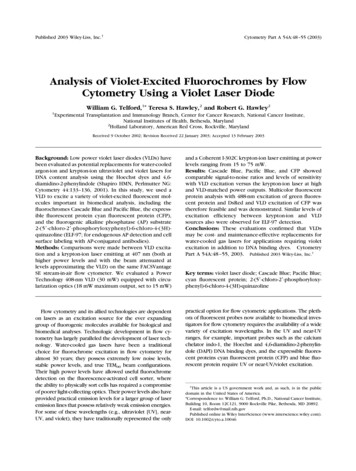
Screen ElementsMenu BarTitle BarPlot Property BoxDialogSelectionFrame withTrackersPlot Selection MarksPlotsResults FieldButtonsMouse CursorStatus BarToolbarTooltipScrollbarElements on the FloMax software screen.FloMax Operating Manual – Data Analysis10
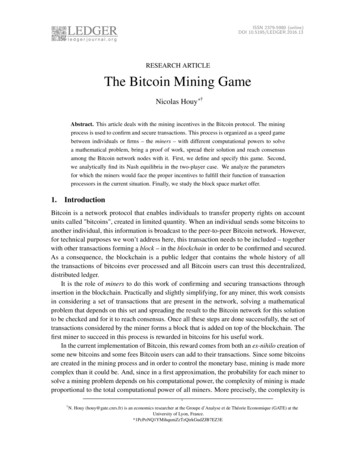
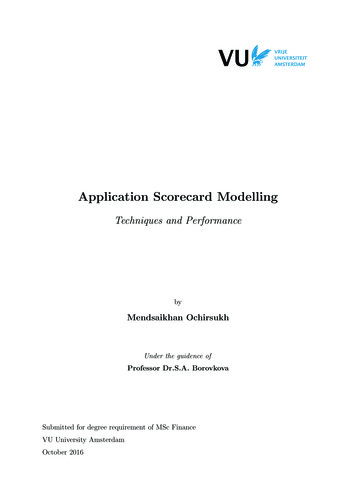
Introduction – One-Parameter HistogramsWhat is. a parameter?. a one-parameter histogram?In flow cytometry, parameter denotes a measuredproperty of the particles. Frequently, a parameteris synonymeous to an optical channel. E.g. aninstrument with 6 parameters is equipped with 6optical detectors. Parameter no. 6 could e.g. bethe blue fluorescence parameter that could becalled FL4 and mainly be used for DNA analysis.A one- parameter histogram displays thedistribution of cell contents, e.g. how manycells contain a given quantity of DNA or bind agiven number of antibody molecules. a histogram channel?The cell content is assigned to one of many (e.g.65536) quantity classes or channels. In a oneparameterhistogramthechannelsarerepresented on the x-axis. the count in a histogram?The number of cells being assigned to a givenchannel is referred to as channel content orsimply count. In a one-parameter histogram, thecount is shown on the y-axis. a peak?All cells having about equal quantity of the cellcontent, e.g. DNA, form a peak. In the case a oftypical DNA histogram e.g., one peak representsthe G1 and another (with twice the channel value)represents the G2/M phase of the cell cycle.In the case of immunolabelled cells, there isusually one peak for unlabelled (negative) andone peak for labelled (positive) cells.Peaks can be analyzed by drawing ranges or bynumerical fits, e.g. in order to know the meanintensity or number of cells in a peak. background in a histogram?Histograms sometimes show undesired signalsin the lower channels, frequently called noise orbackground. These signals can originate fromcell fragments or other particles resulting fromsample preparation. In case of high gains,background can also be caused by not sufficientlyclean sheath fluid or by background light. the lower level (L-L)?The lower level (L-L) threshold is a means tosuppress background signals. Signals below thelower level are rejected from the histogram duringacquisition. To exclude noise from a histogramalready acquired, a range-gate can be used.FloMax Operating Manual – Data Analysis11
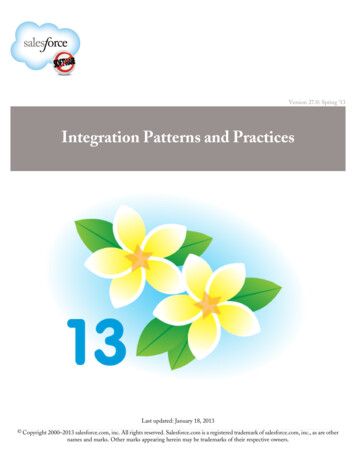
Introduction – One-Parameter Histogramspeak of normal G1-cellspeak of tumor G1-cellscountslower levelthresholdpeak of tumor (G2 M)-cellsbackgroundchannelsOne-parameter histogram with 512 channels. EAT cells (DAPI-staining, HBO-lamp excitation). Backgrounddue to cell fragments.One parameter histogram of immunolabelled lymphocytes (green fluorescence excited by Ar-laser). Theunlabelled cells (“neg.”) appear in the left peak (autofluorescence and unspecific antibody binding); brightlylabelled cells in the right peak. Dimly labelled cells appear between the peaks. Note the log-scale typicallyused for this kind of measurements.FloMax Opera
a Partec flow cytometer. . In flow cytometry, parameter denotes a measured property of the particles. Frequently,