Transcription
Paper 3261-2015Creating a Data Quality ScorecardTom Purvis, Qualex Consulting Services, Inc.Clive Pearson, Qualex Consulting Services, Inc.ABSTRACTThe approach in this paper shows users how to develop a data quality scorecard based on rules, andjudged against a set of standards set by the user.Each rule (a/k/a metric) has a standard that determines whether it passes, fails, or needs review (agreen, red, or blue score). A rule can be as simple as: Is the value for this column missing?, or is thiscolumn within a valid range? Further, it includes comparing a column to one or more other columns, orchecking for specific invalid entries. It also includes rules that compare a column value to a lookup tableto determine whether the value is in the lookup (a/k/a reference) table.Users can create their own rules and each column can have any number of rules. For example, a rule canbe created to compare a dollar column to a range of acceptable values. The user can determine that it isexpected that up to two percent of the values are allowed to be out of range. If two to five percent of thevalues are out of range, then data should be reviewed. And, if over five percent of the values are out ofrange, the data is not acceptable.The entire table has a color-coded scorecard showing each rule and its score. Summary reports showcolumns by score and distributions of key columns. The scorecard enables the user to quicklyassess whether the SAS data set is acceptable, or whether specific columns need to be reviewed.Drill-down reports enable the user to drill into the data to examine why the column scored as it did. Basedon the scores, the data set can be accepted or rejected, and the user will know where and why the dataset failed.The approach can store each scorecard data in a data mart. This data mart enables the user to reviewthe quality of their data over time. It can answer questions such as: is the quality of the data improvingoverall? Are there specific columns that are improving or declining over time? What can we do to improvethe quality of our data?INTRODUCTIONMany users would like to check the quality of data after the data integration process has loaded the datainto a data set or table. SAS has many products that automate the data integration and/or data qualityprocess. However, if the user does not own these products, or the process does not warrant this level ofautomation, then a Base SAS solution might be more appropriate. This paper describes such anapproach.This scorecard is not intended to replace the quality control of the data integration or ETL process. It is a supplement to the ETL process. The programs are written using only Base SAS and Output DeliverySystem (ODS), macro variables, and formats. This paper shows how to: (1) use ODS HTML; (2) colorcode cells with the use of formats; (3) use formats as lookup tables; (4) use INCLUDE statements tomake use of template code snippets to simplify programming; and (5) use hyperlinks to launch storedprocesses from the scorecard.1
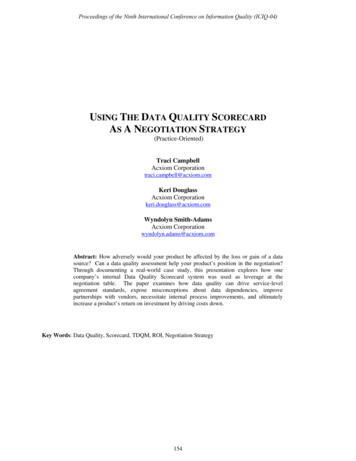
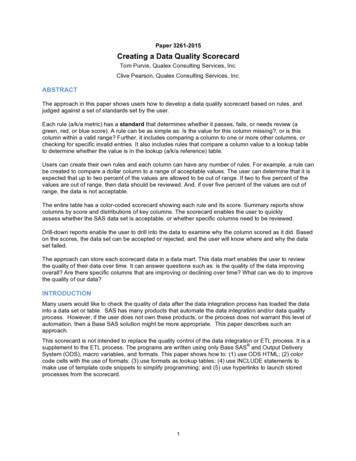
A FLOWCHART OF THE PROCESSFlowchart of Data Quality ProcessColor CodesSAS DatasetsSAS ProgramsExcel SpreadsheetSAS FormatsSAS OutputFile nFile 04File 03File 02Dim xDim GDim FDim EDim DDim CDim BFIle 01Input DataSAS DatasetsStandardsDim AReference DataEtc.Col compared to DateCol Not in ReferenceNumColNullExcel SpreadsheetImportStandardsSAS DatasetsCharColNullFormat CreationTemplateProgramsProgramSAS EG Process FlowFMT DIM xFMT DIm GFormatsFMT DIMFFMT FormatsDIM EFormatsFMT DIMDFormatsFMT DIM CFormatsFMT DIM BFormatsFMT DIM AFormatsProgram nProgram 04Program 03Program 02File nFile 04File 03File 02Program 01File 01StandardsMetricProgramsSAS DatasetsFormatsFile nFile 04File 03File 02File 01MetricSAS DatasetsFile nFile 04ReportFile 03File 02ReportFile 01ReportScoring andReportsReportReportProgramDrilldown Report03 April 2014Figure 1. Flowchart of the Scorecard ProcessPROCESS DESCRIPTIONRULES SPREADSHEET:As described in the following pages, this data quality check process begins with a spreadsheet of rules (atab is created for each file being reviewed – in the flowchart these files are shown as File01 . File n).There is no limit to the number of file types included. Each rule represents one check performed on onecolumn. Each rule is executed on each row of data.Examples of common rules include: Is the column value blank? Is the date column value (e.g., birthdate) after today? Is the value in the column found in a reference table? (e.g., is postal code valid? Is this code inthe dimension table?) Is the column value blank but other column is not blank? (e.g., a customer ID is present butcustomer name is blank) Is column A greater than Column B? (any column with any comparison to any other column)2
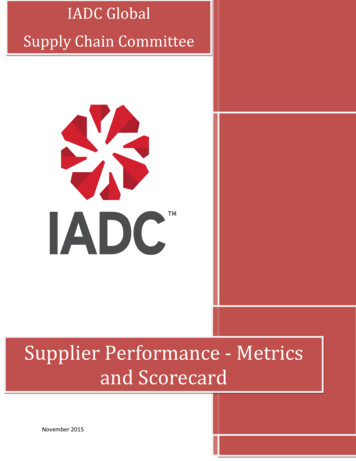
Each rule is assigned a metric ID to uniquely identify the rule. (For this paper “metric” and “rule” aresynonyms).Each rule is also assigned a set of percentages to score the rule into three levels (categories): Green,Blue, and Red. (The user can change the colors).For example, if rows for column A are blank for 0 to 10 percent of all records then this rule is scored as“Green”. If the rule scores greater than 10 percent but less than 20 percent, then the rule is scored as“Blue”. If the rule is scored over 20 percent with blank values then the rule is scored as “Red”.These thresholds are set by the user and can be changed at any time. Threshold levels can be set sothat only two levels apply.Within the spreadsheet each rule is defined and the ranges are set for each level (color). There is no limitto the total number of rules, and a column can have multiple rules, as long as each rule is a separate rowin the spreadsheet.Table 1 is a sample standards spreadsheet:Table 1. Standards SpreadsheetThis spreadsheet defines each rule, its column, and its thresholds. One tab in the spreadsheet is usedfor each file type being checked.The spreadsheet resides in any directory that the user chooses. A simple SAS Enterprise Guide (SASEG) project imports each tab of the spreadsheet into a permanent SAS dataset placed in the data path.The path in the scoring program can be changed to point to any number of scoring datasets if the userwants to use different scores or rules for different sources.METRIC PROGRAMS:Each input data file type has a metric program that consists of a series of rule (metric) templates. Atemplate is small set of program lines that use SAS macro variables to make the template specific to arule defined in the spreadsheet. One template represents one type of rule (e.g., does the column hasblank values?). A template can be used over and over again for whatever rules apply. There is no limit tothe number of templates.Sample of Metric Program: Highlighted lines show the calls to the template programs.data work.metrics ;length metric id 16 rowfailed rows processed 8 ;set sasin.&inputname. end end ;keep metric id rowfailed rows processed ;rows processed 1 ;/******** Rule XXXX ***********/%let metric id RuleXXXXX ;3
%let col Column ZZZZ;%include "&path.\template name.sas" / source2 A section of code for each rule.For checks against reference tables, a SAS format is used for the specific case of a rule matching acolumn in the file to a reference table. Each reference table is read into a temporary SAS dataset andthen this data is used to create a SAS format. A rule is created and a template is added to the metricprogram to check the value in the file to the format. If the value is not in the format then the row iscounted as “failed”.For example, a reference file might contain all valid postal codes. A SAS format is created for these validpostal codes. Each value for the column “postal code” in the file is compared to the SAS format andthose rows that do not match the format are counted as “failed”. The percentage of failed rows to all rowsin the file is compared to the thresholds set in the spreadsheet to score the rule as Green, Blue, or Red.There is no limit to the number of reference files used (but using a lot of formats may fill up memory).Reference files are converted to SAS formats by a simple program that reads the data and creates a SASformat. Each reference file creates one unique format and the format is named to be a mnemonic of thereference file.Sample Template file for calling a reference file via a SAS Format:metric id "&metric id." ;if strip(&col.) NE " " andstrip(put(&col.,&fmttest.)) strip(&col.) then rowfailed 1 ;elserowfailed 0 ;output ;%let metric id ; /* these lines reset the macro variables so they will not persist. */%let col ; /* these lines reset the macro variables so they will not persist. */%let fmttest ; /* these lines reset the macro variables so they will not persist. */Below is sample code to create a reference format:libname fmts "/sasdata/data/" ; /* This is the path where data is stored /*options fmtsearch (fmts) ; /* This option ensures the format library is searched by SAS */%let type C ;/* This creates a Character Format */%let destin fmtZIP ;/* The name of the format is fmtZIP */%let source zipcodes ; /* The source of the reference table is zipcodes */%let length 5 ;data work.&source. ;set fmts.&source. ;start substr(strip(ZIP9),1,&length.) ; /* The Zip format uses the first 5 digits */label "Found" ; /* In most reference files this would be the descriptionand therefore the line would be label columnxxx wherecolumnxxx is the column of the description in the reference fileSince there is no description for zip codes the text “Found”is used as a place holder.*/run ;proc sort data work.&source. ;by start label ;run ;data work.&source. ;set work.&source. ;by start label ;if last.start ;/* Only one record per unique value allowed. */run ;4
data fmts.&destin. ; /* This writes the format data under the same name as the format */set work.&source. ;fmtname "&destin." ; /* The format name is the destination defined above */type "&type." ;end start ;length &length. ;/*if length(strip(&start.)) NE &length. then delete ;*/keep start end label type length fmtname ;run ;proc format cntlin fmts.&destin. library fmts.formats; /* This line creates the format */run ;Many types of reference files can be adopted as rules. This is specifically useful when the file containscolumns of codes and the database has dimension tables that describe the codes. Each dimension tablecan be converted into a SAS format and each value for a column in file can be checked to ensure it has avalid match in the dimension table. For example, if the file has a column for part number, and there is adimension (or other table of part descriptors), a rule can be created to count the number of invalid partnumbers. That is, rows in the files that contain a part number do not match any of the valid partdescriptors in the reference table.Note that the formats are special tables loaded into memory. Too many formats used forreference files or formats that are very large may cause the system to run out of memory.5
SCORECARD REPORT (ONE PER FILE)Section A: General InformationThis section tells the user general information about the file, including number of columns and rows. Asummary score section shows how many columns scored within each level (color) and how many metrics(rules) scored within each level. This summary gives the user a quick view of the data quality of file.Output 1. Section A of the Report (General Information)6
Section B: The Column Level Report (Partial List)Section B of the report shows a detail report by column. This section shows each column and thenumber of rules by score (color). This is a first level of detail to understand where the issues with the filemight reside.Output 2. Section B of the Report (Column Summary)7
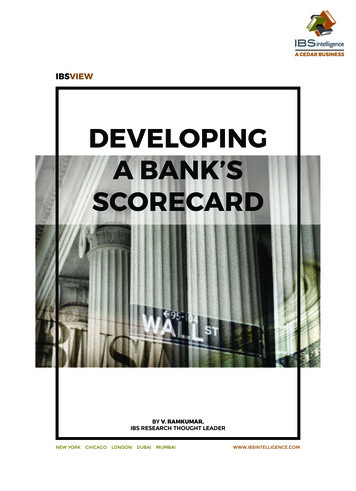
Section C: The Column Details Report (Sample Partial List)Section C of the report is a detail list of each rule showing the column being evaluated, the number ofrows that failed, the total number of rows processed, the percentage of rows that failed, and the score.This part of the report also has a hyperlinked column for each rule that will launch any program the userdirects to further evaluate the detail. Since this action is so flexible and dependent upon the source file,no example report is included in this paper.Column Details ReportColumn NameTest / MetricRows FailedRows ProcessedPercent FailedScoreColumn NameColumn Name: rows NULL85921.4%FailColumn NameColumn NULL35920.5%FailColumn NameDOB: Date GT Run Date25920.3%FailColumn NameDOB: Date LT 190025920.3%PassColumn NameDOB: Column NULL65921.0%FailColumn NameEmail: Column NULL255924.2%FailColumn NameName: Column NULL95921.5%FailColumn NameGender Column NULL95921.5%FailColumn NameGender: evaluate distinct values135922.2%FailColumn NameRelationship: Column NULL35920.5%FailColumn NameLast Name: Column NULL45920.7%FailColumn NameCustomer Id: Column NULL185923.0%FailColumn NameCustomer Id: start w/025920.3%FailColumn NameCustomer Phone: Column NULL65921.0%CheckOutput 3. Section C of the Report (Column Detail)Section D: Frequency Analysis (no output shown)Section 4 of the report is a frequency analysis of selected character columns (using PROC FREQ). Thissection of the report is used for analysis of columns that cannot be described by a simple rule. In somecases the user is interested in a frequency of values for a column. This information cannot be scored ona row-by-row basis. For this analysis the report can show the top X values for selected columns and the8
top X values for the length of the selected columns. (X is a number that is user selected at the time thereport is run).For example, a user might wish to know the top 10 customer numbers to ensure that dummy numbers arenot included (e.g., 111111111, 999999999). Often, dummy or test values are accidently included inproduction files. These dummy values are often seen much more frequently than valid values. Also,reviewing the lengths of the customer numbers might show that some percentage of values is too small tobe valid customer numbers.No section D report is included for numeric columns. However, a PROC MEANS or PROC UNIVARIATEcould be added to create such a report.TAKING THE PROCESS FURTHERTIME SERIES REVIEWEach time the user runs this application they create one summary SAS dataset for a file for a time period.By permanently storing these files the user can build a data mart of scores over time for every file typeprocessed.This data mart has three important uses. First, it can be used to establish data-driven standards for whatcan be expected from the input source. Standards can be adjusted if the reality of the data quality isdifferent (higher or lower) than the expected. Second, the data mart can be used to trend data quality byfile type and column over time. Data suppliers can be shown with confidence that their data quality isimproving or deteriorating. Third, if the user has multiple suppliers of common data (e.g., vendors), theuser can make inter-supplier comparisons of data quality to grade the suppliers against each other.Building a data mart of quality scores has many advantages and provides the user more than a file-at-atime report.CONCLUSIONThe data quality scorecard solution is a simple but highly effective process that allows users to includethe important data quality review process within a legacy ETL process. The process requires only BaseSAS, is completely controlled by the user, and is highly flexible.CONTACT INFORMATIONYour comments and questions are valued and encouraged. Contact the authors at:Tom PurvisSenior ConsultantQualex Consulting Services, Inc.email: tom.purvis@qlx.comSkype: tompurvisjrmobile: 1 904-233-3355Clive PearsonCEOQualex Consulting Services, Inc.email: clive.pearson@qlx.comwww.qlx.comSAS and all other SAS Institute Inc. product or service names are registered trademarks or trademarks ofSAS Institute Inc. in the USA and other countries. indicates USA registration.Other brand and product names are trademarks of their respective companies.9
SAMPLE CODESAMPLE TEMPLATE CODEThis code is a template used to determine if a character column is blank (null).metric id "&metric id." ;if strip(&col.) "" then rowfailed 1 ;elserowfailed 0 ;output ;%let metric id ; /* reset macro variables */%let col ;SAMPLE METRIC CODEThis code is a sample stored process showing how the templates might be used to count rows failed forlater scoring. Ultimately this code would include a section for each rule (metric) and there is one programfor each file type. The code highlighted in yellow below shows how the sample template code abovewould be called.*ProcessBody ;/*filename webout " path /htmlout.html" ;*/%let inputname name of input file ;%let standard name of accompanying standard ;/* Parameters for Section D of report (character columns to review frequency) */%let num 3 ; /* how many columns to include in the table report must equal the list below */%let col1 column name ;%let col2 column name ;%let col3 column name ;/* however many columns set in “let num ” should have a “let colN” statement */libname sasin BASE " path " ;libname fmts BASE " path " ;%let path path /includes/ ;%let pathscore path /programs/ ;%let ODSDEST TAGSETS.HTMLPANEL;%let odsoptions rs none;%let odsstyle &style ;%let ODSSTYLESHEET ;%let embedded titles yes ;%let panelborder 16 ;ODS ESCAPECHAR ' ' ;options device activex fmtsearch (fmts.formats) ; /* libname fmts must be set */%STPBEGIN ;ODS ESCAPECHAR ' ' ;10
data work.metrics ;length metric id 16 rowfailed rows processed 8 ;set sasin.&inputname. end end ;/* libname sasin must be set */keep metric id rowfailed rows processed ;rows processed 1 ;/*First RuleXXXXXXX001 (e.g. Check NULL/Blank Value) *//******** XXXXXXXXX001 ***********/%let metric id XXXXXXXXX001 ;%let col numeric column name ;%include "&path.numcolnull.sas" / source2 ; /* this calls template for number column is null *//*Second RuleXXXXXXX002 (e.g. Check NULL/Blank Value for character column) *//******** XXXXXXXXX002 ***********/%let metric id XXXXXXXXX002 ;%let col character column name ;%include "&path.charcolnull.sas" / source2 ; /* this calls template for character column is null *//*Third RuleXXXXXXX003 (e.g. Check character column to ensure it is on reference list ) */%let metric id XXXXXXX003 ;%let col character column ;%let fmttest character format name . ; /* this format would have been previously created from reference files */%include "&path.charformat.sas" /source2 ; /* this calls the template to check that a character column is foundwithin a format */. Add as many rules here as are defined in the standards spreadsheet .run ;/* this SQL summarizes the file above into one record per metric (rule) */proc sql ;create table work.&inputname. metrics as/* this table may or may not be permanent */select metric id ,sum(rowfailed) as rows failed format comma15.0 ,max(rows processed) as rows processed format comma15.0 ,sum(rowfailed) / max(rows processed) as percent failed format 6.4from work.metricsgroup by metric id;quit ;%include "&pathscore.scorereport.sas" /source2 ; /* this calls the score report */%stpend ;SCORE REPORT CODE%let metricfile sasin.&inputname. metrics;proc sort data work.&inputname. metrics;by Metric ID ;run ;11
proc sort data sasin.&standardout work.&standard;by Metric ID ;where metric id NE "" ;run ;data work.&inputname. scored ;merge work.&inputname. metrics (in m)work.&standard. (in s);by Metric ID ;length Score 8 ;if m ;/* this creates the hyperlink to the stored process for detail analysisit is set up to pass two macro variables as parameters ParamA and odsstylebut others can be added*/machine "http://111.222.333.444:8080/" ;engine "SASStoredProcess/do?" ;progpath " program SBIP://METASERVER%2F folder %2F folder %2F folder %2F" ;program " detail report name " ;paramA "colname " ;odsstyle "& odsstyle." ;;/* this creates the hyp
The approach in this paper shows users how to develop a data quality scorecard based on rules, and judged against a set of standards set by the user. Each rule (a/k/a metric) has a standard that determines whether it passes, fails, or needs review (a green, red, or blue score). A rule can