Transcription
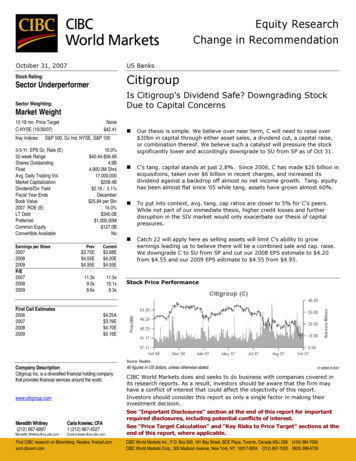
Equity ResearchChange in RecommendationOctober 31, 2007US BanksStock Rating:CitigroupSector UnderperformerIs Citigroup's Dividend Safe? Downgrading StockDue to Capital ConcernsSector Weighting:Market Weight12-18 mo. Price TargetC-NYSE (10/30/07)Key Indices:None 42.41S&P 500, DJ Ind, NYSE, S&P 1003-5-Yr. EPS Gr. Rate (E)52-week RangeShares OutstandingFloatAvg. Daily Trading Vol.Market CapitalizationDividend/Div YieldFiscal Year EndsBook Value2007 ROE (E)LT DebtPreferredCommon EquityConvertible AvailableEarnings per Share200720082009P/E20072008200910.0% 40.44- 56.664.9B4,900.0M Shrs17,000,000 208.4B 2.16 / 5.1%December 25.84 per Shr14.0% 340.0B 1,000.00M 127.0BNoPrevCurrent11.3x9.3x8.6x11.5x10.1x9.3x 3.75E 4.55E 4.95EFirst Call Estimates2006200720082009 3.68E 4.20E 4.55EOur thesis is simple. We believe over near term, C will need to raise over 30bn in capital through either asset sales, a dividend cut, a capital raise,or combination thereof. We believe such a catalyst will pressure the stocksignificantly lower and accordingly downgrade to SU from SP as of Oct 31.C's tang. capital stands at just 2.8%. Since 2006, C has made 26 billion inacquisitions, taken over 6 billion in recent charges, and increased itsdividend against a backdrop off almost no net income growth. Tang. equityhas been almost flat since '05 while tang. assets have grown almost 60%.To put into context, avg. tang. cap ratios are closer to 5% for C's peers.While not part of our immediate thesis, higher credit losses and furtherdisruption in the SIV market would only exacerbate our thesis of capitalpressures.Catch 22 will apply here as selling assets will limit C's ability to growearnings leading us to believe there will be a combined sale and cap. raise.We downgrade C to SU from SP and cut our 2008 EPS estimate to 4.20from 4.55 and our 2009 EPS estimate to 4.55 from 4.95.Stock Price Performance 4.25A 3.76E 4.70E 5.16ESource: ReutersCompany DescriptionCitigroup Inc. is a diversified financial holding companythat provides financial services around the world.www.citigroup.comMeredith Whitney(212) 667-6897Carla Krawiec, CFA1 (212) us.cibc.comFind CIBC research on Bloomberg, Reuters, firstcall.comand cibcwm.comAll figures in US dollars, unless otherwise stated.07-83995 2007CIBC World Markets does and seeks to do business with companies covered inits research reports. As a result, investors should be aware that the firm mayhave a conflict of interest that could affect the objectivity of this report.Investors should consider this report as only a single factor in making theirinvestment decision.See "Important Disclosures" section at the end of this report for importantrequired disclosures, including potential conflicts of interest.See "Price Target Calculation" and "Key Risks to Price Target" sections at theend of this report, where applicable.CIBC World Markets Inc., P.O. Box 500, 161 Bay Street, BCE Place, Toronto, Canada M5J 2S8 (416) 594-7000CIBC World Markets Corp., 300 Madison Avenue, New York, NY 10017-6204 (212) 667-7000 (800) 999-6726
Is Citigroup's Dividend Safe? Downgrading Stock Due to Capital Concerns - October 31, 2007Investment ThesisWe are downgrading our rating on Citigroup from Sector Performer to SectorUnderperformer as of October 31. Our thesis is simple. We believe C will needto raise over 30 billion in capital as a results of its tangible capital ratios fallingto the lowest levels in decades, now standing at almost half their peer groupaverage at just 2.8%. Based upon our thesis that over the near term C will beforced to sell assets, raise capital or cut its dividend to shore up its capitalratios, we believe the stock will be under significant pressure and could tradeinto the low 30s. We note that at the height of JPM’s recent troubles in 2002,the stock traded at 2.5x tangible book. Today, C trades at 3.7x its tangible bookvalue of 12.77.Third Quarter Puts C’s Tangible Capital Ratio At LowestLevels in DecadesSince the third quarter of 2005, Citigroup’s tangible equity to tangible assetsratio (TE/TA) ratio has declined, but beginning at the third quarter of 2006, suchratio began declining by double digit rates in each subsequent quarter.Remember, the Federal Reserve lifted the ban in March 2006 that preventedCitigroup from acquisitions until it felt satisfied with C’s compliance and riskmanagement. Once it lifted such a ban, Citigroup made up for lost time andacquired over 25 billion in acquisitions in under two years growing its tangibleasset base by almost 60% while the company’s tangible equity base has hadliterally zero growth.Exhibit 1. Citigroup’s Tangible Equity to Tangible Assets Ratio Fell to 2.80% in 3Q07, a Multi-Year LowCitigroup billionsTE/TA Ratio1Q034.8%QoQ %2Q033Q034Q03Tier 1 %4%-1%-5%-11%-12%-19%-28%-31%7.4%YoY %QoQ 2%-2%-5%-2%-4%-7%-14%YoY %Source: Company reports and CIBC World Markets CorpThe Road Here? In 2006, after The Fed lifted its ban on C from makingacquisitions, C made up for lost time and was one of the most aggressiveacquirers over the past two years. While no one acquisition seemed particularlylarge at the time relative to C’s overall size and asset base, in aggregate thetotal value of these deals has been close to 26 billion. Just this year, C’sacquisitions have totaled 18 billion. Nikko alone was over 12 billion in total.The material challenge with this spending spree is that all the while C wassending out the door in the form of acquisitions, little incremental C’s earningsweren’t growing. During the time, C also raised its quarterly dividend by 10% to 0.54 per share from 0.49 per share, as announced in January 2007 or anadditional 1 billion roughly in payout.2
Is Citigroup's Dividend Safe? Downgrading Stock Due to Capital Concerns - October 31, 2007Exhibit 2. C Has Been One Of The Most Aggressive Acquirers Over Past 2Years, And Shopping Spree Drove Down Capital LevelsAcquisitions billionsNikko Cordial Corporation (39%)Nikko Cordial Corporation (56%)Nikko Cordial CorporationFederated Credit Card PortfolioFederated Credit Card PortfolioFederated Credit Card PortfolioFederated Credit Card PortfolioClosedDeal ValuePending4/26/2007 4.54 7.70 12.247/17/20065/1/200610/24/2006 2.45 1.34 3.57 ingPending2/28/2007 1.51 1.46 1.13 0.80 0.68 0.43 0.13NR 6.13Grupo CuscatlanBISYS Group Inc.Egg Banking PlcOld Lane PartnersAutomated Trading DeskBank of Overseas ChinaBanco de Chile (US business)Quilter & Co. LimitedAll OtherTotal Capital Committed Over Last 2 Years 25.73Source: SNL Financial and CIBC World Markets Corp.While C has been on a buying binge since 2006, its net income contribution hasbeen relatively flat for almost four years. Therefore C’s denominator of assetshas steadily increased at a faster pace than its equity build considering thevoracious pace of acquisitions.Exhibit 3. Citigroup’s Net Income Growth Have Been Relatively Flat Since 2004Citigroup MillionsNet IncomeQoQ %YoY 8-62%-55%Source: Company reports and CIBC World Markets Corp.Exhibit 4. Tangible Equity Declining by Single Digit Rate While Tangible Assets Growing by Double Digit RatesCitigroup billionsTangible EquityQoQ %YoY %Tier 1 CapitalQoQ %YoY %Tangible AssetsQoQ %19%23%28%37%35%Risk Wgtd ,168NRQoQ %4%8%9%16%19%19%21%NRYoY %YoY %Source: Company reports and CIBC World Markets Corp. We calculate Tangible Assets and Equity to exclude Goodwill and Intangibles disclosed in Citigroup’s quarterly financial supplement.3
Is Citigroup's Dividend Safe? Downgrading Stock Due to Capital Concerns - October 31, 2007Citigroup’s TE/TA ratio stands now at 2.8%. On a comparative basis, Citigrouphas lagged its peers in terms of tangible equity to tangible assets since 2006.WFC has consistently been one of the more over capitalized banks within largecaps since 2000. We calculate the peer average to be 4.70% in 2Q07 and3Q07, excluding Citigroup and WFC, who are both outliers. We believe that forC to re-establish an average tangible capital ratio of over 4.25%, C will need toraise over 30 billion in equity. To do that, C could cut its dividend, raisecapital, sell assets, or a combination thereof. In any of those scenarios, webelieve the earnings and returns will diminish significantly. We note that until2005/2006, Citi’s TE/TA Ratio tracked right along with its peer group average.Exhibit 5. Citigroup TE/TA Ratio Diverges With Peer Pack Beginning In2005/2006Tangible Equity / Tangible 32004200520062Q073Q07Source: SNL Financial and CIBC World Markets Corp. SNL calculates Tangible Assets and Equity by excluding goodwill, CDI and otherintangibles listed from 10-Qs. As some data is not available for 3Q07, we use 2Q07 data to determine 3Q07.But wait, C’s Tier 1 Ratio didn’t seem to dip that much, sowhy the concern?Exhibit 6. C Prefers To Look at Tier 1 Which Is Also Below Peer GroupTier 1 Ratio (%)2006Q1 2006Q2 2006Q3 2006Q4 2007Q1 2007Q2 .2C8.68.58.68.68.37.97.4WB7.97.87.77.47.47.57.2Avg ex C8.58.58.68.58.48.38.1Source: SNL Financial and CIBC World Markets Corp.4
Is Citigroup's Dividend Safe? Downgrading Stock Due to Capital Concerns - October 31, 2007Using a slide provided by C during its third quarter earnings, we show that byC’s calculations, C’s Tier 1 Capital has gone from 8.8% in 1Q05 to 7.4% as of3Q07. It shows that its leverage ratio has gone from 5.2% to 4.1% during thesame period.Exhibit 7. C’s Balance Sheets Metrics Trending Down Through 3Q07Source: Company reports and CIBC World Markets Corp. 3Q07 Earnings Presentation published 10/15/07.Management continues to target a 7.5% tier 1 capital ratio and a 6.5%TCE/RWMA. C’s tier 1 capital ratio fell to 7.4% in the third quarter, down from7.9% last quarter and 8.6% a year ago. The decline was mostly attributable toacquisitions (e.g., Nikko Cordial, Bisys Group, Automated Trading Desk, OldLane Partners, Quilter, etc.). Comparatively, C’s 7.4% tier 1 capital ratio in3Q07 was below the 8.1% average established by its large cap peers.Additionally, C’s TCE/RWMA ratio declined to 6.0% in 3Q07. Again, we note thatwe believe a tangible leverage ratio is more valuable here in our opinion as therehas simply been so much uncertainty over true asset values given the illiquidnature of even the previously highest rated assets.We prefer to use tangible leverage ratio as it takes the subjectivity of a bankregulator out of the equation vis a vis “risk weighting of assets” and simply putsleverage ratios on an apples to apples basis. We note here that until roughly2006, C’s tangible capital ratios tracked very closely with peer group averages.We add that given the pronounced period of securities pricing uncertainty, webelieve it is all the more important to use a simple, non-subjective analysis. Infact, the TE/TA, seen as a proxy to rating agencies, is used to easily and quicklymeasure the financial soundness of a bank. The higher the TE/TA ratio, thebetter equipped it is to fund current operations while meeting debt financialobligations. When considered against a target rate, this ratio measures theamount of excess free cash flow available to expand operations. Further, theTE/TA ratio assesses the book value of a company exclusive of intangible assets(e.g., goodwill) which could distort the true value if many acquisitions have beenundertaken.5
Is Citigroup's Dividend Safe? Downgrading Stock Due to Capital Concerns - October 31, 2007Exhibit 8. Tier 1 Ratio Closely Tracks Tang Eq/Tang Assets RatioA simple correlation analysis showsthat there is over a 0.90 positivecorrelation ( 1.0 being thestrongest) between Citigroup’sTE/TA ratio and Tier 1 Ratio. Assuch, Citigroup’s Tier 1 Ratioclosely tracks its TE/TA ratio.CitigroupTang Eq/Tang AstTier 1 Ratio12%9.5%10%9.0%8.9% 9.0%8.7%8.2% 8.4%8.7% 8.8% 8.7%9.1% 8.8%8.6% 8.5% 8.6% 8.6%8.3%8%6%5.1% 5.1%4.8%4.6% 4.7%4.0%4.1%4%4.6% 4.5%4.3% 4.4% 4Q033Q032Q031Q032%Source: Company reports, SNL Financial and CIBC World Markets Corp.A simple correlation analysis shows that there is over a 0.90 positive correlation( 1.0 being the strongest) between Citigroup’s TE/TA ratio and Tier 1 Ratio. Assuch, Citigroup’s Tier 1 Ratio closely tracks its TE/TA ratio.In The Third Quarter, Management Commented on Need ToRaise Capital RatiosCFO Gary Crittenden explained during Citigroup’s 3Q07 conference call that thelower Tier 1 capital ratio and tangible common equity to risk weighted managedassets ratio (TCE/RWMA) “reflect the impact of acquisitions and additional assetssuch as certain leveraged loans and commercial paper which came onto[Citigroup’s] balance sheet during [the third quarter]”.Management expects capital levels to return to its target levels in early 2008 by1) using stock to acquire the remaining shares of Nikko Cordial, 2) applying adiscipline approach in growing its balance sheet and allocating capital moreeffectively through the centralization of its treasury functions, and 3) earningsgrowth. As such, no share repurchases will be undertaken until capitalratios resume to management’s target levels.Road to Rebuild Capital RatiosWhile the average large cap bank is currently operating with a 4.70% TE/TAratio, Citigroup is trailing with its 2.80% ratio posted in 3Q07. We argue thatCitigroup should be at least at 4.25%, the low end of the peer group range.Citigroup has a number of options to restore its capital ratios. By generatingearnings and/or a dividend cut, Citigroup can increase equity which in turnsincreases capital ratios. Alternatively, Citigroup could sell assets which wouldalso ultimately increase capital ratios.Increase Equity through Earnings (Numerator Effect). Citigroup willrebuild capital through earnings each quarter. We estimate, on average,Citigroup to earn 5 billion each quarter. Assuming tangible assets remain6
Is Citigroup's Dividend Safe? Downgrading Stock Due to Capital Concerns - October 31, 2007unchanged from the third quarter (realistically we see little possibility of this butit makes it easier for this calculation to minimize all of the moving parts), wecalculate that Citigroup needs to increase tangible equity by 33 billion to obtaina 4.25% TE/TA. Further, we calculate that using earnings alone, it would takeCitigroup seven quarters or nearly two years to rebuild its capital to be close tothe large cap peer average. However, in reality, dividend pays 2.7 billion individends each quarter and will likely have asset growth especially if Citigroupprovides further funding to its 7 SIVs or it SIV assets are brought on balancesheet.Exhibit 9. Using Earnings Alone and No Asset Growth, it Would Take C 7 Quarters to Rebuild its TE/TA RatioCitigroup billionsTarget TE/TATangible AssetsTangible EquityTE Needed to Meet TargetQuarterly Earnings Estimate# Quarters to Rebuild Capital# Years to Rebuild Capital3Q07A2.80% 2,291 64TE/TATarget 13.50% 2,291 80 16TE/TATarget 24.00% 2,291 92 28TE/TATarget 34.25% 2,291 97 33TE/TATarget 44.50% 2,291 103 39TE/TATarget 55.00% 2,291 115 51 530.8 561.4 571.7 582.0 5102.5Source: Company reports and CIBC World Markets Corp.Increase Equity through Dividend Cut (Numerator Effect). Anotherpossibility would be for Citigroup to cut its dividend. Citigroup’s currentquarterly dividend is 0.54 per share. In 3Q07, dividends paid totaled 2.7billion. A 25% cut would reduce Citigroup’s quarterly dividend to 0.41 pershare or 2.0 billion. This reduction would translate into nearly 672 millioneach quarter or 3 billion each year in capital saved. Thus, in addition torebuilding capital through earnings, a lower dividend payment would help rebuildcapital ratios faster.Decrease Asset Base through Asset Sale (Denominator Effect). While inthe above scenario we hold assets constant, assets could continue to rise asmore leveraged loans and/or commercial paper are added to Citigroup’s balancesheet. Or the opposite, Citigroup could sell assets to lower its asset base whichwould in turn reduce the level of Citigroup’s required capital. We note that anasset sale would result in foregone earnings but this would be somewhat offsetby proceeds received from the asset sale. Further, the amount of capitalrequired would be lower since the asset base is now smaller from the sale. Thedecline in equity would be less than the decline in the asset base, thus, thecapital ratio would increase.We note that just a 5% reduction would translate into an asset sale of 115billion (based on 3Q07 tangible assets). Comparatively, Citigroup’s U.S. realestate loan portfolio is 185 billion while its U.S. managed credit card portfolio is 140 billion. Since the bulk of the U.S. credit card loans are off balance, a salewould not move the asset base by the entire portfolio size, but would increaseequity from the sale proceeds less the foregone earnings. Most recently,Citigroup sold its business technology finance unit to CIT Group in April 2007,which included 2 billion assets. Below we outline Citigroup’s loan portfolios.7
Is Citigroup's Dividend Safe? Downgrading Stock Due to Capital Concerns - October 31, 2007Exhibit 10. Citigroup’s Loan PortfoliosLoans Portfolios as of 3Q07Business LineReal EstateCredit Cards (Managed)Credit CardsCredit Cards (On Balance Sheet)Installment/OverdraftReal Estate SecuredMortgageStudent LendingCommercial Real EstateAutoPersonal LoansEquipment Finance/OtherPersonal LoansCommercialReal Estate SecuredAuto/OtherSales Finance/OtherAuto/Sales Finance/OtherU.S. Consumer LendingU.S. CardsIntl. CardsU.S. CardsIntl. Retail BankingU.S. Retail DistributionIntl. Retail BankingU.S. Consumer LendingU.S. CommercialU.S. Consumer LendingU.S. Retail DistributionU.S. CommercialIntl. Consumer FinanceIntl. Retail BankingIntl. Consumer FinanceIntl. Retail BankingU.S. Retail DistributionIntl. Consumer Finance Billions1851404236342928211919191916119861Source: Company reports and CIBC World Markets Corp.Naturally, any combination of events is feasible. Perhaps Citigroup sells apercentage of its assets. The payment received for the assets would boostcapital while the reduction in assets would lower the level of capital required.Further, earnings would be lower as its earnings asset base shrunk. Along withan asset sale, Citigroup could also cut its dividend which, would along withearnings, would increase its capital base.SIVs Could Lower Capital RatiosCitigroup is an advisor to 7 SIVs that hold 80 billion in assets. Thisrepresents 20% of what had been 400 billion SIV market and now stands at 320 billion. Citigroup does not own any equity positions or have contractualobligations to provide liquidity facilities or guarantees to these SIVs. However,as an advisor, Citigroup coordinates the funding of the SIVs and has on occasionprovided funding itself. The 7 SIVs advised by Citigroup are 98% fundedthrough year end.While Citigroup has stated that it will not consolidate the assets of these 7 SIVs,it will continue to provide liquidity. As such, Citigroup’s assets would increase asit extends short term funding to SIVs. With a bigger asset base, ordenominator, Citigroup’s capital ratios would decline. While not specificallydisclosed, we know that part of the 6% sequential increase in Citigroup’s 3Q07total assets was from the addition of commercial paper issued to SIVs.A SIV is an investment company that earns income through spread lending (i.e.,earnings profits from the difference between borrowing short term and investinglong term). Generally, a SIV earns income from the purchase long term highyielding securities (e.g., mortgage backed securities or credit card receivables)and turning them into marketable securities purchased by investors. Theseinvestments are typically funded through the sale of short term lower yieldingsenior debt (e.g., asset backed commercial paper).Given the recent dislocation in financial markets, the cost of commercial paperincreased substantially as LIBOR (proxy rate for commercial paper) rose to8
Is Citigroup's Dividend Safe? Downgrading Stock Due to Capital Concerns - October 31, 2007abnormally high levels. As such, the usually very liquid commercial paper marketbecame illiquid, causing funding concerns for SIVs. With the funding of certainSIVs uncertain, the assets held by these SIVs may be sold at fire sale prices.If any of the outstanding SIVs come back on C’s balance sheet, it is clear thatcapital ratios will be pressured still further. Compared to just a year ago, Citi’stotal asset base is 35% higher. Specifically other assets grew 80% during thethird quarter on a year on year basis primarily from the disruption in theleveraged loan market which forced C to take more assets on balance sheet.Trading account assets (e.g. FX, commodities, repos, etc.) were also up almost70% than prior year levels due to similar market disruption. We believe themajority of the 80 billion has yet to come onto C’s balance sheet.Exhibit 11. Other Assets Up 80% YoY From Leveraged Loans( millions)Cash & Due From BanksDeposits with BanksFed Funds Sold/SecuritiesBrokerage ReceivablesTrading Account AssetsInvestmentsTotal Net LoansGoodwillIntangible AssetsOther AssetsTotal Assets3Q06A2Q07A3Q07AQoQ %YoY %70%73%46%69%66%-4%18%20%50%80%35%Source: Company reports and CIBC World Markets Corp.History to Repeat Itself?Back on December 18, 1990, Citicorp (Citigroup before the merger withTravelers Group) cut its 0.445 per share dividend by 44% to 0.25 per share.The dividend cut was taken in efforts to strengthen the bank’s financial conditiongiven the tough operating environment and mounting loan losses.Citigroup’s current quarterly dividend is 0.54 per share. In 3Q07, dividendspaid totaled 2.7 billion. A 25% cut would reduce Citigroup’s quarterly dividendto 0.41 per share or 2.0 billion. This reduction would translate into nearly 3billion in capital saved over the next year. Similarly, a 50% dividend cut wouldequal over 5 billion capital saved over the next year.Exhibit 12. A 25% Dividend Cut Would Save Nearly 3 Billion in CapitalOver the Next YearCitigroup millions3Q07A25%Div Cut50%Div Cut75%Div Cut100%Div ,981Dividends Paid2,6902,0171,3456720Dividend Per ShareCapital Saved - Quarterly6721,3452,0172,690Capital Saved - Yearly2,6905,3798,06910,759Source: Company reports and CIBC World Markets Corp.9
Is Citigroup's Dividend Safe? Downgrading Stock Due to Capital Concerns - October 31, 2007Citigroup’s net income has remained relatively flat since 2004. Meanwhile wesee Citigroup’s payout ratio trending up from 39% in 2004 to 46% in 2006.Based on year to date earnings and Citigroup’s current dividend, we estimatethat its payout ratio will increase to 59% for full year 2007. We argue that thispayout ratio is not sustainable while net income continues to be stagnant.Exhibit 13. Citigroup’s Net Income Growth Have Been Relatively Flat Since 2004Net Income MillionsCitigroupQoQ %YoY 8-62%-55%Source: Company reports and CIBC World Markets Corp.Exhibit 14. Payout Ratio Trending Up as Net Income Remains Relatively Flat; Not Sustainable, In Our OpinionCitigroupCitigroupNet Income MillionsPayout 00040%1,00020%Net Income MillionsPayout ce: Company reports and CIBC World Markets Corp.Agency Credit RatingsCredit rating agencies such as S&P, Moody’s and Fitch all assess thecreditworthiness a company’s debt. Throughout 2007, Citigroup has received anAA rating from S&P, up from AA- in 2006. As such, S&P’s rating means thatCitigroup has a very strong capacity to meet its financial commitments. Thisrating is just below the coveted AAA rating.Exhibit 15. S&P AA Rating: Strong Capacity to Meet its FinancialCommitmentsCitigroupCredit RatingsS&P LT Issuer Credit RatingMoody's LT Issuer RatingFitch Inc. LT Credit Rating2Q06A3Q06A4Q06A1Q07A2Q07A3Q07AAAAa1AA AAAa1AA AAAa1AA AAAa1AA AAAa1AA AAAa1AA Source: SNL Financial and CIBC World Markets Corp.10
Is Citigroup's Dividend Safe? Downgrading Stock Due to Capital Concerns - October 31, 2007Exhibit 16. Credit Ratings of Large Cap Banks as of 3Q07LT Issuer Ratings3Q07Wells Fargo & CompanyCitigroup Inc.Bank of America CorporationU.S. BancorpJPMorgan Chase & Co.Wachovia CorporationS&PMoody'sFitchAA AAAAAAAAAA-Aa1Aa1Aa1Aa2Aa2Aa3AAAA AAAAAAAA-Source: SNL Financial and CIBC World Markets Corp.Credit QualityMortgage delinquencies accelerated in September causing C’s 2.6 billion GlobalConsumer credit costs/reserve build estimate given in early October to be toolow by 250 million. Specifically, first mortgages posted a 2.09% 90 days pastdue rate, up from 1.29% in 2006, but still below peak rates near 3% in 2003.Further, second mortgage 90 day past due rates rose more dramatically to1.10%, almost doubling from earlier this year. C’s International Cards businesscontinues to expand aggressively in Mexico and Latin America thus resulting inhigher loan losses given their market demographics. Further, the impact ofJapan’s Gray Zone has cause C to materially increase its loan loss reserves forits International Consumer Finance business.CDO related losses were 1.56 billion in 3Q07 versus Citigroup’s pre-announced 1.3 billion loss. As such, loan loss provisions in securities and banking arethree times higher than a year ago. C’s subprime asset exposure was 13billion in 2Q07, down from 24 billion in January. These assets were reducedslightly further in 3Q07.Exhibit 17. Loan Losses Provisions Increase by Threefold in 3Q07Provision for Loan Losses million3Q06A3Q07AYoY %% TotalUS Consumer Lending1851,2716.9x27%INTL Cards4069282.3x19%INTL Consumer Finance5247331.4x15%US Retail Banking2536872.7x14%US Cards11%3345331.6xINTL Retail Banking483938.2x8%Private 232.7x97%Securities & Banking501513.0x3%Transaction Services740.6x0%Other Markets & Banking00NM0%Alternative 934,7762.7x100%US Commercial BusinessSmith BarneyOther ConsumerTotal Consumer ProvisionTotal Corporate ProvisionConsolidatedSource: Company reports and CIBC World Markets Corp. % of total based on 3Q07 figures.11
Is Citigroup's Dividend Safe? Downgrading Stock Due to Capital Concerns - October 31, 2007Citigroup’s consumer loan delinquencies (90 days past due) increased to1.51% of consumer loans in 3Q07, 14% higher than a year ago. Specifically,the bulk of increase in centered in U.S. Consumer Lending with the recenthousing and mortgage market troubles. Delinquencies in U.S. Cards and U.S.Retail Distribution both rose by double digits on a sequential basisExhibit 18. Delinquencies Up Over 50% In Consumer LendingConsumer Loan Delinquencies90 Days Past DueU.S CardsU.S. Retail DistributionU.S. Consumer LendingU.S. Commercial Business3Q06A2Q07A3Q07AQoQ %YoY %1.93%0.43%18%12%22%16%-1%6%53%-20%International CardsInternational Consumer FinanceInternational Retail 9%-4%-5%7%-14%-3%-14%Global Wealth Management0.02%0.01%0.06%500%200%On Balance %14%Source: Company reports and CIBC World Markets Corp.Looking at Citigroup’s delinquencies by country, the biggest increases are in theU.S. as well as Latin America. Japan’s delinquency rate also rose moderately onan annual basis as well as on a sequential basis while Mexico experienced aslight increase on a sequential basis.Exhibit 19. Higher Delinquencies Most Prevalent in U.S. and LatinAmericaConsumer Loan Delinquencies90 Days Past DueU.S.MexicoEMEAJapanAsia (ex Japan)Latin America3Q06A2Q07A3Q07AQoQ %YoY 6%2%-6%32%-16%-19%8%-15%25%On Balance %14%Source: Company reports and CIBC World Markets Corp.Estimates and ValuationWe lower our 2008 and 2009 EPS estimates by roughly 8% and lower our 4Q07EPS estimate by 7%. Our lower estimates are based on decelerating revenuemargin
Find CIBC research on Bloomberg, Reuters, firstcall.com CIBC World Markets Inc., P.O. Box 500, 161 Bay S