Transcription
Developing aCybersecurityScorecardU.S. Department of AgricultureFarm Service Agency
Foundation People & Organizations Contribute to Outcomes Good Management Through Measurement Confidence Through Transparency Requires Evidence Performance Improves Through Recognition and Feedback All Levels Value Communication
NIST References NIST Special Publication 800-55 Revision 1: PerformanceMeasurement Guide for Information Security Elizabeth Chew, Marianne Swanson, Kevin Stine, Nadya Bartol,Anthony Brown, and Will /nistspecialpublication800-55r1.pdfITL Bullentin Security Metrics: Measurements to Support theContinued Development of Information Security Technology Shirley n2010 securitymetrics.pdf Especially pages 2-4 “Issues In Developing Security Metrics” NISTIR 7564: Directions in Security Metrics Research Wayne istir7564.pdf Especially Section 3 “Aspects of Security Measurement”
Why a Scorecard?
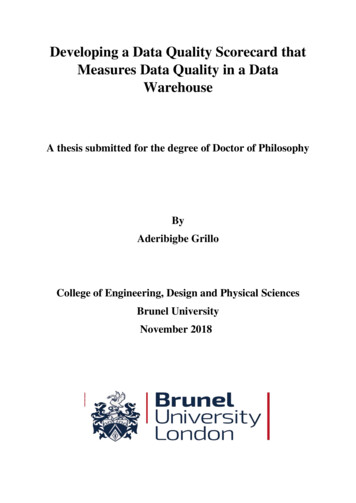
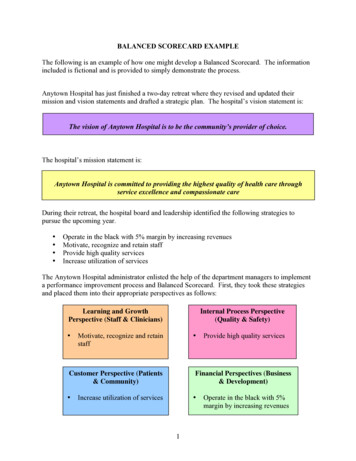
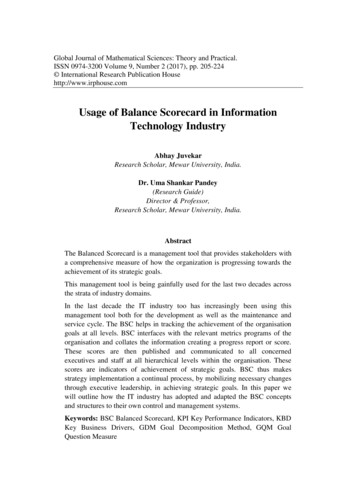
People & OrganizationsContribute to OutcomesInformationAccountability Results-based Management (RBM)uses feedback loops to achievestrategic ipedia.org/wiki/Results-based management
What wentwell? Do weneed to adapt?Get it done.How’s itgoing?ReviewDoHow are wegoing to doit? /en.wikipedia.org/wiki/Results-based managementWhat is thecurrentsituation?ThinkEnvisionWhatcausedit?What are wegoing toachieve?
Developing a Scorecard
Developing a Scorecard Define Success: What is the objective? What does success ( “good”) look like? To the taxpayer, your customer, the Administration, yourexecutive(s), you? We are conditioned to respond to information presented incertain ways https://en.wikipedia.org/wiki/Balanced scorecard
Developing a Scorecard Select targets and measuresto track (progress)achievement of objectives Management team is fullyinvolved Management team is theprimary customer of thescorecard Select leading indicators andlagging indicatorshttps://en.wikipedia.org/wiki/Balanced scorecard
Developing a Scorecard Data needs context Data without context ismeaningless. So what if therewere 5734 events? Is that good,bad, normal? Easiest way we’ve found is apercentage (ratio). We also use some year-overyear comparisons to showtrends.Data with context becomesactionable information Dispels F.U.D. (fear,uncertainty and doubt) Enables management to takeaction.https://en.wikipedia.org/wiki/Balanced scorecardDon’t reinvent thewheel. It’s OK touse existing KPIsbeing collected byanother source.Doing this mayhelp demonstratecascading goals.
Developing a Scorecard Start small, start with one Key Performance Indicator (KPI) Try thinking about it this way: It is important to me (and my management team) that ourcustomers are happy. My customers are happy when the right people receive the rightaccess. “My customers” are end users, supervisors, system owners,auditors, others. When we deliver 100% on this metric, I am reasonably assured mycustomers are happy with our access provisioning service. (Ishould get no flaming emails or material weaknesses.)
Let’s Take A Closer Look
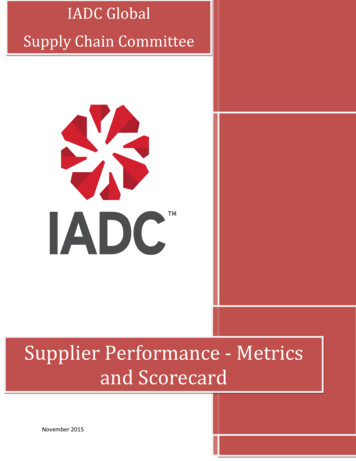
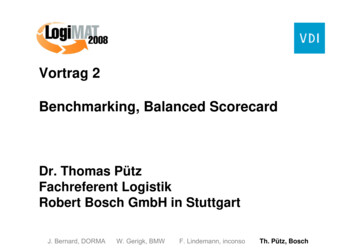
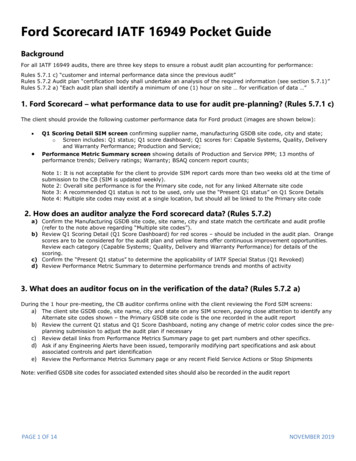
DomainHygieneMetricATOsOngoing A&A percentageUSDA Key ControlsNIST ControlsFY17 IT Audit Artifact Delivery TimelinessFY17 IT Audit Artifact ComplianceStandard User PIV Authentication ComplianceKPI# compliant systems / # of systemsFrom Department's Scorecard# compliant controls / # of controls# compliant controls / # of controls# delivered timely/ # currently due# of compliant artifacts provided /# of artifacts providedFrom Department's Scorecard# internally provisioned requests completed / # internally provisioned requestsreceived# of separation requests completed/# of separations requests received# externally dependent provisioned requests completed / # externally dependentprovisioned requests received# requests completed accurately / # requests sampled# complete / total ## complete / total ## complete / total ## complete / total ## complete / total ## complete / total ## complete / total ## complete / total ## complete / total ## complete / total #From Department's Scorecard# complete / total #From Department's ScorecardAccess Request TimelinessSeparation Request TimelinessService Provider (or other Non-[IT Director E]) RequestTimelinessAccess Request Completion Accuracy[SES Org A][SES Org B][SES Org E.1][SES Org E.2][SES Org F][SES Org I]Awareness[SES Org J]Externals (Contractors, Volunteers, Affiliates & Interns)Total Users Basic ISAT (minus committee members)Committee Members Alternate ISAT (Protecting PII)Total ISAT and PII (per USDA)FY17 Specialized Role-Based TrainingVulnerabilities/Endpoint[IT Operations A] Vulnerability Remediation Tickets onSchedule# of on schedule [IT Operations A] tickets/# of open [IT Operations A] tickets[IT Operations A] Vulnerability Remediation Tickets Remed# of [IT Operations A] tickets closed/# of [IT Operations A] ticketsVulnerabilities[IT Operations B] Vulnerability Remediation Tickets onSchedule# of on schedule [IT Operations B] tickets/# of open [IT Operations B] tickets[IT Operations B] Vulnerability Remediation TicketsRemediated# of [IT Operations B] tickets closed/# of IPSUO ticketsTrend of # of incidents / # of incidents expected per ratio of FSA to USDATrend of FSA incidents to USDA incidents this FYemployeesCompar[IT Director E]n of FSA Incidents this FY to last FY Incidents so far this FY / Incidents so far this time last FYCyber IncidentsTrend of # of PII incidents / # of incidents expected per ratio of FSA to USDAemployeesTrend of FSA PII incidents to USDA PII incidents this FYCompar[IT Director E]n of FSA PII Incidents this FY to lastFYPII Incidents so far this FY / Incidents so far this time last FYAll OCIO Plan of Actions and Milestones (POA&Ms)# of On Schedule POA&Ms / total # of POA&Ms[IT Director A] Plan Of Actions & Milestones (POA&Ms)# of On Schedule [IT Director A] POA&Ms / total # of [IT Director A] POA&Ms[IT Director C] Plan Of Actions & Milestones (POA&Ms)# of On Schedule [IT Director C] POA&Ms / total # of [IT Director C] POA&MsExceptions [IT Director E] Plan Of Actions & Milestones (POA&Ms)# of On Schedule [IT Director E] POA&Ms / total # of [IT Director E] POA&Ms[IT Director F] Plan Of Actions & Milestones (POA&Ms)# of On Schedule [IT Director F] POA&Ms / total # of [IT Director F] POA&MsMilestones# of On Schedule milestones/ total # of milestonesRisk Based Decision (RBD)# of unexpired / total # approvedAccess6/9/2017 6/2/2017 5/26/2017 5/19/2017 5/12/2017 5/5/2017 4/28/2017 4/21/2017 4/14/2017 4/7/2017 3/31/2017 .0%100.0%97.8%95.4%100%Notes
Not All KPIs Show Variations Access Request Timeliness Our access request team processes 500 system accessrequests a week. Weekly variance of /-5% is notconcerning.Some metrics run at 100% week after week. These are scrutinized to make sure we are measuring theright things. The ones that remain we’ve determined have value becausewe want to know if even small variations from 100% occur.
Benefits
Good Management Through Measurement Lagging KPIs help identify problems that contribute to risk Improving the lagging KPIs indirectly reduces riskLeading KPIs help serve as an early warning on potential risks Improving the leading KPIs helps resolve unrealized risks Information provides evidence of results Returning to the RBM model
Transparency Accountability Confidence Showing good, bad, ugly Transparency Produces evidence through information Gives confidence that programs are being managed
Recognition Feedback Improvement Document Quality Assurance Surveillance Plan (QASP) resultsfor contracts Document team performance results Document service provider performance results
Future
Future of the Scorecard Pivot to Cybersecurity Framework (identify, protect,detect, respond, recover) Transition domains to align with CSF functions Identify KPIs that support OMB cyber memo objectivesContinue to look for KPIs that are indicators of risk Security Impacts of Change Requests Vulnerability ImpactsContinue to look for leading indicators of performanceExpand information received from service providers
Thank You
About MeJeff Wagner, CISSPChief Information Security OfficerInformation Security Office DirectorBeacon Facility Mail Stop 2040P. O. Box 419205Kansas City, MO /
About FSAThe Farm Service Agency (www.fsa.usda.gov) deliveredover 6B in direct and guaranteed farm loans and nearly 9B in farm program payments in 2016. FSA helps toensure the security of commodities distributedworldwide. FSA delivers its mission through a network ofover 2,100 field offices supported by headquarters andregional offices throughout the United States.
Measurement Guide for Information Security Elizabeth Chew, Marianne Swanson, Kevin Stine , Nadya Bartol, Anthony Brown, and Will Robinson cialpublicatio n800-55r1.pdf ITL Bullentin Security Metrics: Measurements to Support the Continued Development of Information Security Technology File Size: 583KBPage Count: 23