Transcription
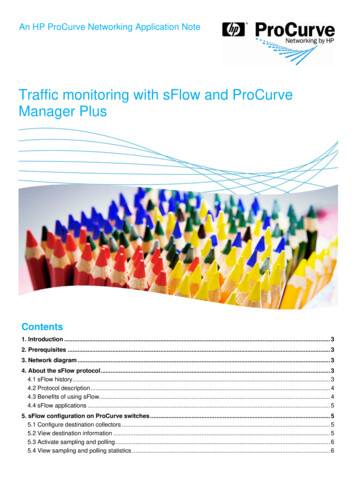
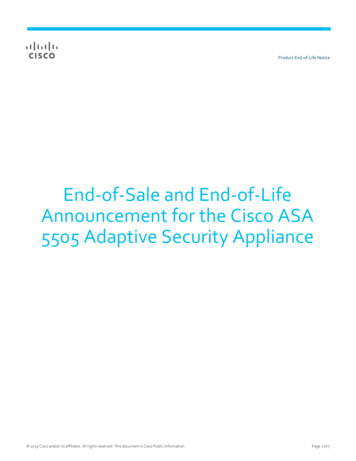
White PaperLeveraging EOS and sFlow for AdvancedNetwork VisibilityAs data center architectures consolidate to common infrastructure, shared services and cloud-like two-tier networks,system and network utilization and total capacity continue to increase at a pace that exceeds the current generation ofmonitoring tools and applications.Historically it was feasible to leverage a few dedicated hardware platforms at strategic network choke points to provideapplication level flow visibility. Changing application behaviors, a high degree of infrastructure sharing and widelydeployed multi-path networks mean the existing tools cannot meet the goals of providing visibility, or scale and costexpectations of next-generation environments.Full packet capture is possible through integrated or overlaid telemetry networks, for example leveraging Arista’s DataAnalysis toolset, however there is often simply too much data to process effectively in real-time creating a data miningand storage challenge.Overcoming these challenges requires a two tier approach to monitoring - first using a coarse view of network wideactivity to identify first-order anomalous behavior, followed by focusing down on particular hotspots or flows fordetailed capture and analysis.arista.com
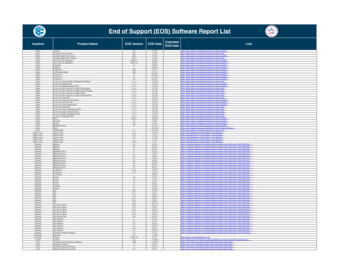
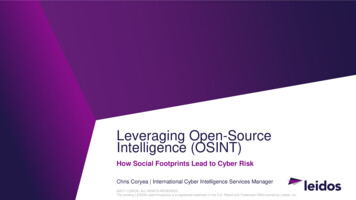
White PaperFigure 1: Combining coarse and fine-grainedanalysis for maximum visbilityFlow AnalysisFlow analysis is not a new concept, with many high-end routers and Ethernet switches offering this capability. However, dramaticincreases in total system capacity (10-40Tbps) and interface speed migration from 1GbE all the way to 100GbE means that thenetwork throughput has grown dramatically faster than the overall capacity of the general purpose CPU embedded into themanagement plane of the network devices. As a consequence considerable thought needs to be given to scaling any kind of realtime or sampled flow monitoring.Traditional flow-visibility has been very device centric, with each network device leveraging dedicated processing and memoryresources to track IP flows traversing the device. Each device’s local flow table is processed locally before being sent to a centralcollector for aggregation and analysis.This solution worked effectively when traffic patterns were primarily North-South and where the interface count (and overallthroughput) was relatively low, however it became disproportionately computationally expensive as port density and interface ratesscaled ahead of CPU performance leading to a narrowing of support in most networking portfolios to a very small fraction of thetotal system capacity.The ability to solely monitor traffic at choke points in a north-bound direction is at odds with the trend in application flow andoverall scaling where East-West traffic patterns and very large numbers of flows make it desirable to monitor accurately at morenetwork touch points rather than fewer.One solution that has been proposed by some technology companies is to offload flow table generation to dedicated externaldevices that collect a subset of traffic through network taps or from mirror ports. However, this approach may even compound theloss of visibility and increase costs for a number of reasons: Consolidation of flow monitoring, that would have been performed in parallel across multiple devices, into a singlecentral device means that the central device must scale better than the pool of processers it replaces Discrete modular devices will have upper scaling limits in terms of density and throughput, which caps the overall abilityto monitor an infrastructure to the number of physical interfaces or aggregate performance. The only path to expand thesesystems is through upgrading and/or replacing hardware. The technologies are highly likely to be proprietary in architecture and as a result costly to purchase, license and support,which are further limits to scaling.At Arista, we believe that open distributed architectures are the key to delivering economically viable, scalable infrastructures and toprovide wide-ranging network visibility. The same paradigm applies to monitoring.arista.com
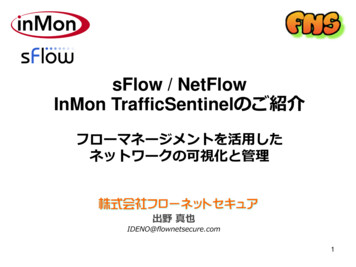
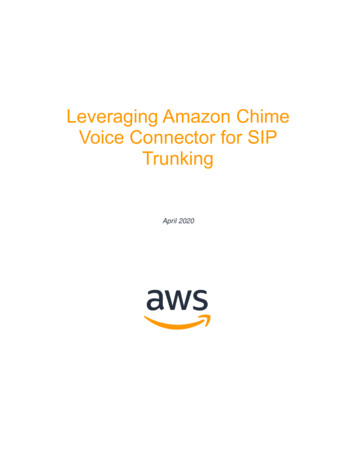
White PaperFigure 2: Parallel monitoring out-scales centralized devicesAt Arista we have adopted and embedded sFlow (RFC 3176) into all of our products whether they are at the Leaf, Spine, Spline orTelemetry layers of the network, delivering a complete, consistent and distributed stream of flow information unilaterally across thenetwork infrastructure.sFlow (RFC 3176) In BriefsFlow is a widely adopted, open standard designed specifically to address the scaling challenges discussed earlier. As a universallyembedded technology, it avoids the visibility cliff between device classes often associated with flow monitoring technologies. Mostimportantly, the ability to monitor your network scales linearly with every new device installed.The following attributes make sFlow ideal for modern network designs: Computationally cost effective – sFlow can be widely implemented in hardware in products designed to sit at all costand scale points in the network meaning no visibility gap between network spine/core and leaf/edge. Performance scales with interface speeds – sFlow supports 10Gb, 40Gb and 100Gb Ethernet and beyond. Integrated hardware based statistical sampling – packets do not need to be processed in real time so the data load ondevices and monitoring tools is reduced and data integrity is maintained, resulting in accurate and unbiased telemetry. Naturally distributed – every time a new device is added to the network topology, it adds sFlow processing scale. Thereis no central bottleneck and both horizontal and vertical visibility is available by default. Collector applications are hardware independent – sFlow analysis tools run on standard servers with open operatingsystems. Real-time, raw export – sFlow does not require pre-correlation or processing on each device and does not summarizeflow data. The collector gets a complete view of traffic profiles, including payload data. Lack of local correlation – local device CPU performance does not affect the ability of the device to provide accurateflow data.sFlow is Tremendously Versatile in UsagesFlow data is routinely used for multiple parallel applications including: Application performance management Troubleshooting Capacity planningarista.com
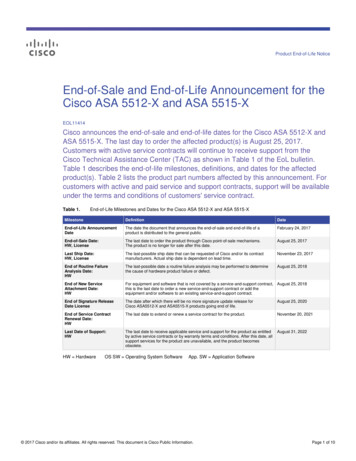
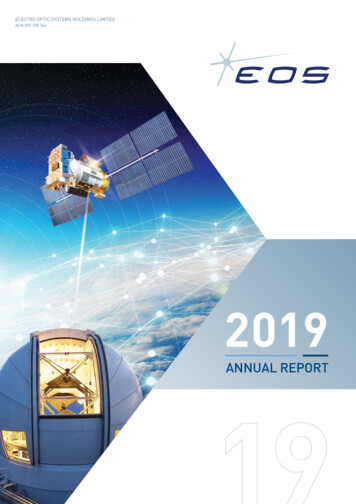
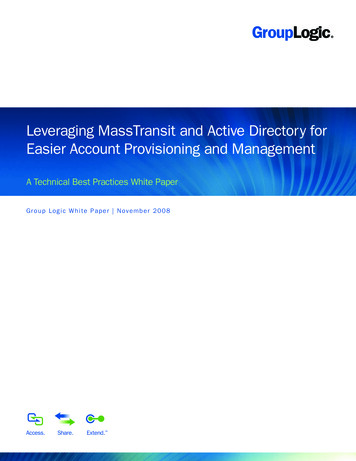
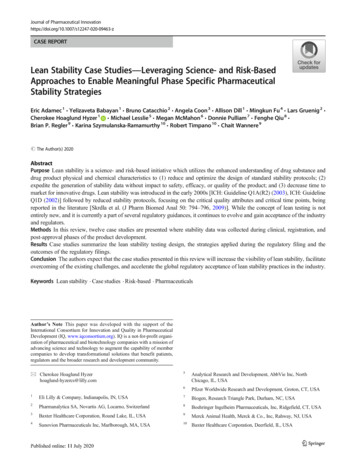
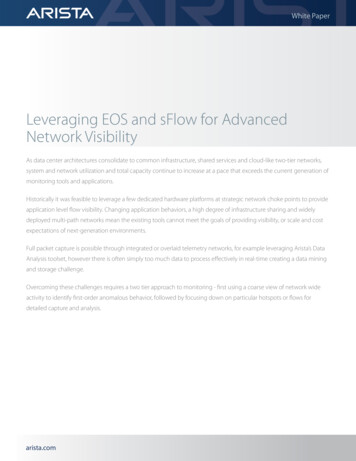
White Paper Congestion managementAccounting, billing and charge-backAnomaly and attach detection and auditPath profilingsFlow in Telemetry OverlaysWith support of sFlow in all Arista products, flow information can be generated in a distributed fashion across the entiredata center. However, most network infrastructures contain at least a few legacy devices or transit links that would benefitfrom additional monitoring.The deployment of a DANZ equipped tap aggregator (packet broker) enables the generation of sFlow datagrams fromsources such as network taps or traffic derived from port mirrors.Figure 3: Generating sFlow from the TAP Aggregation layerThe advantages of a consistent monitoring paradigm across all devices to allow a unified toolset is clear, however a secondarybenefit also exists. As many devices implement traditional flow monitoring in the CPU or in data plane hardware unloading thisprocessing requirement may also unlock network performance and scale improvements.Thanks to the lightweight, scale optimized nature of sFlow generation this solution provides for up to 1152 ports of 10GbE, 288 portsof 40GbE or 96 ports of 100GbE in the Arista 7500E Series modular platform guaranteeing coverage for a wide range of use cases,including high bandwidth links and wide area links.Leveraging the Power of EOS and sFlow to Overcome Information OverloadSo far we’ve seen how selection of an appropriate lightweight technology can provide a high degree of visibility across theinfrastructure without unduly loading devices or analysis tools. This provides only part of the story.To close the loop between anomalies detected through flow analysis and the requirement for full packet capture to perform deeperforensic investigation, collector applications require a channel to trigger captures from either infrastructure or telemetry hardware.With the universal JSON/RPC API native within Arista EOS any partner application can drive the creation and modification ofmonitoring and packet capture policy within the network and tap aggregation policies in the telemetry layer.Automating the process of detection through to capture allows creation of a system that quickly identifies, captures and alertsoperators to with minimal costs in infrastructure or tooling.arista.com
White PaperFigure 4: Automating detection and focused capture using open APIsAutonomy for Maximum ScaleFurther extending the automated and closed loop architecture Arista’s robust and open Linux/x86 architecture opens a host ofpossibilities for the application of local intelligence to behavioral analysis.Each Arista device offers the local processing of a small server, coupled with process and memory management of the standardLinux OS. Additionally EOS provides open access to data plane statistics and monitoring. Each device is able to parse criticaltelemetry data locally and make decisions on analysis and capture for the first time.Consider a simple case of local application monitoring sFlow data in real-time. Even without the context of wider network sampling,local trends can be an invaluable early warning to impending performance, capacity or security issues. For example, excessiveconnection rates, traffic types, interface congestion, high latency or packet loss can signal not only an event that may need to becaptured for analysis but may be important factors in decisions made by upstream orchestration tools about the placement of newworkloads and load balancing distribution.Figure 5: Localized automation enables intelligent response to anomaliesarista.com
White PaperThe straightforward pure Linux environment of EOS combined with a plethora of telemetry data derived from sFlow, LANZ and thedata plane opens a large number of possibilities for intelligent network control and capture that scales linearly as the infrastructureexpands.SummaryAddressing telemetry at data center scale and cloud economics requires an evaluation of the traditional centrally managed, big-ironapproach to monitoring. Linear scalability can only be achieved by distribution of intelligence and consistent visibility across theinfrastructure.The challenge is not to simply replace one means of data generation with another but to dramatically increase the scale and reducethe operational overheads where high degrees of automation are required.Arista’s portfolio addresses these requirements with a simple and open approach that enables operators to first increase visibilityand later to build automated workflows that improve response times and application intelligence. By removing the barrier betweentelemetry and in-path functionality, scalable solutions can be built at minimum cost.Santa Clara—Corporate Headquarters5453 Great America Parkway,Santa Clara, CA 95054Phone: 1-408-547-5500Fax: 1-408-538-8920Email: info@arista.comIreland—International Headquarters3130 Atlantic AvenueWestpark Business CampusShannon, Co. ClareIrelandIndia—R&D OfficeGlobal Tech Park, Tower A & B, 11th FloorMarathahalli Outer Ring RoadDevarabeesanahalli Village, Varthur HobliBangalore, India 560103Vancouver—R&D Office9200 Glenlyon Pkwy, Unit 300Burnaby, British ColumbiaCanada V5J 5J8Singapore—APAC Administrative Office9 Temasek Boulevard#29-01, Suntec Tower TwoSingapore 038989San Francisco—R&D and Sales Office1390 Market Street, Suite 800San Francisco, CA 94102Nashua—R&D Office10 Tara BoulevardNashua, NH 03062Copyright 2016 Arista Networks, Inc. All rights reserved. CloudVision, and EOS are registered trademarks and Arista Networksis a trademark of Arista Networks, Inc. All other company names are trademarks of their respective holders. Information in thisdocument is subject to change without notice. Certain features may not yet be available. Arista Networks, Inc. assumes noresponsibility for any errors that may appear in this document. 01/16arista.com
sFlow (RFC 3176) In Brief sFlow is a widely adopted, open standard designed specifically to address the scaling challenges discussed earlier. As a universally embedded technology, it avoids the visibility cliff between device classes