Transcription
LEVERAGING BUSINESS INTELLIGENCE:DATA, INFORMATION AND ANALYTICSSeptember 18, 2017: Carol Butler
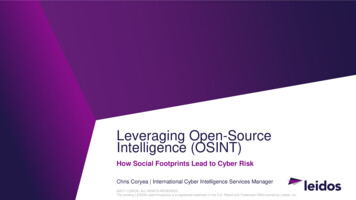
SEATTLE CITY LIGHTService Area131.31 sq. mi.Meters457,000Owned Generation (MW) 1,810.00Carbon Neutral since 2005Energy Efficiency Programs since 1970’s 2
LEVERAGING BUSINESS INTELLIGENCE Strategy and Framework Performance Reporting Data Analytics Data Visualization Data Marts/ Data Warehouse/ Data Lake Tools and Their Use 3
BUSINESS INTELLIGENCE STRATEGY &FRAMEWORK
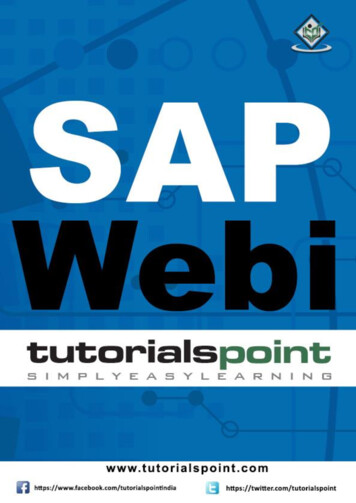
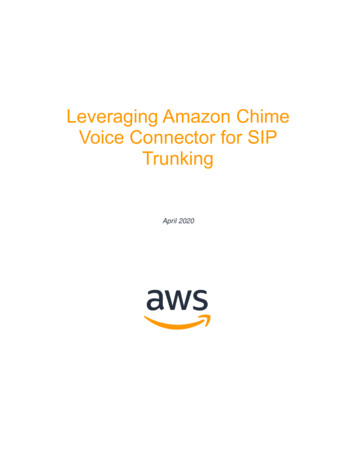
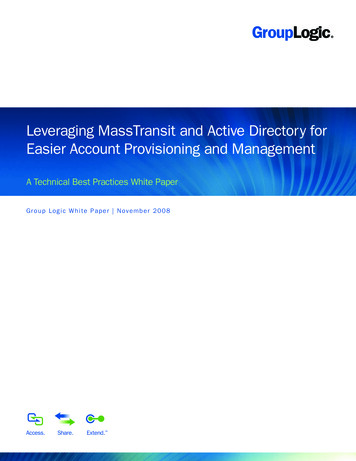
Foundat ionG OA LDataBI an d Metr ic s Rep o rtingSeattle City LightEnterprise &Business UnitLeadershipOperationsLeadershipSelect KPIs providing a crisp, holisticsummary of the current state of the enterpriseKPIs providing thorough reviewof the current state of thebusiness unitAnalysts/Power Comprehensive detaileddata supporting ad hocUsersanalysisFrontlineUsersDetailed BIReportingBusiness Intelligence StrategyEnterpriseScorecards& DashboardsBusiness UnitScorecards& DashboardsSummary Business UnitReporting & AnalyticsDetailed Reporting & AnalyticsData Warehouse &Data MartsDaily & historical data fromoperational systems transformedinto standardized integrated dataoptimized for reporting andmetrics.Improve customer service and operational efficiency by providing front line staff and management timelyactionable information and metrics about their business processes and by holding them accountable forimprovement of those processes . 5
6
PERFORMANCE REPORTING
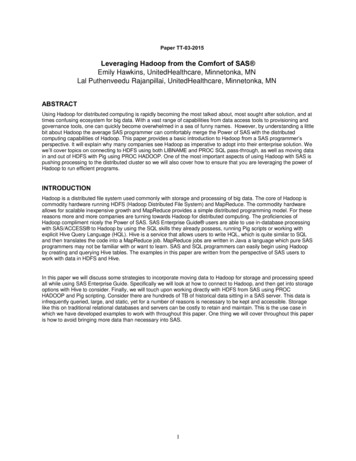
Seattle City LightMonthly Performance Metrics ReportJuly 2017Distribution OperationsCurrent Month Actual: 4.7 minutesFull Year Target: 63.4 minutes or lessJan. – July 2017: 39.2 minutesJan. – July 2016: 34.5 ebDuration in MinutesSAIDICurrent Month Actual: .027 eventFull Year Target: .73 event or lessJan. – July 2017: .235 eventJan. – July 2016: .226 pOctNovDecFrequency in Number ofEventsSAIFIMiles of Rights of Way ClearedCurrent Month Actual: 43 milesFull Year Target: 560 miles(Combined T&D)Jan. – July 2017: 263.1 milesJan. – July 2016: 307 les600
2017 SFPUCSystemStatisticsandActivitySFPUCNEWSERVICE LOCATIONS PER 100 SQUARE MILEMean QuartileMean2736Quartile 13563Quartile 2:2158Quartile 3:1375CommentsCalculationusedSF11.1 / ( SF5.1 / 100 ) , SF11.2 / ( SF5.1 / 100 ) ,SF11.3 / ( SF5.1 / 100 )Page 9
HIGH DISTRIBUTION PLANT IN SERVICE ASSETS We are significantly higher thanother utilities in amount ofdistribution assets in service perretail customer 10
DATA ANALYTICS
LABOR HOURS PERMANENT 2,939,2182016603,1472,751,684Per employee time off327338333333345358Per employee worked160916371650164116601635Non-Productive HoursProductive Hours 12
Utility Discount Program 13
RESIDENTIAL 5SEATTLE CITY LIGHT FINGERTIP FACTS10 14
RESIDENTIAL METER COUNT BY ANNUALCONSUMPTION BAND (KWH/YEAR): 2005 16
RESIDENTIAL METER COUNT BY ANNUALCONSUMPTION BAND (KWH/YEAR): 2015Substantial Increase In Number OfMeters Consuming Lower Quantities 17
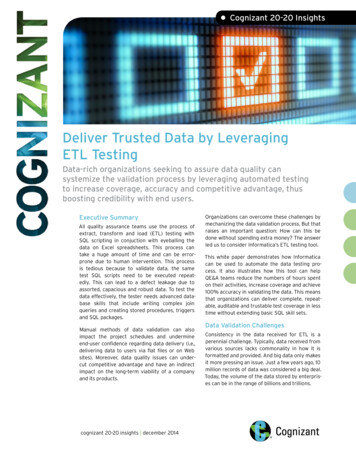
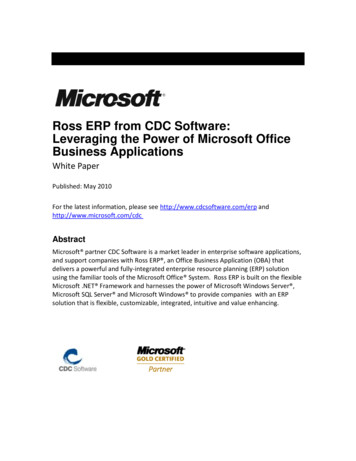
YEAR-ON-YEAR CHANGES IN RESIDENTIALCONSUMPTION AT THE METER LEVEL. There appears tobe a secularchange in thecomposition ofCity Light’sResidential Load.Regardless ofweather, overtime the numberof customersconsuming lessappears to begrowing.Year-On-Year Change In Residential Meter Counts By Consumption RangeNumber Of MetersAnnual Consumption 48-260-272500-75000New ,95345,05856,158 18
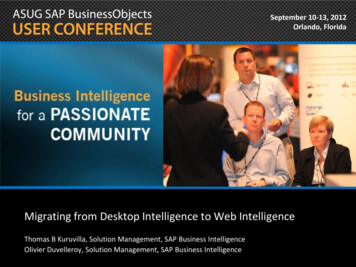
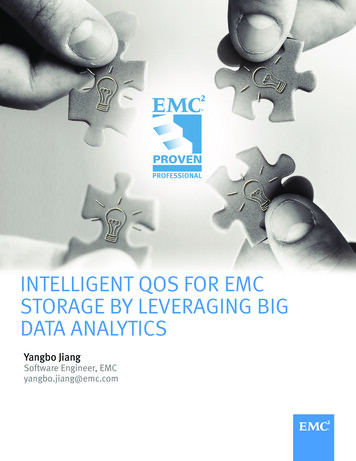
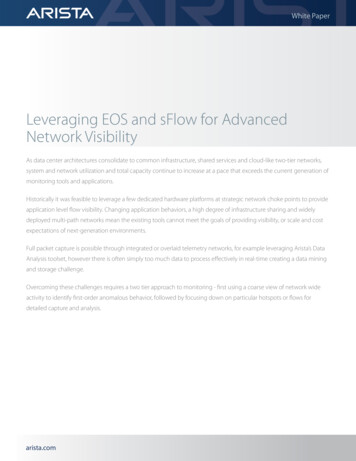
EXAMPLE OF DATA SCIENCE TECHNIQUES Dynamic Time Warping is a techniquefrom speech recognition, bioinformaticsand data science that accounts fortemporal changes particularly well. In the chart on the right, 2 time seriesthat are fundamentally similar but “off”on timing are aligned. In City Light’s context, this would allowus to effectively “line up” some meterreads and determine whether 2 meterswere following the same consumptionpattern over time, with one simply“starting” later than another.Fundamentally, if they are the samecustomer type, they can be clusteredwith other similar customers. This ismost applicable to monthly data. 19
DATA VISUALIZATION
City Light Meter Data
Residential Customers Clustered by Usage Patterns 22
WORKFORCE-WIDE COMMUTING STATISTICSAverage Commute Number Of Cumulative Percentage OfEmployeesTime (Minutes) Employees1 - 101056%10 - 1931724%20 - 2934743%30 - 3932962%40 - 4926177%50 - 5913084%60 - 6914292%70 - 795995%80 - 892797%90 - 992898%100 - 1091199%110 - 120499%120 16100% 23
IMPLICATIONS OF COMMUTING DISTANCE & TIME 24
DATA MARTS/ DATAWAREHOUSE/ DATA LAKE
Phase 1Phase 2Phase 3Phase 4Seattle City LightBI r InformationBudget vs. nformationData Validation andWorkflowRole BasedPrinterGroup BasedUser BasedCorporate/DepartmentBudget DataPowerGISTLM/NetGISPFS/DAMSXBCIS/EASMTLaptopDis tributionSnow Pack 27
Systems Used by Data MartSummitFinancial SystemEV5ATSQ’CeraSIMSSpreadsheetsCase MgmtTBDCity of SeattleSeattle City yCognosData MartCornerstoneMedgateOrg hierarchyFuture7
TOOLS AND THEIR USE
TOOLS AND THEIR USE Cognos Oracle OBIEE Oracle OUA Oracle BI Publisher Oracle ODI Tableau Socrata 30
QUESTIONS?
OUR MISSIONSeattle City Light is dedicated to delivering customers affordable, reliable andenvironmentally responsible electricity services.OUR VISIONWe resolve to provide a positive, fulfilling and engaging experience for our employees. Wewill expect and reinforce leadership behaviors that contribute to that culture. Our workforceis the foundation upon which we achieve our public service goals and will reflect thediversity of the community we serve.We strive to improve quality of life by understanding and answering the needs of ourcustomers. We aim to provide more opportunities to those with fewer resources and willprotect the well-being and safety of the public.We aspire to be the nation’s greenest utility by fulfilling our missionin an environmentally and socially responsible manner.OUR VALUESSafety, Environmental Stewardship, Innovation, Excellence, Customer Care
Budget vs . Actual Operational Information Source Applications CMART GIS TLM /NetGIS PFS /DAMS XBCIS /EASMT Summit INDUS Passport XFMR Maximo RevAmps ACP Snow Pack EMIS CCSS / Banner FPM EMR Apprentice- . Cognos Oracle OBIEE