Transcription
W E STE R N V IC TORI ANE S T UA RIE SC L A SSI FIC A TIO NP ROJ E C TJ MondonJ SherwoodF ChandlerJanuary 2003Project Consortium:C M A
Table of ContentsAcknowledgements . 41.Introduction. 62.Explanatory Notes for Estuary Data Sheets . 123.Management Implications of this Study . 20Aire River Estuary . 25Andersons (Grass) Creek Estuary . 27Anglesea River Estuary . 29Barham River Estuary . 31Barwon River Estuary . 33Blanket Bay River Estuary . 35Brown River Estuary . 37Carisbrooke Creek Estuary. 39Coalmine Creek Estuary . 41Cumberland River Estuary. 43Curdies River Estuary . 45Elliot River Estuary . 47Erskine River Estuary . 49Eumeralla River – Yambuck Inlet Estuary . 51Fawthrop Lagoon (Wattle Hill Creek) estuary . 53Fitzroy River Estuary . 55Gellibrand River Estuary . 57Glenelg River Estuary . 59Grey River Estuary . 61Hopkins River Estuary . 63Jamieson River Estuary . 65Johanna River Estuary . 67Kennett River Estuary . 69Merri River Estuary – eastern mouth . 71Merri River Estuary – Rutledges Cutting . 73Moggs Creek Estuary . 75Moyne River Estuary . 77Painkalac Creek Estuary . 79Parker River Estuary . 81
Petticoat Creek Estuary . 83Port Campbell Creek Estuary . 85Reedy Creek Estuary . 87Separation Creek Estuary. 89She Oak River Estuary . 91Sherbrook River Estuary. 93Skenes Creek Estuary . 95Smythe Creek Estuary . 97Spout Creek Estuary . 99Spring Creek Estuary . 101St George River Estuary . 103Stony Creek - Lorne Estuary . 105Stony Creek - Otway Estuary . 107Sugar Loaf Creek Estuary . 109Surrey River Estuary . 111Thompson Creek Estuary . 113Wild Dog Creek Estuary . 115Wye River Estuary . 117References . 119Appendix 1 Deakin University Estuarine Research . 120Appendix 2 Comparative Summaries for Western Victorian Estuaries . 125Glossary . 135Note:In order to display estuary data sheets and tables correctly on single pages thefollowing page set up is necessary:Top and bottom margins – 2 cmRight and left margins – 2.5 cmHeader and footer – 1.25 cm3
AcknowledgementsNumerous people and organizations have provided assistance over the course of thisproject throughout 2002. The authors wish to acknowledge the following: Project funding –Coasts and Clean Seas Natural Heritage Trust. Consortium membership and catchment management advice –Ms Kate Maltby (Parks Victoria), Mr John Turner (Corangamite CMA), MsLinda Grant and Ms Gillian Holmes (Glenelg Hopkins CMA), Dr AnthonyBoxshall (EPA Victoria). Field assistance –Ms Cheree Fenton, Dr Ty Mattews, Mr Colin Clay, Mr Simon Foley andMr Ben Foley (Deakin University), Dr Anthony Boxshall (EPA Victoria) Biological and geomorphological laboratory assistance –Ms Cheree Fenton, Mrs Cheryl Lammeretz, Mr Colin Clay, Miss Julie-anneLarner, Mr Peter Lind and Dr Ty Matthews (Deakin University) Technical assistance –Mr David Mills, Mr Paul Carlin and Mr Colin Magilton (Deakin University) Database construction advice –Mr Nathan Villier (Deakin University) Data collation and entry assistance –Mrs Cheryl Lammeretz and Miss Julie-anne Larner (Deakin University) Nutrient analysis –Ms Kate Hill, Ms Christina Byron, Mr Peter Kew, Ms Michele Herpich and DrNick Turoczy (Water Quality Laboratory, Deakin University) Expert identification of selected reference annelid and mollusc species –Dr Robin Wilson and Dr Robert Burn (Museum Victoria), Dr John Moverley(AMOG Consulting) GIS analysis –Mr Daniel Ierodiaconou and Dr Marc LeBlanc (Deakin Univerisity). AdditionalGIS information was provided by the Corangamite Catchment ManagementAuthority and the Glenelg Hopkins Catchment Management Authority.4
Thirty-six volunteers monitored twenty-six estuaries over a period of up to ten monthsfrom February 2002 – October 2002 (see below). Without their enthusiastic supportit is difficult to see how data on mouth state, estuary water level and otherobservations on estuaries could have been achieved.Volunteer groups who monitored selected western estuaries for the project:EstuaryTeamGlenelg RiverBruce Macereth, Dave Ryan, Don McCarthySurrey RiverSam Bruton, Judy RobertsFitzroy RiverMal Sutherland, Marilyn McCurdyEumeralla River - Lake YambuckWally & Rae ParsonsMoyne River - Belfast LoughTom McRaeMerri RiverCheree FentonHopkins RiverSteve HazelwoodCurdies RiverSteven BeatonPort Campbell CreekJeff TroutmanSherbrooke RiverJeff TroutmanGellibrand RiverMatt BowkerAire RiverGary SummersBarham RiverTim Godfrey, Peter GeekieWild Dog CreekJudy ForresterSkenes CreekPeter Arundell, Ian McIntyreWye RiverRoy MoriartyCumberland RiverJarrod & Wendy ChappellSt George RiverMichael & Christine CallananErskine RiverMichael & Christine CallananStony Creek - LorneMichael & Christine CallananCoalmine CreekDon & Dawn DiamondMoggs CreekBill ConnollyPainkalac CreekPauline ReillyAnglesea RiverElaine Holton, Jill Giles, Steve CarmichaelBarwon RiverRon Begg, Duscha Bradley5
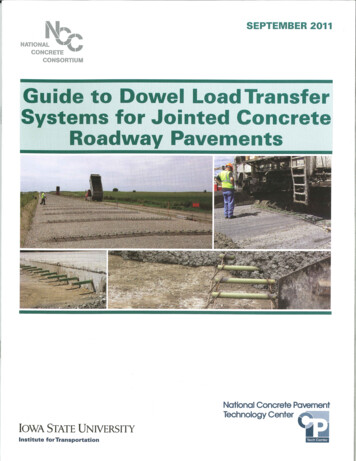
1.IntroductionEstuaries lie at the interface between marine, freshwater, terrestrial and atmosphericsystems, and form an integral part of the coastal zone. They comprise some of themost dynamic ecosystems on earth (Edgar et al. 1999a). Consequently the flora,fauna and habitats of estuaries are of great scientific, aesthetic and commercialinterest. The quality of coastal waters is inextricably linked to inputs from the land,and estuaries and their catchments are the main conduits for contaminants enteringthe coastal zone. Estuaries naturally protect the quality of coastal waters by diluting,filtering and settling out sediments and excess nutrients (Tagaza 1995). Estuarinesediments and waters are therefore the ultimate repository for much of the urban,industrial and agricultural contaminants entering the coastal waterways.Estuaries are:“Semi-enclosed coastal bodies of water where salt water from the open sea mixeswith freshwater draining from the land” (NLWRA 2002).The Western Victorian Estuaries Classification Project identified 46 estuariesextending from the Glenelg River on the South Australian border to the BarwonRiver, west of Point Lonsdale (Figure 1, Table 1).Figure 1. Western Victoria showing the location of the 46 estuaries identified between theSouth Australian border and Point Lonsdale. The proximity of some estuaries does not allowthem to be resolved in the figure.6
Table 1. Position of the mouths of Western Victorian estuaries identified between theSouth Australian border and Point Lonsdale.EstuaryGlenelg RiverFawthrop LagoonSurrey RiverFitzroy RiverEumeralla River – Lake YambuckMoyne River – Belfast LoughMerri River - Rutledges CuttingMerri River – EastHopkins RiverCurdies River – Curdies InletPort Campbell CreekSherbrook RiverGellibrand RiverJoanna RiverAire RiverParker RiverBlanket Bay CreekStony Creek - OtwaysElliot RiverBarham RiverWild Dog CreekSkenes CreekPetticoat CreekBrown RiverSugar Loaf CreekSmythe CreekCarisbrooke CreekGrey RiverKennett RiverWye RiverSeparation CreekJamieson RiverCumberland RiverShe Oak RiverSt George RiverErskine RiverStony Creek - LorneReedy CreekAnderson Creek (Grass Creek)Spout CreekCoalmine CreekMoggs CreekPainkalac Creek – Aireys InletAnglesea RiverSpring CreekThompsons CreekBarwon RiverLongitude (E)140 59’18”141 36’42”141 42’06”141 51’13”142 02’35”142 14’57”142 21’49”142 28’10”142 30’24”142 52’46”142 59’26”143 03’19”143 09’19”143 23’16”143 27’32”143 33’36”143 34’55”143 35’45”143 37’07”143 40’28”143 41’03”143 42’35”143 43’40”143 44’15”143 47’44”143 45’42”143 48’31”143 50’19”143 51’13”143 53’24”143 53’40”143 55’07”143 56’50”143 57’56”143 58’31”143 58’42”143 59’14”143 59’50”144 01’49”144 02’07”144 02’44”144 03’55”144 05’57”144 11’28”144 19’02”144 22’32”144 29’42”Latitude (S)38 03’36”38 21’06”38 15’39”38 15’50”38 20’22”38 23’23”38 21’05”38 24’13”38 24’14”38 36’36”38 37’14”38 38’41”38 42’28”38 46’12”38 48’30”38 50’48”38 49’40”38 48’46”38 47’44”38 45’52”38 44’13”38 43’37”38 43’09”38 43’00”38 41’56”38 42’23”38 41’41”38 41’03”38 40’05”38 38’12”38 37’55”38 35’53”38 34’42”38 34’06”38 33’24”38 32’02”38 31’22”38 30’47”38 29’08”38 28’38”38 28’25”38 28’13”38 28’14”38 24’59”38 20’42”38 18’16”38 17’02”7
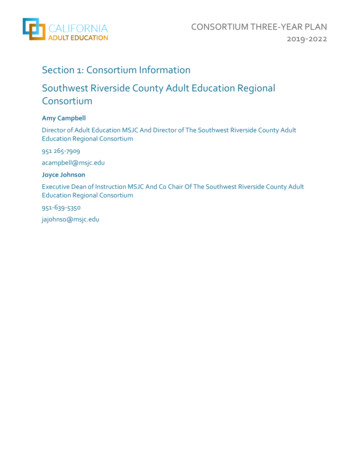
Western Victoria exhibits a Mediterranean climate characterised by high rainfallduring winter and spring, followed by relatively low rainfall during summer andautumn. This “winter-wet, summer-dry” pattern results in seasonal changes inriver/estuary discharge. Peak discharges in August - September are typically up totwenty times higher than the autumn minima in March – April (Figure 2). Thevariation in freshwater input results in significant seasonal changes to salinity withinthe estuaries (Sherwood 1985).Q(GL/month)Mean Monthly Hopkins120Barwon100806040200Jan Mar May Jul Sep NovMonthFigure 2. Variation in discharge levels with season at the Gellibrand, Glenelg,Hopkins and Barwon rivers.Salinity within estuaries varies along their length and over time from freshwater (lessthan 1 ppt salinity) to that of seawater (35 ppt) or greater. Many of the estuaries arehighly stratified with a freshwater surface layer overlying saline bottom water. Theboundary between the two layers may vary between a few centimeters to over
estuaries result from river flows and may submerge farm pastures, jetties, roads and other structures. Migration of organisms (eg. fish larvae) between river / estuary and sea ceases, and wetland habitats, such as saltmarsh and tidal flats, are flooded. Mouth closure, and the associated inundation of nearby land and coastal reserves