Transcription
Consortium for Congenital Cardiac Care Measurement of Nursing PracticePhase III Pilot Testing Aggregate Result ReportJanuary 2016 – September 2016Principal Investigator:Jean Connor PhD, RN, CPNP, FAANProject Team:Lauren Hartwell BSJennifer Baird PhD, MSW, RNCourtney Porter MPHPatricia Hickey PhD, MBA, RN, FAANFunding Sources:Boston Children’s Hospital Program for Patient Safety & Quality (2013, 2014)National Congenital Heart Defect Coalition (2014)
A teaching affiliate of Harvard Medical School300 Longwood Avenue, Boston, Massachusetts 02115617-355-6000www.childrenshospital.orgDear Colleagues,We are pleased to inform you that we have completed the analysis of benchmark data collected from theConsortium for Congenital Cardiac Care - Measurement of Nursing Practice (C4-MNP) Phase III pilot testing.The goal of C4-MNP is to establish a national collaborative to identify nursing care actions for measurement inthe highly complex pediatric cardiovascular care environment. Through the framework of the consortium, anational community of researchers, administrators, and clinicians has formed a broad network committed torigorous measurement of the quality of care delivered by pediatric cardiovascular nurses.The purpose of C4-MNP Phase III was to implement candidate quality measures for pilot testing andbenchmarking in free-standing children’s hospitals in the United States. The 10 measures that emerged frominternal consensus and external review in Phase II were tested at a subset of nine participating sites over a sixmonth timeframe. Below, please find the aggregate result report.Pilot sites were selected based on available resources to support data collection and ongoing participation inthe Children’s Hospital Association Pediatric Health Information System (PHIS). Participation in PHIS wasrequired as this dataset will be used to link patient outcome data to information collected for the measures(Phase IV).On behalf of this research team, I would like to extend our heartfelt appreciation for your continuedcommitment to this collaborative as we work to improve outcomes for pediatric cardiovascular patients andtheir families. I am confident that we will continue to generate new knowledge that will be important to ourpractice and to the overall field of pediatric cardiovascular nursing. Finally, we would like to recognize theBoston Children’s Hospital Program for Patient Safety & Quality and the National Congenital Heart DefectCoalition for their generous support of this work.Please let me know if you have any questions.Sincerely,Jean Anne Connor PhD, RN, CPNP, FAANDirector, Nursing ResearchCardiovascular & Critical CareBoston Children’s HospitalBoston, MA 02115jean.connor@childrens.harvard.edu617-355-8890 (t)617-739-5022 (f)Page 2 of 33
Table of ContentsIntroduction2Measure One: Health of the Work Environment4-7Measure Two: Overall Years of Nursing Experience8-10Measure Three: Bachelor of Science in Nursing (BSN) Education11-13Measure Four: Nursing Certification14-16Measure Five: Nursing Staff Turnover17-19Measure Six: Weight Gain within 72 Hours of Discharge20-22Measure Seven: Feeding Safety23-25Measure Eight: Utilization of Early Warning Scores26-27Measure Nine: Pain Scores Decreased within 60 Minutes28-30Measure Ten: Device-Related Pressure Ulcers31-33Page 3 of 33
Measure One: Health of the Work EnvironmentMeasure DescriptionHuman factors, communication, and leadership issues are the root cause of 60% of all sentinel eventsreported to the Joint Commission. In response, the American Association of Critical Care Nurses (AACN)identified essential standards for establishing and sustaining a healthy work environment. In 2009, the AACNlaunched their Healthy Work Environment (HWE) validated assessment tool, which provides a quantitativescore for the standards of the HWE framework: Skilled Communication, True Collaboration, Effective DecisionMaking, Appropriate Staffing, Meaningful Recognition and Authentic Leadership. It is critical to maintain aculture of health in the work environment to ensure optimal patient outcomes.Intensive Care and Acute Care Units Combined:AACN Healthy Work Environment (HWE) AssessmentAll Units (N 12)*Intensive Care and Acute Care Units CombinedMinimum Median MaximumNumber of Respondents183377Overall HWE Score3.293.683.91Skilled Communication3.073.623.99True Collaboration3.093.633.85Effective Decision-Making3.463.854.04Appropriate Staffing3.153.534.05Meaningful Recognition3.053.533.84Authentic Leadership3.393.864.07*One site did not survey the acute care unit; two sites conducted a combined acutecare and ICU survey.Page 4 of 33
Measure One: Health of the Work Environment (continued)Intensive Care Units Only:AACN Healthy Work Environment (HWE) AssessmentICUs (N 7)*Intensive Care Units OnlyMinimum Median MaximumNumber of Respondents214977Overall HWE Score3.293.653.91Skilled Communication3.073.533.99True Collaboration3.093.473.75Effective Decision-Making3.463.714.03Appropriate Staffing3.273.674.05Meaningful Recognition3.053.513.84Authentic Leadership3.393.854.00*One site did not survey the acute care unit; two sites conducted a combined acutecare and ICU survey.Page 5 of 33
Measure One: Health of the Work Environment (continued)Acute Care Units Only:AACN Healthy Work Environment (HWE) AssessmentAcute Care Units (N 3)*Acute Care Units OnlyMinimum Median MaximumNumber of Respondents183071Overall HWE Score3.493.73.75Skilled Communication3.633.773.83True Collaboration3.423.723.79Effective Decision-Making3.833.874.02Appropriate Staffing3.153.373.59Meaningful Recognition3.143.413.69Authentic Leadership3.793.83.89*One site did not survey the acute care unit; two sites conducted a combined acutecare and ICU survey.Page 6 of 33
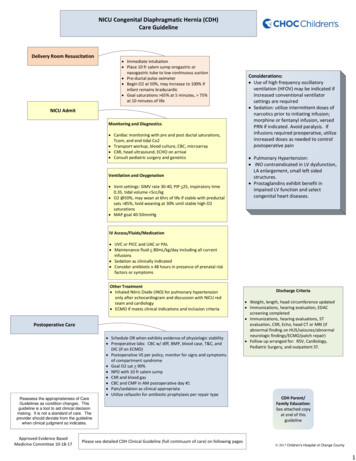
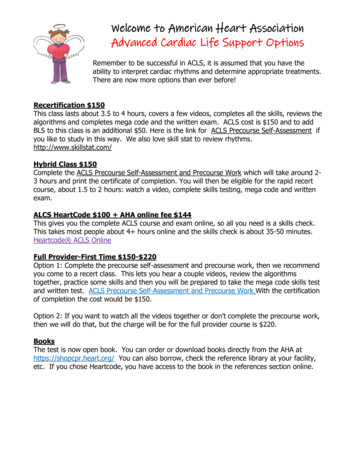
Measure One: Health of the Work Environment (continued)Benchmark Testing for Intensive Care and Acute Care Units:Note: Benchmark based on internal Boston Children’s Hospital target of scoring in the “good”range or above (1.00 – 2.99 Needs Improvement; 3.00 – 3.99 Good; 4.00 – 5.00 Excellent).Page 7 of 33
Measure Two: Overall Years of Nursing ExperienceMeasure DescriptionNursing experience is a unit-level measure of the percentage of registered nursing staff providing patient carethat has 0-2 years of any clinical experience. Research conducted by Hickey et al (2013, 2016) confirmed therelationship between overall clinical nursing experience and pediatric inpatient outcomes. Unit staffingmodels with greater than 20% of nurses with 0-2 years of overall nursing experience resulted in an increasedrisk of inpatient mortality. This annual measure monitors the percentage of nursing staff that has 0-2 years ofoverall nursing experience to inform staffing models and safeguard patient outcomes.Intensive Care and Acute Care Units Combined:Overall Years of Nursing ExperienceAll Units (N 15)Intensive Care and Acute Care Units CombinedMinimumMedianMaximumNumber of Current RNs with 0-2 Years of Experience31435Number of Current RNs1358173Percent of Current RNs with 0-2 Years of Experience6%23%74%Page 8 of 33
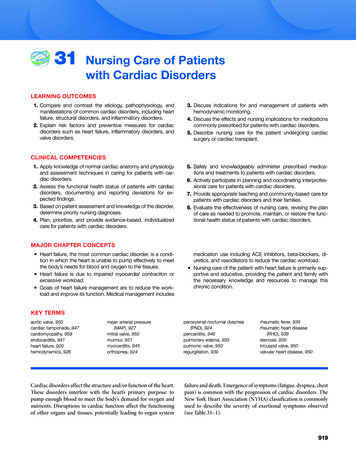
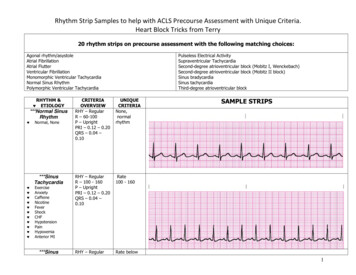
Measure Two: Overall Years of Nursing Experience (continued)Intensive Care Units Only:Overall Years of Nursing ExperienceICUs (N 9)Intensive Care Units OnlyMinimumMedianMaximumNumber of Current RNs with 0-2 Years of Experience32135Number of Current RNs4670173Percent of Current RNs with 0-2 Years of Experience6%20%34%Benchmark Testing for Intensive Care Units:Note. Benchmark of less than 20% of nurses with 0-2 years of overall nursing experience based onevidence from Hickey P., et al. 2013 and 2016.Page 9 of 33
Measure Two: Overall Years of Nursing Experience (continued)Acute Care Units Only:Overall Years of Nursing ExperienceAcute Care Units (N 6)Acute Care Units OnlyMinimumMedianMaximumNumber of Current RNs with 0-2 Years of Experience713.525Number of Current RNs1345.5139Percent of Current RNs with 0-2 Years of Experience9%37%74%Benchmark Testing for Acute Care Units:Note. Target based on ICU benchmark of less than 20% of nurses with 0-2 years of overall nursingexperience.Page 10 of 33
Measure Three: Bachelor of Science in Nursing (BSN) EducationMeasure DescriptionBSN education is a unit-level measure of the percentage of registered nursing staff who are at least BSNprepared. Studies have shown that there is a significant association between the educational level of RNs andoutcomes for patients in the acute care setting, including mortality. Additionally, BSN-prepared nurses are ina better position to achieve masters or doctoral level degrees, which will be increasingly necessary with thegrowing demand for primary care clinicians, nurse researchers and nurse faculty. The Committee from theRobert Wood Johnson Foundation Initiative on the Future of Nursing at the IOM recommended that at least80% of nursing staff on a unit are BSN-prepared by the year 2020.Intensive Care and Acute Care Units Combined:Bachelor of Science in Nursing (BSN) EducationAll Units (N 15)Intensive Care and Acute Care Units CombinedMinimumMedianMaximumNumber of Current RNs with BSN952162Number of Current RNs1358173Percent of Current RNs with BSN51%87%98%Page 11 of 33
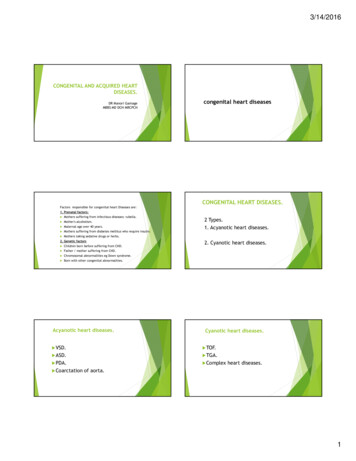
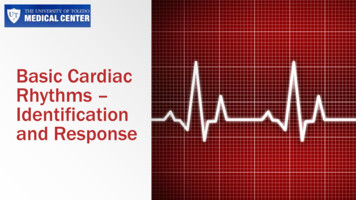
Measure Three: Bachelor of Science in Nursing (BSN) Education (continued)Intensive Care Units Only:Bachelor of Science in Nursing (BSN) EducationICUs (N 9)Intensive Care Units OnlyMinimumMedianMaximumNumber of Current RNs with BSN3954162Number of Current RNs4766173Percent of Current RNs with BSN79%88%98%Benchmark Testing for Intensive Care Units:Note. Benchmark based on IOM goal to achieve a nurse workforce that is 80% BSN-prepared by 2020.Page 12 of 33
Measure Three: Bachelor of Science in Nursing (BSN) Education (continued)Acute Care Units Only:Bachelor of Science in Nursing (BSN) EducationAcute Care Units (N 6)Acute Care Units OnlyMinimumMedianMaximumNumber of Current RNs with BSN930127Number of Current RNs1342139Percent of Current RNs with BSN51%80%91%Benchmark Testing for Acute Care Units:Note. Benchmark based on IOM goal to achieve a nurse workforce that is 80% BSN-prepared by 2020.Page 13 of 33
Measure Four: Nursing CertificationMeasure DescriptionNursing certification is a unit-level measure of the percentage of registered nursing staff providing patient carewho are CCRN or CPN certified. There is currently emerging evidence linking nursing certification to patientoutcomes (Hickey P, et al., in press).Intensive Care and Acute Care Units Combined:Nursing CertificationAll Units (N 15)Intensive Care and Acute Care Units CombinedMinimumMedianMaximumNumber of Current RNs with Certification42069Number of Current RNs with 1800 Hours846139Percent of Current RNs with Certification19%40%69%Count of CCRN Certification0769Count of CPN Certification0831Page 14 of 33
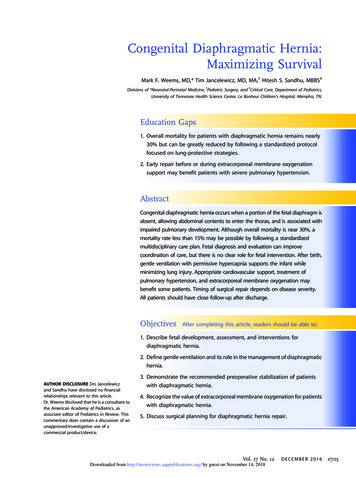
Measure Four: Nursing Certification (continued)Intensive Care Units Only:Nursing CertificationICUs (N 9)Intensive Care Units OnlyMinimumMedianMaximumNumber of Current RNs with Certification102769Number of Current RNs with 1800 Hours4366126Percent of Current RNs with Certification19%41%55%Count of CCRN Certification01069Count of CPN Certification0825Benchmark Testing for Intensive Care Units:Note. Benchmark of greater than 25% of nurses with certification is based on evidence fromHickey P., et al. currently in press.Page 15 of 33
Measure Four: Nursing Certification (continued)Acute Care Units Only:Nursing CertificationAcute Care Units (N 6)Acute Care Units OnlyMinimumMedianMaximumNumber of Current RNs with Certification41256Number of Current RNs with 1800 Hours829.5139Percent of Current RNs with Certification27%40%69%Count of CCRN Certification0430Count of CPN Certification05.531Benchmark Testing for Acute Care Units:Note. Target based on ICU benchmark of greater than 25% of nurses with certification.Page 16 of 33
Measure Five: Nursing Staff TurnoverMeasure DescriptionNursing staff turnover is a unit-level measure of the percentage of registered nursing staff who were notretained by the unit each calendar year. This definition includes both departures to other organizations andinternal promotions and transfers. This measure recognizes the impact of the work environment on nursingstaff retention, and its link to quality outcomes.Intensive Care and Acute Care Units Combined:Nursing Staff TurnoverAll Units (N 15)Intensive Care and Acute Care Units CombinedMinimumMedianMaximumNumber of RNs Departed in CY201511428Number of RNs Employed in CY20151364173Percent of RN Staff Turnover2%18%32%Total Budgeted RN FTEs10.7351.42149.98Primary Reason for RN DepartureAcute Care Units(N 6)ICUs(N 9)All Units(N 15)Left organization for other opportunity114657Transferred to another unit203151Moved out of area131629Returned to school51116Promoted within organization11112Family responsibilities01111Personal reasons088Organization terminated employment145Transferred to internal float pool112Retired101Page 17 of 33
Measure Five: Nursing Staff Turnover (continued)Intensive Care Units Only:Nursing Staff TurnoverICUs (N 9)Intensive Care Units OnlyMinimumMedianMaximumNumber of RNs Departed in CY201511628Number of RNs Employed in CY20154888173Percent of RN Staff Turnover2%18%27%Total Budgeted RN FTEs10.7343.10149.98Benchmark Testing for Intensive Care Units:Note. No established benchmark available. Median of C4-MNP pilot site data presented.Page 18 of 33
Measure Five: Nursing Staff Turnover (continued)Acute Care Units Only:Nursing Staff TurnoverAcute Care Units (N 6)Acute Care Units OnlyMinimumMedianMaximumNumber of RNs Departed in CY2015311.514Number of RNs Employed in CY20151344139Percent of RN Staff Turnover8%22%32%Total Budgeted RN FTEs41.1272.04140.7Benchmark Testing for Acute Care Units:Note. No established benchmark available. Median of C4-MNP pilot site data presented.Page 19 of 33
Measure Six: Weight Gain within 72 Hours of DischargeMeasure DescriptionWeight gain is a unit-level measure of the percentage of surgical inpatients aged 3 months whodemonstrated an average weight gain of 0.015 - 0.02 kg/day, or a positive trend in weight, within 72 hoursprior to discharge home. Weight gain prior to discharge is an important predictive factor for patientoutcomes, especially in the population of surgical infants aged 3 months.Intensive Care and Acute Care Units Combined:Weight Gain within 72 Hours of nth 114%45%80%Month 238%53%100%Percent of Eligible Patients withMonth 30%58%100%Weight Gain within 72 Hours of DischargeMonth 40%50%100%Month 50%49%100%Month 617%50%100%Intensive Care and Acute Care Units CombinedAll Units (N 10)**One site reported data for their acute care unit instead of their ICU because no patients are dischargedfrom the ICU. ICU data from 5 sites were excluded because there were no eligible patients or there wasonly one month with eligible patients (i.e., patients were not routinely discharged from these ICUs).Page 20 of 33
Measure Six: Weight Gain within 72 Hours of Discharge (continued)Intensive Care Units Only:Weight Gain within 72 Hours of nth 140%60%80%Month 250%56%100%Percent of Eligible Patients withMonth 367%80%100%Weight Gain within 72 Hours of DischargeMonth 450%50%67%Month 525%67%75%Month 650%50%100%Intensive Care Units OnlyICUs (N 3)**One site reported data for their acute care unit instead of their ICU because no patients are dischargedfrom the ICU. ICU data from 5 sites were excluded because there were no eligible patients or there wasonly one month with eligible patients (i.e., patients were not routinely discharged from these ICUs).Benchmark Testing for Intensive Care Units:Note. No established benchmark available.Page 21 of 33
Measure Six: Weight Gain within 72 Hours of Discharge (continued)Acute Care Units Only:Weight Gain within 72 Hours of nth 114%42%67%Month 238%50%100%Percent of Eligible Patients withMonth 30%50%67%Weight Gain within 72 Hours of DischargeMonth 40%58%100%Month 50%43%100%Month 617%42%100%Acute Care Units OnlyAcute Care Units (N 7)**One site reported data for their acute care unit instead of their ICU because no patients aredischarged from the ICU.Benchmark Testing for Acute Care Units:Note. No established benchmark available.Page 22 of 33
Measure Seven: Feeding SafetyMeasure DescriptionFeeding safety is a unit-level measure of the rate of adverse feeding events in post-operative cardiac surgicalinpatients aged 3 months. As attention is placed on measuring weight gain prior to discharge, this balancingmeasure will ensure that any unintended consequences are captured.Intensive Care and Acute Care Units Combined:Feeding SafetyDataCollectionMonthMinimumMedianMaximumMonth 10.00.04.5Month 20.00.02.3Adverse Feeding Event RateMonth 30.00.02.3per 100 Eligible Patient DaysMonth 40.00.014.3Month 50.00.04.0Month 60.00.02.3Intensive Care and Acute Care Units CombinedAll Units (N 15)Adverse Feeding Event TypeAcute Care Units(N 2)ICUs(N 4)All Units(N 6)Necrotizing Enterocolitis (NEC)42630Aspiration Pneumonia011Page 23 of 33
Measure Seven: Feeding Safety (continued)Intensive Care Units Only:Feeding SafetyDataCollectionMonthMinimumMedianMaximumMonth 10.00.04.5Month 20.00.02.1Adverse Feeding Event RateMonth 30.00.02.3per 100 Eligible Patient DaysMonth 40.00.014.3Month 50.00.04.0Month 60.00.22.3Intensive Care Units OnlyICUs (N 9)Benchmark Testing for Intensive Care Units:Note. No established benchmark available. Rates normalized to 100 patient days to allow forcomparison across sites. Lower rates are better.Page 24 of 33
Measure Seven: Feeding Safety (continued)Acute Care Units Only:Feeding SafetyDataCollectionMonthMinimumMedianMaximumMonth 10.00.00.2Month 20.00.02.3Adverse Feeding Event RateMonth 30.00.00.3per 100 Eligible Patient DaysMonth 40.00.00.0Month 50.00.00.0Month 60.00.00.0Acute Care Units OnlyAcute Care Units (N 6)Benchmark Testing for Acute Care Units:Note. No established benchmark available. Rates normalized to 100 patient days to allow forcomparison across sites. Lower rates are better.Page 25 of 33
Measure Eight: Utilization of Early Warning ScoresMeasure DescriptionUse of early warning scores is a unit-level measure of the rate of unplanned transfers to the CICU associatedwith code blue, resuscitation, or unprecedented need for escalation in care among patients on an acutecardiac care unit. Unplanned transfers from the inpatient floor to the ICU imply that significant clinicaldeterioration has occurred in the medical status of the patient without it being appreciated. The goal ofmedical therapy is to prevent the former from occurring, or recognize deterioration sufficiently early so thattransfer to the ICU is not emergent. This measure attempts to understand whether the use of early warningscore systems is associated with the rate of unplanned ICU transfers in the cardiac inpatient unit.Acute Care Units Only:Utilization of Early Warning ScoresDataCollectionMonthMinimumMedianMaximumMonth 10.07.120.8Month 20.04.417.1Unplanned Transfer RateMonth 30.07.414.8per 1000 Cardiovascular Patient DaysMonth 40.04.926.4Month 50.06.419.4Month 60.08.833.3Acute Care Units OnlyAcute Care Units (N 8)**One site reported data for their acute care unit instead of their ICU, and one site provided acutecare unit data for this measure only.Early Warning Score ToolAcute Care Units(N 8)PEWS5CHEWS1SAFE Score1None1Page 26 of 33
Measure Eight: Utilization of Early Warning Scores (continued)Benchmark Testing for Acute Care Units:Note. No established benchmark available. Rates normalized to 1000 patient days to allow forcomparison across sites. Lower rates are better.Page 27 of 33
Measure Nine: Pain Scores Decreased within 60 MinutesMeasure DescriptionPain scores decreased is a unit-level measure of the percentage of documented pain scores 4 with a 30% ormore decrease withi
Nursing certification is a unit-level measure of the percentage of registered nursing staff providing patient care who are CCRN or CPN certified. There is currently emerging evidence linking nursing certification