Transcription
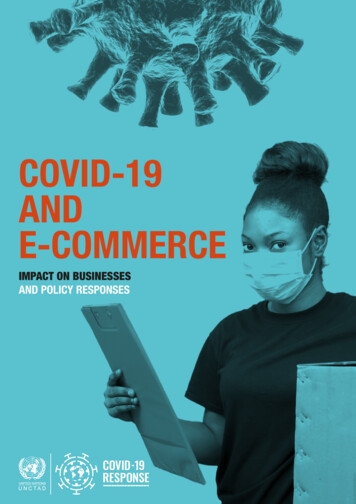
COMMERCE BANCSHARES, INC.ANNUAL SHAREHOLDERS MEETINGApril 18, 2018David KemperChairman and Chief Executive Officer
CAUTIONARY STATEMENTA number of statements we will be making in our presentation and in theaccompanying slides are “forward-looking statements” within themeaning of the Private Securities Litigation Reform Act of 1995, such asstatements of the Corporation’s plans, goals, objectives, expectations,projections, estimates and intentions. These forward-looking statementsinvolve significant risks and uncertainties and are subject to changebased on various factors (some of which are beyond the Corporation’scontrol). Factors that could cause the Corporation’s actual results todiffer materially from such forward-looking statements made herein orby management of the Corporation are set forth in the Corporation’s 2017Report on Form 10-K and the Corporation’s Current Reports on Form 8-K.22
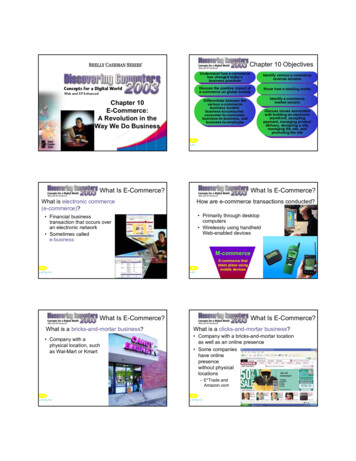
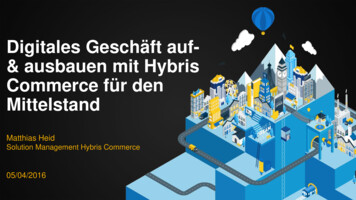
ABOUT COMMERCEBANCSHARES968 724 135 512YEARS IN BUSINESSLARGEST U.S. BANKBASED ON ASSET SIZE1BILLION IN TOTAL DEPOSITS 6.0BILLION IN TOTAL LOANSBILLION MARKETCAPITALIZATION334TH176 branches and 376 ATMs in our footprintExtended Commercial Market AreaCommercial Payments Services offered in 48 statesNine key markets St. Louis Central Missouri Kansas City Central Illinois Springfield Wichita Tulsa Oklahoma City DenverCommercial offices Cincinnati Dallas Nashville Des Moines Indianapolis Grand RapidsSource: 1S&P Global Market Intelligence as of 12/31/2017; Company reports and filings as of 12/31/2017153BILLION INASSETS46TH64 24.8LARGEST U.S. BANKBASED ON MARKETCAPITALIZATION1 48.7BILLION INTRUST ASSETS20THLARGEST AMONG U.S. BANKOWNED TRUST COMPANIESBASED ON AUM1 20.4 14.0 7.9BILLION IN COMMERCIALCARD VOLUME12.46%RETURN ON AVERAGECOMMON EQUITY5THROACE FOR THE TOP 50U.S. BANKS BASED ONASSET SIZE133
SUPER-COMMUNITY BANK PLATFORMA consistent strategy with a long term viewCommunity Bank Quickly adapt tocustomer needsand changingpreferences Core valuesembraced byemployees Award winningcustomer service Focus on the fullclient relationshipCustomer relationship-basedCHALLENGE ACCEPTEDHigh performing teams andengaged workforceInvestment in distinctive, highreturn businessesLong history of top quartile creditquality metricsSuper-Regional Bank Sophisticatedpayment systemcapabilities Broad consumerproduct offerings Private Banking;Trust; Capital Markets Shareholder drivenand strong financialDisciplined approach to acquisitions performance Competitive on unitFocus on operational efficienciescosts44
A STRONG EMPHASIS ON CULTURE2017 Employee Engagement1Givingto our VALUESWe have along termWeiewcollaborateas neteamWe act withntegrityWe striveforxcellenceWe areustomerfocused78% Engaged, long-termleadership team Focus on people and talentdevelopment Knowledge of customersand markets Collaboration drives salesacross business lines Focus on EPS growth Investing in thecommunities in which weoperate75%CommerceU.S. HighPerformance Norm74%U.S. FinancialServices Norm Contributed 32 million to CommerceBancshares Foundation to enableexpanded community support Rated “outstanding” from the FederalReserve for community reinvestment Employees heavily engaged in thecommunities we serveENABLES EXECUTION OF CORPORATE STRATEGIES1TheKorn Ferry Hay Group – 2017 survey results5
RECENT RECOGNITIONCommerce Bank was recognized with eightGreenwich Excellence Awards in the following categories:Middle Market Banking ( 10-500MM)Cash Management - Overall SatisfactionCash Management - Overall Satisfaction - MidwestLikelihood to Recommend / Net Promoter ScoreLikelihood to Recommend / Net Promoter Score - MidwestOverall SatisfactionOverall Satisfaction - MidwestProactively Provides Advice – MidwestThe 2017 Private Asset ManagementAwards recognize and reward topinvestment professionals, wealthadvisors, legal firms, consultants andother key service providers operatingwithin the private asset managementindustry.Small Business Banking ( 1-10MM)Likelihood to Recommend / Net Promoter Score - MidwestRanked 62 out of300 midsizeemployers(companies with1,000 to 5,000employees).Commerce ranks#2 among otherbanks on the list.The award publiclyrecognizes Korn Ferryclients that haveachieved best-in-classlevels of engagement.Commerce is one of onlythree companies in theUnited States to receivethis global award.66
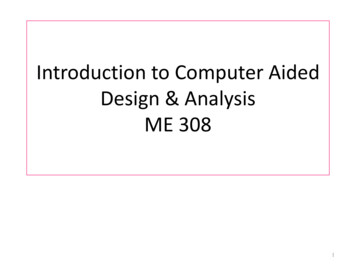
ECONOMIC THEMESWe expect growth to accelerate even further in 2018. It would not surprise us if growthapproaches or even surpasses 3% this year. The key drivers to this growth are: Increasing levels of employment Growth in business and consumer confidence that is translating to increasing retail sales and adeepening of the capital stock with investment in infrastructure and capital equipment A continued recovery in the housing market A positive tailwind from the global economy Record stock prices A boost from the Trump tax planU.S. Real 200-2%-3%-40010-year Average"Sustainable" Trend ce: Commerce Trust Company, U.S. Bureau of Economic Analysis, Bloomberg2017-1,000-5%3 Month Change (right axis)-800Y-O-Y (left axis)1973-4%-600-6%Monthly Increase (left axis)200020022004200620082010201220142016-7%7
THEMES IN THE BANKING INDUSTRY The traditional brick and mortar retail branch network remainsrelevant but with evolution of format and emphasis on strategiclocation Tech enhancements to the digital experience will continue to meet thecustomers changing needs; organic growth as a result Maintaining a balance between deposit retention and rate adjustments Fraud and cyber crimes continue to be a big threat driving biginvestments to improve security Fintechs are no longer viewed strictly as a competitive threat but alsoas potential partnership opportunities Increased investments in innovation and an ongoing emphasis onreducing operating costs Introduction of new technologies, automated processes and the needto replace aging core systems Regulation is still a strong influence in the industry but pace of newregulation is slowing; leadership changes at government agencies willcontinue to play a role8
MAINTAINING THE BALANCESTRONG PERFORMANCE withongoing refinement of the “CoreBank”Disciplined focus on PRIORITYBLUE CHIP investments Super-Community Bank platform Funding Future Growth Relationship-based banking High-touch customer serviceExpansion Market Growth Transform the Retail Model Enhance Private Client Model Disciplined attention to risk return Health Services Financing Divest in businesses & activitiesthat no longer provideacceptable returns Claims Payments Commerce Bank Mortgage A highly engaged workforce Enterprise CRM Focus on profitability andshareholder return Succession Planning Full suite of product and serviceofferings emphasis on culture, collaboration & core values9
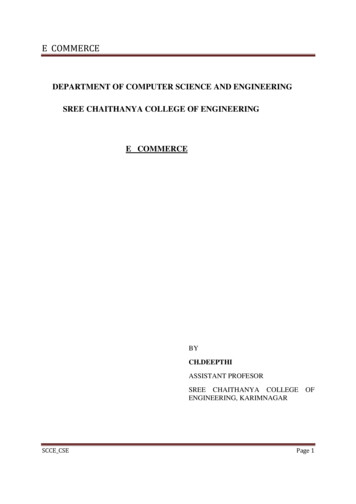
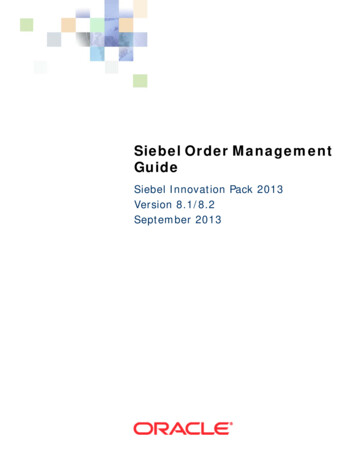
CONSUMER BANKING 10.3 2.5ConsumerDepositsConsumerLoans2016 10.2Monthly Banking Sessions(in 002017:54.7%App StoreRating2,0001,0002016:2016Period end balances, Information as of December 31, 20172017MobileDeposit UseMobilePenetration2016:49.4%5,0002015since 2009Continue Expanding Digital erAuto LoansBILLIONBanking Channel Preferences 15MILLIONBILLION 2.5BILLION7,000 1.0BILLIONBILLION2009 113.5 MILLION2017:2016:3.3%as of1/17/182017:7.6%Digital LoanSales(000s)2016: 19,1572017: 25,5001010
For high net worth individuals who are looking to simplify their complex financial life, The CommerceTrust Company provides a full-service approach to wealth management.20TH 48.7BILLIONLargest AmongBank-OwnedTrust Company2Total ClientAssets1Total Client Assets in billions 38.4 43.1 48.720162017 in billions2015 13%Record AssetManagementSalesAssets UnderManagementAssets Under Management 22.62015 30.0BILLION 25.42016Period end balances, Information as of December 31, 20171Assets under Administration2S&P Global Market Intelligence ranking as of 12/31/2017, based on assets under management 30.02017Asset Management SalesGrowth13%6%20157%201620171111
COMMERCIAL BANKINGRevenue growth opportunitiesCommercialLoansCommercialDeposits5 Yr.CAGRCommercial Loans 8.4 8.120162017Period end balances, Information as of December 31, 20172015 2.1% in millions 8.5 7.920165 Yr.CAGRCommercial Revenue in billions 7.520155 Yr.CAGRCommercial Deposits 8.9CommercialRevenue 3.0% 9.3% in billions 523MILLION 7.9BILLION 8.9BILLION2017 511.0 523.0 491.020152016201712
COMMERCIAL BANKING – EXPANSIONMARKETS OFFERING GROWTH OPPORTUNITIESNashvilleCincinnatiOklahomaExpansion Market Loan GrowthDenverDallas s in millions 2,000 1,500 1,000 962 608 500 0 1,091 1,338 1,5422013201420152016Personnel Overview for Expansion Markets201716.2%20174.3%218Cincinnati* As of August 2017195%Loan Growth 2017 vs 2016#of commercial bankers per market*(includes open positions)8 1,793since 201220122012ExpansionMarket LoanGrowth1414Denver81533Oklahoma NashvillePeriod end balances, Information as of December 31, 20178Total CompanyExpansion MarketsDallas1313
COMMERCIAL PAYMENTS 194MILLIONPaymentsRevenueEMBRACINGINNOVATION INTHE PAYMENTSSYSTEMSOur full suite ofproducts and servicesbrings real value toclient relationshipsPeriod end balances, Information as of December 31, 2017 7.9BILLION 145MILLIONCommercialCard VolumeHealth ServicesFinancingLoansInvoice Capture andWorkflow Approval 42MILLIONTreasuryServicesRevenuePayments HubSupply Chain FinanceHealth Services FinancingClaims Payments Remit Connect1414
FEE INCOME AT 40% OF TOTAL REVENUEBalanced mix of interest and non-interest incomeNon-Interest Income8% 400Wealth Management13%1%7% millionsNet Interest IncomeCard Income11%Other10%3% 3%5%20142015Fees And Commissions60%6% 448 487Deposit Service ChargesCommerceBank* 419 437 4742012201320162017Continued focus on growing fee income throughnew and existing product and services offeringsExamples:PeerBanks*73% Toggle Remitconnect Supply chain financeInsurance claims payment processingAccounts Payable automationSwapsPeer Banks include: ASB, BKU, BOKF, CFR, FHN, FNB, FULT, HBHC, IBKC, ISBC, MBFI, PB, SNV, TCF, UMBF, UMPQ, VLY, WBS, WTFC*Source: S&P Global Market Intelligence & FIS as of 12/31/201715
WHERE DO WE RANK AGAINST PEERS?CBSH1Q18 ROA:1.66%ROA – 4Q2017BankUnitedMB aWintrustWebster FinUMBSynovusFultonHancockAssociatedValleyFNBFirst HorizonIBERIABANKInvestorsSource: S&P Global Market 9%0.58%0.52%(YTD RESULTS – DECEMBER 2017)CBSH1Q18 ROACE:15.58%ROACE – 4Q2017BankUnitedCommerceUMBCullen/FrostMB FinancialTCFBOKWebster dValleyUmpquaFirst 7.23%6.55%6.20%6.19%4.89%4.06%4.00%16
2017 YEAR END EARNINGS in millions2016A2017AActual% Incr.Net interest income 680 5)25%(124)(111)-11%Non-interest incomeTotal revenueSecurities gains/(losses)Non-interest expenseProvision for loan lossesPretax income401Income taxesNet income277Non-controlling int. exp.(1)Net inc attrib. to CommerceLess preferred stock div.Net inc avail. to commonstockDiluted EPS431 7%32016%(1)NM27531916%(9)(9)0%26631017%2.8916%2.49 ROA2016: 1.12%2017: 1.28%ROACE2016: 11.33%2017: 12.46%Efficiency Ratio2016: 61.04%2017: 62.18%Cash Dividends2016: 0.8162017: 0.857Ending Stock Price2016: 55.062017: 55.8417
FINANCIAL HIGHLIGHTS QTDMARCH 31, 2018 millions (except EPS)Net Income attrib to Commerce1Q20171Q2018 % change 72 10140.3%1.15%1.66%44.3%11.74%15.58%32.7%Efficiency Ratio62.19%58.21%-6.4%Average Loans 13,537 13,9292.9%Average Deposits 21,023 20,161-4.1% 0.65 0.9241.5%Return on Average AssetsReturn on Average Common EquityDiluted EPS**Per shares figures have been restated for 5% stock dividend distributed in December 201718
COMMERCE BANK MAINTAINS SOLID PERFORMANCEOVER TIME Commerce BankPeer BanksLarge BanksROA 10-yr averageCBSH: 1.18% Peers: 0.63%Return on 32014201520162017ROACE 10-yr averageCBSH: 11.57% Peers: 5.53%Return on Average Common eer Banks include: ASB, BKU, BOKF, CFR, FHN, FNB, FULT, HBHC, IBKC, ISBC, MBFI, PB, SNV, TCF, UMBF,UMPQ, VLY, WBS, WTFC; Large Banks include: JPM, BAC, C, WFC USB, PNC, FITH, RFSource: S&P Global Market Intelligence; data as of 12/31/2017; CBI numbers via internal reporting2013201420152016201719
LONG TERM VIEW: NET INCOME AND EARNINGS PER SHARENet Income 3.00 000sNet Income300 2.50250200 2.00150 1.5010050Dividendsper share2008200920102011201220132014201520162017 0.61 0.62 0.64 0.65 0.69* 0.71 0.74 0.78 0.82 0.86 1.00Earnings per ShareEarnings Per Share 350EPS REMAINS STRONG49TH CONSECUTIVE YEAR OF DIVIDEND GROWTH*Including 2012 special dividend 1.806All data has been restated for 5% stock dividend distributed in December 2017Net Income in the chart represents Net Income Available to Common ShareholdersSource: Corporate Finance20
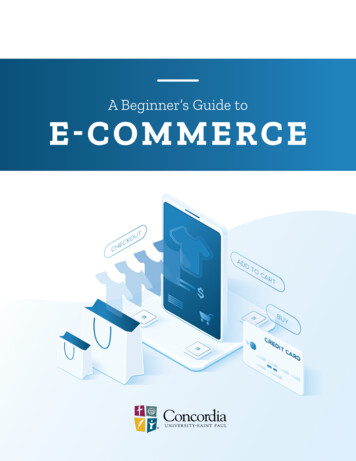
STEADY SHAREHOLDER RETURNSas of December 31, 2017Total Shareholder ReturnsAnnualized ComparisonTotal Shareholder ReturnsIndexed, 12/31/2007 100 300 250 200COMMERCEBANKNASDAQBANK INDEXPercent25%KBW BANKINDEX20%S&P10%5% 1000% 5020072009NASDAQ BanksKBW Bank Index15% 150 0CBSHS&P 50020112013201520171 Year3.03%21.82%5.46%18.59%3 Year16.19%11.39%16.53%15.24%5 Year17.43%15.77%18.66%18.18%10 Year10.06%8.49%6.48%4.13%Consistent, positive returns to shareholdersSignificant outperformance relative to banks over long periodSource: Corporate Finance, Bloomberg; data as of 12/31/201721
NOTICE: Due to technical difficulties, the recorded audio file for the Annual Shareholder meeting is of low quality.However, if you are interested in listening to the recorded message, you can access the recording by clicking on the linkprovided below.2018 Shareholder Meeting Webcast Audio
(in thousands) Mobile Online Branch 10 2016: 2017: App Store Rating 2016: 19,157 25,500 Digital Loan Sales(000s) Continue Expanding Digital Capabilities Mobile Penetration 2016: 49.4% 2017: 54.7% Deposit Use 2016: 3.3% 2017: 7.6% as of 1/17/18 Period end balances, Information as of Decemb