Transcription
1Title: Money Buys Happiness When Spending Fits Our PersonalityKeywords: happiness, consumption, self-congruity, psychological fit, Big Five personality
2Abstract:In contrast to decades of research reporting surprisingly weak relationships between consumption and happiness, recent studies suggest that money can indeed increase happiness if it isspent the “right way” (e.g. on experiences or on others). Drawing on the concept of psychological fit, we extend this research by arguing that individual differences play a central role indetermining the “right” type of spending to increase wellbeing. In a field study with over76,000 bank transaction records we find that individuals spend more on products which matchtheir personality and that those whose purchases match their personality report higher levels oflife satisfaction. This effect of psychological fit on happiness was stronger than the effect ofindividual’s total income or their total spending. A follow-up experiment showed a causal effect: Personality-matched spending increases positive affect. In summary, when spendingmatches personality, it appears that money can indeed buy happiness.
3Above a low baseline, money is reported to have a surprisingly weak relationship with overallwellbeing (Ed Diener & Biswas-Diener, 2002; Kahneman & Deaton, 2010). However, recentstudies have questioned this conclusion, arguing that if money does not buy happiness, it isbecause we are not spending it “right” (Dunn, Gilbert, & Wilson, 2011). These studies suggestthat spending can indeed lead to greater well-being if it is directed at experiences rather thanmaterial goods (Carter & Gilovich, 2010; Howell & Hill, 2009; Van Boven & Gilovich, 2003),buying for others as opposed to ourselves (Dunn, Aknin, & Norton, 2013), and obtaining manysmall pleasures as opposed to a few large ones (Nelson & Meyvis, 2008).However, recent research suggests that these relationships do not hold universally, as individual differences moderate at least some of them (Hill & Howell, 2014; Millar & Thomas, 2009;Zhang, Howell, Caprariello, & Guevarra, 2014). For example, while experiential purchasesconsistently result in greater happiness for experiential buyers, the effect is smaller or nonexistent for material buyers (Zhang et al., 2014). Similarly, spending more on others does notincrease happiness for those whose values do not emphasize a concern for others (Hill &Howell, 2014). These findings highlight the need to understand the effect of spending on happiness at the individual rather than the group level.As the focus shifts away from identifying types of spending that increase people’s happinessand toward finding types of spending that help increase an individual’s happiness, psychological theory offers a valuable point of reference. Years of research show that people’s preferences across a large variety of domains are driven by a relatively stable set of psychologicalcharacteristics: their personality (Ozer & Benet-Martínez, 2006). The Big Five model of personality is the most widely accepted personality model (Goldberg, 1992; McCrae & John,1992). It posits the five personality traits of openness to experience (artistic vs. conservative),conscientiousness (self-controlled vs. easy-going), extraversion (outgoing vs. reserved), agreeableness (compassionate vs. antagonistic), and neuroticism (emotionally unstable vs. stable).Individuals have consistently been found to favor people and environments which match theirpersonality traits, with those who experience psychological fit also reporting higher levels ofwell-being and overall life satisfaction (Assouline & Meir, 1987; Carli, Ganley, & Piercy-Otay,1991; Jokela, Bleidorn, Lamb, Gosling, & Rentfrow, 2015). This is because psychological fithelps individuals to act in line with their most fundamental needs and preferences as well as toexpress themselves in a way which maintains and enhances their self-concepts (Grubb &Grathwohl, 1967; Lecky, 1945; Levy, 1959). Surrounding oneself with like-minded artists or
4living in a culturally “hip” area full of bars and art galleries, for example, helps an artisticperson to act upon her preferences and to reinforce her self-concept of being a ‘creative andopen-minded individual’.Consumer psychology and marketing research suggests that the theory of psychological fit canalso be applied to consumption, as spending on products and services constitutes a form of selfexpression. While some spending is essential to fulfill basic needs such as food and shelter,discretionary spending beyond this baseline often reflects who we are as individuals. We buyproducts not only for what they can do but also for what they mean to us (Levy, 1959). Partsof this symbolic meaning are captured by psychological traits: Consumers associate and imbueproducts and brands with human personality characteristics (Aaker, 1997; Govers &Schoormans, 2005; Huang, Mitchell, & Rosenaum-Elliott, 2012). For example, people perceive the Wall Street Journal as competent while they associate MTV with excitement (Aaker,1997). Building on the notion of product and brand personality, numerous laboratory studieshave shown that consumers indeed report more favorable attitudes, emotions, and behaviorstowards brands and products which match their own personality characteristics (Aaker, 1999;Govers & Schoormans, 2005; Sirgy, 1985). For example, an extrovert may prefer spendingwhich reinforces her preference for social activities (e.g. eating out with friends). As extroverts’momentary happiness is known to increase when they are engaged in activities with others(Oerlemans & Bakker, 2014) such spending may also help regulate their immediate emotionalstates and long-term well-beingIn this paper, we propose that spending provides the greatest increase in happiness and wellbeing when it is on goods and services which match consumers’ personality. We test this proposition in two studies: Study 1 uses transaction data from 625 UK customers of a multinationalbank to test whether consumers spend more money on products which match their personality(Hypothesis 1) and whether those consumers whose purchases better fit their personalities report higher levels of life satisfaction (Hypothesis 2). Study 2 tests the implied causality ofHypothesis 2 in a controlled experiment (N 79) in which individuals were given vouchers tospend on products that either matched or mismatched their personality.
5Study 1MethodsParticipants and measures.The dataset used in Study 1 was collected in collaboration with a UK-based multinational bankin late 2014. Customers of the bank were sent a survey link by email asking them to take partin a study (N 150,000). No incentives were offered for taking part in the survey. The surveyincluded the BFI-10 personality questionnaire, which is an established short measure of theBig Five Model of personality (Rammstedt & John, 2007), as well as the Satisfaction with LifeScale (Diener, Emmons, Larsen, & Griffin, 1985). As part of the survey, customers were askedto consent to their responses being matched with the personal transaction data held by the bankfor research purposes. The records encompassed detailed transaction data of all transactionsgoing out of customers’ checking accounts over a period of six months. Individuals’ purchaseswere automatically grouped by the bank into 112 categories. We excluded categories that didnot allow for a meaningful interpretation (e.g. “unallocated” or “services other”) or had fewerthan 500 transactions in order to reduce the sparsity of the transaction matrix and increase thereliability of results. Using the cut-off of 500 allowed us to reduce the number of categories toa manageable level so that they could be rated on their perceived psychological traits, while atthe same time retaining a sufficient level of product diversity. We further merged closely related categories (e.g. “medical charities,” “children’s charities,” and “charities other” became“charities”)*, resulting in a total of 59 spending categories. Of the 1,013 people who completedthe study, 912 (90%) agreed to have their survey responses matched with their account records(51% female; 𝑥 (age) 37.2 years, SD 14.5). For reasons of reliability, we only includedparticipants (i) who had completed the full BFI-10 and SWL scale, (ii) for whom informationon income, total spending, age, and gender was available, (iii) who had indicated that the account was their main account, and (iiii) who had transactions for at least 10 of the 59 transactioncategories. This left us with 625 participants and 76,863 transactions (63% of original transactions).Rating personality traits of spending categories.We recruited 100 workers on Amazon’s Mechanical Turk to rate the spending categories according to the Big Five personality dimensions. Using the Ten-item Personality Inventory*Supplementary material A replicates the analyses of Studies1 and 2 with discretionary spending only. Sincethere are no significant differences between models, we report the results from the full dataset.
6(TIPI; Gosling et al., 2003), we created a seven-point scale for each personality trait e.g. from“quiet/reserved” (-3) to “extraverted/outgoing” (3). For each participant, 30 categories wererandomly selected from the pool of 59 categories. Participants received the following instructions: “On the following pages we are going to show you a number of categories that peoplecan spend their money on (e.g. travel or entertainment). We would like you to think of eachcategory as if it were a person. This may sound unusual, but think of the set of human characteristics associated with each spending category. We’re interested in finding out which personality traits or human characteristics come to your mind when you think of a particular spendingcategory. There are no wrong or right answers” (adapted from Aaker, 1997). Participants’ responses were subsequently prompted by the question “If this 'spending category' was a person,how would it best be described?” Personality scores for each of the spending categories wereaggregated across respondents, with scores larger than zero indicating products that were perceived to have high trait characteristics and scores lower than zero indicating products thatwere perceived to have low trait characteristics. For example, the average extraversion scorefor the category “books” was 𝑥 𝐸 0.82, suggesting that people perceive books to be introverted. Table 1 displays the personality means for each of the 59 spending categories.Table 1. Personality means of the 59 spending categories rated on Amazon Mechanical ts' 1.94-1.59Advertising services1.980.702.04-0.040.34Gift shops0.830.940.551.74-0.94Airports & duty free-0.500.960.34-0.18-0.02Hair & beauty1.910.311.490.850.22Arts & craftsBakers & 781.73-0.610.04-1.221.451.590.861.41-0.80Health & Health insurance-1.611.52-1.11-0.16-0.50Cable & satellite TV0.480.001.29-0.170.14Home furnishing0.631.480.171.38-1.22Car hire-0.531.39-0.060.31-0.96Home insurance-2.052.40-1.460.33-1.48Caravans & campingCatalogue & 331.650.33-0.13Clothes0.830.440.960.89-0.44Life assuranceMobile telephoneMotor sports1.340.092.32-0.550.82Coffee shopsComputers & technologyConfectioners & tobacconistsDays out & 0.33
7Dental care-1.251.79-0.590.32-0.59Department oe shopsDigital1.551.050.770.02-0.45Discount stores-0.17-0.420.320.28DIY2.221.371.20Eating out – pubsEating out – restaurantsElectronic commerce& s & Traffic fines-2.250.91-0.58-2.331.34Family .33-0.39Foreign travel2.540.652.150.85-0.11TV licenseUnions & 082.33-1.811.98Note. Intraclass Correlation Coefficients (ICCs) were calculated as a measure of interrater agreement.ICCS ranged from .82 to .98 indicating high interrater agreement across all categories. Scores are on a 7point scale from -3 to 3.ResultsHypothesis 1To test whether consumers spend more money on products that match their personality (Hypothesis 1), we first aggregated the transaction data across the six months to calculate eachindividual’s total spending on each spending category (e.g. the total amount a participant spenton books). In a second step, we z-standardized the raw personality scores of participants andproducts to calculate the relative position of each person and product on all of the Big Fivepersonality traits. An extroversion score of z 1, for example, indicates that the person orproduct is one standard deviation above the average person and product extroversion score (seeFigure S1 and S2 for the distributions of scores). Finally, we calculated the degree of similaritybetween the z-standardized personality scores of a consumer i and that of a spending categorys (product person match) using Euclidean distance, a commonly used measure of similarity(Deza & Deza, 2009). To facilitate the interpretation of results, we subtracted the score fromthe mean so that higher scores on the matching variable would indicate a better match:𝑝𝑟𝑜𝑑𝑢𝑐𝑡 𝑝𝑒𝑟𝑠𝑜𝑛 𝑚𝑎𝑡𝑐ℎ7,9 mean 𝑧(𝑂𝑝7 ) 𝑧(𝑂𝑝9 )B 𝑧(𝑁𝑒7 ) 𝑧(𝑁𝑒9 )BGiven that there were multiple observations per participant, we used hierarchical linear modeling analysis with random intercepts (HLM, Raudenbusch & Bryk, 2002) to establish the effect of product-person match on the amount spent. To test the robustness of the effect we alsoincluded control variables that have previously been shown to predict financial behavior and
8well-being (DeNeve & Cooper, 1998; Ed Diener & Biswas-Diener, 2002): age, gender, income,overall spending (Model 1) as well as participants’ and products’ Big Five personality traits(Model 2). All continuous variables were grand-mean centered before being submitted to theanalysis. Table S1 displays the zero-order correlations between predictors.The results reported in Table 2 show that the match between a participant’s personality andthat of the spending category was a significant predictor of the amount spent. This indicatesthat on average people spent more money on products which matched their personalities. Forexample, a person with an extraversion score in the 84th percentile ( 1SD) spent approximately 52 ( 77) more each year on “pub nights” than a person with an extraversion score in the 16thpercentile (-1SD). Similarly, a person with a conscientiousness score in the 84th percentile spent 124 ( 183) more annually on “health and fitness” than a person with a conscientiousness scorein the 16th percentile. The effect remained significant, even when controlling for demographicvariables (Model 1), and consumers’ as well as product personality (Model 2).Table 2. Hierarchical linear models with logged amount as outcome. The analyses are based on 11,279 observations from 625 participants. b unstandardized coefficients. Pseudo-R² are calculated as the correlation of fitted vs. observed values). * p .05, ** p .01, *** p .001.Model 1Model .07 – .126.75.03*.01 – .062.40.05-.02 –.101.62.04-.02 – .101.44.33***.27 – .4010.96.32***.26 – .3810.91.06-.003 – .121.84.02-.04 – .090.75.01***003 – .014.50.004***.002 – .013.51Person-O.01-.02 –.03.49Person-C.02-.01 – .041.05Person-E-.02-.05 – .01-1.46Person-A-.02-.05 – .01-1.30Person-N-.02-.05 – .01-1.08Product-O-.58***-.62 – -.54-21.96Product-C.16***.11 – .226.50Product-E.91***.85 – .9825.52Product-A-.37***-.44 – -.31-11.42Product-N-.53***-.63 – -.43-11.16Income (log)Total spend (log)GenderAgePseudo-R2.06.14
9Hypothesis 2To test whether consumers with a better fit between their personalities and their overall purchases reported higher levels of life satisfaction (Hypothesis 2), we calculated the personalityprofile of a consumer’s shopping basket by averaging and standardizing the personality scoresof all the spending categories for which the participant had made at least one purchase. Basedon research showing that many small purchases can result in greater happiness than a few largeones (Dunn, Gilbert, & Wilson, 2011), we assigned an equal weight to all spending categoriesrather than weighting them by the amount spent. The personality of consumers’ shopping baskets therefore reflects the average personality profile of their overall spending, relative to thatof the other people in our sample. For example, if a consumer has purchased more productsperceived to be extroverted than the average person (e.g. pubs or motor sports) and/or purchased less products perceived to be introverted than the average person (e.g. gardening orhealth insurance), then their shopping basket personality will be extroverted. Similar to theproduct-person match we subsequently used Euclidean distance (Deza & Deza, 2009) to establish the degree of similarity between the personality of a consumer i and that of her shoppingbasket b (basket person match) and subtracted the score from the mean:𝑏𝑎𝑠𝑘𝑒𝑡 𝑝𝑒𝑟𝑠𝑜𝑛 𝑚𝑎𝑡𝑐ℎ7,L mean 𝑧(𝑂𝑝7 ) 𝑧(𝑂𝑝L )B 𝑧(𝑁𝑒7 ) 𝑧(𝑁𝑒L )BIn three multiple linear regression analyses, we regressed life satisfaction on the basket–personmatch predictor. Consistent with the previous analysis we included age, gender, income, overall spending (Model 1) and participants’ as well as products Big Five personality traits as controls (Model 2). We added the extremity of participants’ personality scores (average of absoluteBig Five scores) in Model 2 to control for the possibility that people with more extreme – andthus less normative – personalities might report lower levels of life satisfaction. Table S2 displays the zero-order correlations between predictors.As hypothesized, the degree of fit between a participant’s personality and that of her shoppingbasket was found to be a significant predictor of life satisfaction (see Table 3). Consumers whobought products which matched their personality reported higher satisfaction with their lives,and this effect was stronger than that of total income or total spend. When adding basket personality to the model the effect of basket-person match became marginal at an alpha level of α .05 (p .062)†. This change in significance results from a slightly larger standard error of the†When analyzing discretionary spending only, the effect of Basket-Person match remained significant in Model2 (see table S7 in Supplementary Material B).
10coefficient estimate (see confidence intervals) which might have been caused by the multicollinearity of the additional predictors. While a person’s extroversion and neuroticism level werefound to be significant predictors of life satisfaction none of the basket personality main effectsreached significance. This indicates that there are no general purchase characteristics that predict a person’s level of life satisfaction.Table 3. Multiple linear regression analyses of life satisfaction on “basket–person match” (BP-match) and controls (624 observations). * p .05, ** p .01, *** p .001.Model 1Model 03 – .122.07.06-.003 – .131.87Income (log).02-.11 – .15.35.04-.08 – .17.70Total spend (log).06-.07 – .20.96.02-.11 – .15.26Gender.03-.11 – .17.37-.02-.17 – .13-.26-.01*-.01 – .0002-2.07-.01*-.01 – .002-2.53Person-O.04-.02 – .101.28Person-C -.001-.07 – .07-.01Person-E.09*.02 – .162.39Person-A.01-.06 – .07.18Person-N-.23***-.30 – -.15-6.11Extremity.06-.17 – .28.51Product-O-.12-.25 – .02-1.72Product-C.08-.04 – .201.26Product-E.16-.01 – .331.82Product-A.10-.05 – .251.36.05-.17 – .26.42AgeProduct-NAdjusted R2.01.11Study 2Given the correlational nature of the data in Study 1, it is difficult to make causal claims. Although it seems intuitive that spending more money on products that match our personalityresults in higher life satisfaction, higher life satisfaction could also result in people recognizingand acting on their needs more successfully. Focusing on the trait of extraversion, which isconsidered to be more informative in understanding and predicting individual’s behaviour thanother traits (Williams, Munick, Saiz, & FormyDuval, 1995), we ran a follow-up experiment totest our causal hypothesis.
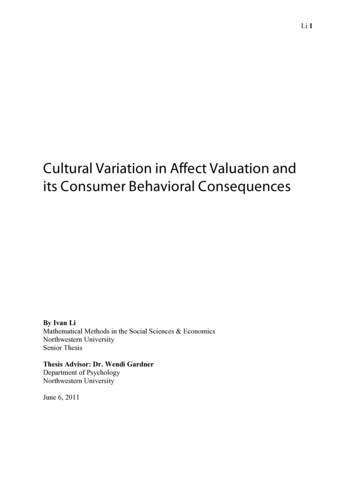
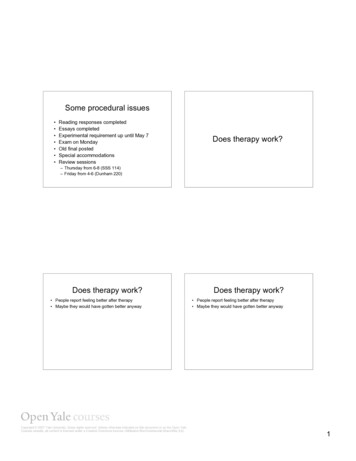
11MethodsParticipants.We used the “pwr package” in R (Champley, 2015) to establish the required sample size forgeneral linear models with the following parameter specifications: degrees of freedom in numerator u 3, significance level α 0.05, power (1-β) 0.8 and effect size f2 0.15(corresponding to a medium effect size as defined by Cohen, 1988). The recommended samplesize was N 76. Participants were recruited via university mailing lists. Students who registered their interest were invited to complete a pre-screening test which included the 50-itemIPIP (Goldberg, 1992). From the 142 respondents, we invited the top and bottom thirds on theextraversion trait to take part in the main study. The difference in extraversion level for the 79participants (N introverted group 43, N extraverted group 36) was z 1.90 SD (t(76) 17.12, p .001). The average age was 𝑥 20.65, and 68% of participants were female.Measures and procedure.We randomly allocated 7 (approximately 10 USD) vouchers for either a bookshop (introverted proxy) or a bar (extraverted proxy) to groups of introverted and extraverted participants.Participants were unaware of the different conditions: The initial invitation to participate in thestudy only mentioned a “non-monetary compensation in the form of a voucher” and participants were asked to not discuss the study with anyone. All participants underwent the followingprocedure (see Figure 1 for visual illustration): Before receiving any information about thestudy they were asked to complete a baseline questionnaire (T1) that measured the PANASscale to which the additional adjective of “happy” was added (Watson, Clark, & Tellegen,1988; see Dunn et al., 2013 for a similar approach). They subsequently received a voucher witha requirement to spend it within the next two days. The only restriction given to participantswas that those in the book condition needed to spend their voucher on a book, and participantsin the bar condition, on an item which could be consumed in the bar. Immediately after receiving the voucher, participants were asked to complete the second questionnaire (T2) with thesame PANAS items (example of instruction: “You should have just received a voucher for theUnion bar. Please complete the following questionnaire in light of this experience.”). Aftercompleting the second questionnaire they were told that there would be two more questionnaires to complete: The third (T3) after they had cashed the voucher (on the spot at the bar orbookshop, where staff members had been briefed to hand out questionnaires) and the fourth(T4) after spending at least 30 minutes at the bar or reading the book. Both questionnairesincluded the same PANAS items as in the previous questionnaires (example of instructions at
12T3: “You should have just cashed your voucher. Please complete the following questionnairein light of this experience.” And at T4: “You should have spent some time at the bar/readingthe book. Please complete the following questionnaire in light of this experience.”). Participants who completed all four questionnaires were paid 5 ( 7.50). All 79 participants completed questionnaires T1 and T2, 75 completed T3 and 74 completed T4 (notably, all drop-outswere from mismatching conditions).Fig 1. Experimental procedure from the participant’s perspective.ResultsThe raw means and standard deviations of the four assessment points across conditions areshown in Table S3. As we were interested in the overall effect of personality-matched spending, we averaged participants’ scores across T2, T3 and T4 to form a composite happinessmeasure (“Happiness overall”, see Table S4 and Figure S5 in supplementary Material for individual results across the three time points). We submitted “Happiness overall” to a linear regression model with participants personality (extraverted vs. introverted) and product personality (extraverted vs. introverted) and their two-way interaction as predictors as well as thehappiness score at T1 as covariate. The analysis revealed significant main effects of participantand product personality as well as a significant interaction effect between participant and product personality (see Table 4), indicating that personality-matched consumption indeed resultsin higher levels of happiness.Table 4. Multiple linear regression of ‘Happiness overall’ on participant and product personality, their interaction, as well as T1 as covariate. N 79.Participant Personalityb𝐶𝐼HIt-8.26*-14.76 – -1.76-2.53
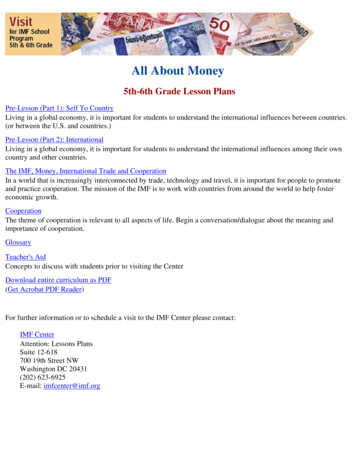
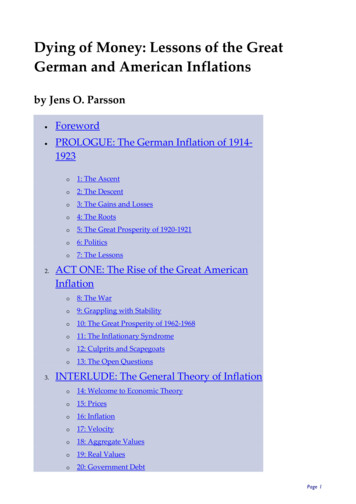
13Product Personality-11.13***-17.49 – -4.77-3.49Participant Personality Product personality5.89**1.79 – 9.962.86Happiness T1.82***.68 – .9512.19Figure 2 displays the results for matching vs. mismatching conditions in comparison to thebaseline T1. While participants’ happiness in the matching conditions was significantly abovethe baseline across all happiness indicators, it remained mostly stable and even decreased inone of the mismatching conditions. This finding suggests that mismatched spending may notonly fail to improve people’s well-being but could even be detrimental to it. The harmful effectof ‘misfit’ is in line with previous research in occupational psychology, which shows that working in an environment with poor psychological fit leads to lower levels of job satisfaction andhigher levels of mental stress (Furnham & Schaeffer, 1984; Caplan & Harrison, 1993). Theeffects of psychological fit were found to be more pronounced for introverted participants. Apossible explanation for this finding is that extroverted people are more positive and optimisticin general (Costa & McCrae, 1980; Marshall, Wortman, Kusulas, Hervig, & Vickers, 1992),which in turn might lead them to consider themselves satisfied with most of the purchases theymake. The significant main effects of product personality (overall preference for the bookvoucher) and participant personality (higher happiness ratings for introverted participants) canlargely be explained by the two aforementioned interaction patterns: The main effect of productpersonality is a result of the fact that introverts show a strong preference for the book voucherwhereas extroverts show no preference for any of the products. Similarly, the main effect ofparticipant personality stems from introverts’ happiness increase in the matching condition being larger than their decrease in happiness in the mismatching condition.
14Fig 2. Interaction effect of participant and product personality on changes in overall positiveaffect(‘Happiness overall’ – ‘Happiness T1’). The change in positive affect is displayed instandard deviations of the baseline assessment (T1) and indicates changes in positive affectfrom the baseline (dashed grey line). Error bars are standard errors of the mean.DiscussionIn line with previous research on the link between psychological fit and well-being (Assouline& Meir, 1987; Carli et al., 1991; Jokela et al., 2015) our results show that individuals’ happinesscan be increased through the consumption of products which match their psychological characteristics. People spend more money on products that match their personality (Hypothesis 1).Assuming that people intend to buy products that increase their happiness, this finding providesa first indication that personality-matched purchases are related to greater satisfaction. However, since research shows that people often fail to predict the affective outcomes of their consumption decisions accurately (Wilson & Gilbert, 2005), we further support this hypothesis byshowing that people whose purchases better fit their personality indeed report higher levels oflife satisfaction (Hypothesis 2). The results of the experimental study suggest that this effect iscausal: Personality-matched spending increases happiness. In order to confirm that this effectis indeed driven by psychological fit rather than potentially confounding attributes of the twospecific purchases (book and bar), future research should replicate our findings using differentproducts.
15Our findings contribute to the academic discourse and existing psychological literature in twoways. First, they support recent studies showing that money can indeed increase happiness if itis spent “right”. However, by focusing on an individual’s rather than everybody’s happiness,our approach provides the opportunity to better understand the underlying mechanisms of whenand why spending leads to increased happiness. For example, while previous research suggeststhat spending money on experiences results in greater happiness (Carter & Gilovich, 2010; VanBoven & Gilovich, 2003), the results of our experimental study suggest a more nuanced picture. Introverted participants reported higher levels of happiness when they received the material good (book) rather than the exper
This effect of psychological fit on happiness was stronger than the effect of individual's total income or their total spending. A follow-up experiment showed a causal ef-fect: Personality-matched spending increases positive affect. In summary, when spending matches personality, it appears that money can indeed buy happiness.