Transcription
CHAPTER 8: Hypothesis TestingIn this chapter we will learn . To use an inferential method called a hypothesis test To analyze evidence that data provide To make decisions based on dataMajor Methods for Making Statistical Inferences about aPopulation The traditional Method The p-value Method Confidence IntervalCH8: Hypothesis TestingSantorico - Page 269
Section 8-1: Steps in Hypothesis Testing – Traditional MethodThe main goal in many research studies is to check whether thedata collected support certain statements or predictions.Statistical Hypothesis – a conjecture about a populationparameter. This conjecture may or may not be true.Example: The mean income for a resident of Denver is equal tothe mean income for a resident of Seattle. Population parameter is mean income One population consists of residents of Denver while theother consists of residents of Seattle.CH8: Hypothesis TestingSantorico - Page 270
There are two types of statistical hypotheses:Null Hypothesis (H0) – a statistical hypothesis that states thatthere is no difference between a parameter and a specific value,or that there is no difference between two parameters.Alternative Hypothesis (H1) – a statistical hypothesis thatstates the existence of a difference between a parameter and aspecific value, or states that there is a difference between twoparameters.Can you formulate a null and alternative hypothesis for the incomeexample?CH8: Hypothesis TestingSantorico - Page 271
We tend to want to reject the null hypothesis so we assume it istrue and look for enough evidence to conclude it is incorrect.We tend to want to accept the alternative hypothesis. If the nullhypothesis is rejected then we must accept that the alternativehypothesis is true.Note: H0 will ALWAYS have an equal sign (and possibly a lessthan or greater than symbol, depending on the alternativehypothesis). The alternative hypothesis has a range of valuesthat are alternatives to the one in H0.The null and alternative hypotheses are stated together. Thefollowing are typical hypothesis for means, where k is a specified number.CH8: Hypothesis TestingSantorico - Page 272
kNote: Right-tailed and left-tailed tests are distinguished by theway the greater than or less than points. It is the direction whereare alterative places the true mean.CH8: Hypothesis TestingSantorico - Page 273
Examples: State the H0 and H1 for each case.A researcher thinks that if expectant mothers use vitamins, thebirth weight of the babies will increase. The average birth weight of the populationis 8.6 pounds.H0: 8.6H1: 8.6An engineer hypothesizes that the mean number of defects canbe decreased in a manufacturing process of compact disks byusing robots instead of humans for certain tasks. The meannumber of defective disks per 1000 is 18.H0 :CH8: Hypothesis TestingH1 : Santorico - Page 274
A psychologist feels that playing soft music during a test willchange the results of the test. The psychologist is not surewhether the grades will be higher or lower. In the past, themean of the scores was 73.H0 :H1 : When a researcherconducts a study, he or she is generallylooking for evidence to support a claim of some type ofdifference. In this case, the claim should be stated as thealternative hypothesis. Because of this, the alternativehypothesis is sometimes called the research hypothesis.CH8: Hypothesis TestingSantorico - Page 275
Keywords help to indicate what the null and/or alternativehypotheses should be.CH8: Hypothesis TestingSantorico - Page 276
After stating the hypotheses, the researcher designs the study. Select the correct statistical test Choose an appropriate level of significance Formulate a plan for conducting the studyStatistical Test – uses the data obtained from a sample to makea decision about whether the null hypothesis should be rejected.Test Value (test statistic) – the numerical value obtained from astatistical test.**Each statistical test that we will look at will have a different formula for calculating the test value.In reality, the null hypothesis may or may not be true, and a decision is made to reject or not reject it on the basis of the data obtained from a sample. Beloware the four possible outcomes.CH8: Hypothesis TestingSantorico - Page 277
When we make a conclusion from a statistical test there aretwo types of errors that we could make. They are called:Type I and Type II ErrorsType I error – reject H0 when H0 is true.Type II error – do not reject H0 when H0 is false.Results of a statistical test:Reject H0Do not Reject H0H0 is TrueType IErrorCorrect DecisionH0 is FalseCorrectDecisionType IIError CH8: Hypothesis TestingSantorico - Page 278
Example: Decision Errors in a Legal Trial . What are H0 and H1 ? H0: Defendant is innocent.H1: Defendant is not innocent, i.e., guiltyCH8: Hypothesis TestingSantorico - Page 279
If you are the defendant, which is the worse error? Why? The decision of the jury does not prove that the defendantdid or did not commit the crime. The decision is based on the evidence presented. If the evidence is strong enough the defendant will beconvicted in most cases, if it is weak the defendant will beacquitted. So the decision to reject the null hypothesis does not proveanything. The question is how large of a difference is enoughto say we have enough evidence to reject the nullhypothesis?CH8: Hypothesis TestingSantorico - Page 280
Significance level - is the maximum probability of committing aType I error. This probability is symbolized by .P(Type I error H0 is true) Critical or Rejection Region – the range of values for the testvalue that indicate a significant difference and that the nullhypothesis should be rejected.Non-critical or Non-rejection Region – the range of values forthe test value that indicates that the difference was probably dueto chance and that the null hypothesis should not be rejected.CH8: Hypothesis TestingSantorico - Page 281
Critical Value (CV) – separates the critical region from thenon-critical region, i.e., when we should reject H0 fromwhen we should not reject H0. The location of the critical value depends on theinequality sign of the alternative hypothesis. Depending on the distribution of the test value, youwill use different tables to find the critical value.CH8: Hypothesis TestingSantorico - Page 282
One-tailed test – indicates that the nullhypothesis should be rejected when thetest value is in the critical region on oneside. Left-tailed test – when thecritical region is on the left sideof the distribution of the testvalue. Right-tailed test – when thecritical region is on the right sideof the distribution of the testvalue.Two-tailed test – the null hypothesisshould be rejected when the test value isin either of two critical regions on eitherside of the distribution of the test value.CH8: Hypothesis TestingSantorico - Page 283
To obtain the critical value, the researcher must choose thesignificance level, , and know the distribution of the test value. The distribution of the test value indicates the shape of thedistributioncurve for the test value. This will have a shape that we know (like the standard normal or t distribution). Let’s assume that the test value has a standard normaldistribution. We should use Table E (the standard normal table) or TableF (using the bottom row of the t distribution, which isequivalent to a standard normal distribution) to find thecritical value.CH8: Hypothesis TestingSantorico - Page 284
Finding the Critical Values for Specific α Values, Using TableEStep 1: Draw a figure for the distribution of the test values andindicate the appropriate area for the rejection region. If the test is left-tailed, the critical region, with area equal toα, will be on the left side of the distribution curve. If the test is right-tailed, the critical region, with area equalto α, will be on the right side of the distribution curve. If the test is two-tailed, α must be divided by 2; the criticalregions will be in each end of the distribution curve - halfthe area in the left part of the distribution and half of thearea in the right part of the distribution.CH8: Hypothesis TestingSantorico - Page 285
Step 2: For a left-tailed test, use the z value that corresponds to thearea equivalent to in Table E, i.e., z1 , the percentile ofthe distribution. For a right-tailed test, use the z value that corresponds tothe area equivalentto 1 in Table E, i.e., z , the 1 percentile of the distribution. For a two-tailed test, use the z value that corresponds to /2 for the leftnegative.Change the lower CV. It will be critical value for thesign to positive and you will get theright side. CH8: Hypothesis TestingSantorico - Page 286
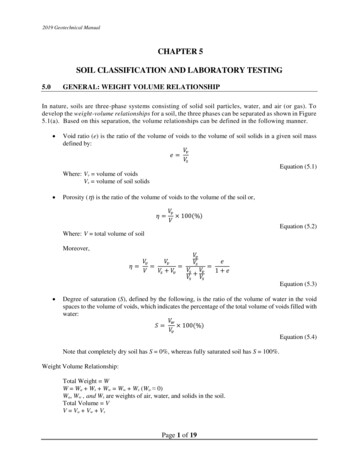
Example: Find the critical value(s) for each situation and draw theappropriate figure, showing the critical region.Left-tailed test with α 0.0050.00.1P(Z)0.0050.20.30.4Looking up 0.005 in the Z tableWe have Z -2.575.-4-2024Z0.20.00.1P(Z)0.30.4Right-tailed test with α 0.01-4-2024ZCH8: Hypothesis TestingSantorico - Page 287
0.20.00.1P(Z)0.30.4Two-tailed test with α 0.1-4-2024Z0.20.00.1P(Z)0.30.4Left-tailed test with α 0.2-4-2024ZCH8: Hypothesis TestingSantorico - Page 288
0.20.00.1P(Z)0.30.4Right-tailed test with α 0.15-4-2024Z0.20.00.1P(Z)0.30.4Two-tailed test with α 0.09-4-2024ZCH8: Hypothesis TestingSantorico - Page 289
Hypothesis Test Procedure (Traditional Method)Step 1 State the hypotheses and identify the claim.Step 2 Find the critical value(s) from the appropriate table.Step 3 Compute the test value.Step 4 Make the decision to reject or not reject the nullhypothesis.Step 5 Summarize the results.CH8: Hypothesis TestingSantorico - Page 290
Section 8-2: z Test for a MeanMOTIVATING SCENARIO: It has been reported that theaverage credit card debt for college seniors is 3262.The student senate at a large university feels that theirseniors have a debt much less than this, so it conducts astudy of 50 randomly selected seniors and finds that theaverage debt is 2995, and the population standarddeviation is 1100.Can we support the student senate’s claim usingthe data collected?CH8: Hypothesis TestingSantorico - Page 291
How .the z Test for a MeanA statistical test uses the data obtained from a sample to make adecision about whether the null hypothesis should be rejected.The numerical value obtained from a statistical test is called thetest value.You will notice that our statistical tests will resemble the generalformula for a z-score:Test Value observed value – expected valuestandard errorCH8: Hypothesis TestingSantorico - Page 292
The z test for MeansThe z test is a statistical test for the mean of a population. It canbe used when n 30, or when the population is normallydistributed and σ is known.The formula for the z-test is:z X , wherenX n We use our standard normal distribution our z table! CH8: Hypothesis TestingSantorico - Page 293
Hypothesis Test Procedure (Traditional Method)Step 1 State the hypotheses and identify the claim.Step 2 Find the critical value(s) from the appropriate table.Step 3 Compute the test value.Step 4 Make the decision to reject or not reject the nullhypothesis.Step 5 Summarize the results.CH8: Hypothesis TestingSantorico - Page 294
Example: It has been reported that the average credit card debtfor college seniors is 3262. The student senate at a largeuniversity feels that their seniors have a debt much less thanthis, so it conducts a study of 50 randomly selected seniors andfinds that the average debt is 2995, and the populationstandard deviation is 1100. Let’s conduct the test based on aType I error of 0.05.Step 1 State the hypotheses and identify the claim.H0: 3262H1: 3262CLAIMCH8: Hypothesis TestingSantorico - Page 295
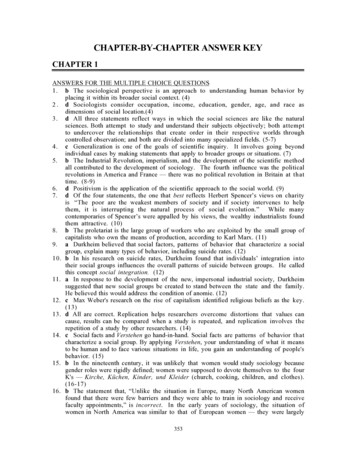
Step 2 Find the critical value(s) from the appropriate table.0.4Left-tailed test, 0.05 Z will be negative and have probability0.05 underneath it0.20.00.1P(Z)0.30.05-4-2024ZZ -1.645 orZ -1.65CH8: Hypothesis TestingSantorico - Page 296
Step 3 Compute the test value.z X 2995 3262 -1.716341 1100n50Step 4 Make the decision to reject or not reject the nullhypothesis.Since this is a left-tailed test, our rejection region consists ofvalues of Z that are smaller than our critical value of Z 1.645.Since our test value (-1.716341) is less than our critical value(-1.645), we reject the null hypothesis.CH8: Hypothesis TestingSantorico - Page 297
Step 5 Summarize the results.We have evidence to support the student senate claim that theuniversity’s seniors have credit card debt that is less than thereported average debt.This is based on a Type I error rate of 0.05. This means we falselymake the claim above 5% of the time.CH8: Hypothesis TestingSantorico - Page 298
Example: The medical Rehabilitation Education Foundationreports that the average cost of rehabilitation for stroke victimsis 24,672.To see if the average cost of rehab is different at a particularhospital, a researcher selects a random sample of 35 strokevictims at the hospital and finds the average cost of their rehab is 25,250. The standard deviation of the population is 3251.At α 0.01, can it be concluded that the average cost of strokerehabilitation at a particular hospital is different from 24,672?CH8: Hypothesis TestingSantorico - Page 299
Step 1 State the hypotheses and identify the claim.Step 2 Find the critical value(s) from the appropriate table.Step 3 Compute the test value.CH8: Hypothesis TestingSantorico - Page 300
Step 4 Make the decision to reject or not reject the nullhypothesis.Step 5 Summarize the results.CH8: Hypothesis TestingSantorico - Page 301
IMPORTANT NOTE:When the null hypothesis is not rejected, we do not accept itas true. There is merely not enough evidence to say that it isfalse.Consider the jury trial analogy. We don’t find people innocent,only guilty or not guilty. If someone is found not guilty, it doesnot mean that they were proved innocent; it only means thatthere is not enough evidence to reach a guilty verdict.We conclude the alternative hypothesis (when we reject thenull) because the data clearly support that conclusion.See the following slide for ways of describing your results.CH8: Hypothesis TestingSantorico - Page 302
See page 415 to help you remember what you can say in summarizing theresults based on where the claim is ( H0 or H1 ) and whether you rejected H0or not.CH8: Hypothesis Testing Santorico - Page 303
P-Value Method for Hypothesis TestingWe often test hypotheses at common levels of significance (α 0.05, or 0.01). Recall that the choice of alpha depends on theseriousness of the Type I error. There is another approach thatutilizes a P-value.The P-Value (or probability value) is the probability of getting asample statistic (such as the mean) or a more extreme samplestatistic in the direction of the alternative hypothesis when thenull hypothesis is true.The P-value is the actual area under the standard normaldistribution curve of the test value or a more extreme value(further in the tail).CH8: Hypothesis TestingSantorico - Page 304
A General Rule for Finding P-values using the Zdistribution or the t distribution:Suppose that z * is the test statistic of a z test and t * is the teststatistic of a t testLeft-tailedtest: p-value P(Z z*) or p-value P(T t*) (depending on whether we are doing a z test or a t test).Right-tailed test: p-value P(Z z*) or p-value P(T t*) (depending on whetherwe are doing a z test or a t test).Two-tailed test: p-value 2P(Z z *) or p-value 2P(T t *) (depending on whether we are doing a z test or a t test). CH8: Hypothesis Testing Santorico - Page 305
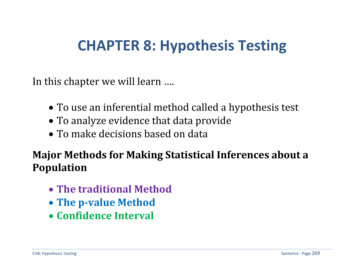
The smaller the P-value, the stronger the evidence is against H0.We use Table E to find P-Values that use a z Test.-4-20ZCH8: Hypothesis 0.00.1P(Z)Two tailed0.4Right tailed0.4Left tailed-4-20Z24-4-202ZSantorico - Page 3064
Examples:Suppose you have a left-tailed test and find the area in the tail tobe 0.0489. What is the P-value? Would you reject this at α 0.05? α 0.01?Suppose you have a two-tailed test and find the area in one tailto be 0.0084. What is the P-value? Would you reject this at α 0.05? α 0.01?CH8: Hypothesis TestingSantorico - Page 307
P-ValueIf p-value is α then we .If p-value is α then we .Let’s reconsider the hypothesis tests we did earlier and find thecorresponding P-values.CH8: Hypothesis TestingSantorico - Page 308
Example: It has been reported that the average credit card debtfor college seniors is 3262. The student senate at a largeuniversity feels that their seniors have a debt much less thanthis, so it conducts a study of 50 randomly selected seniors andfinds that the average debt is 2995, and the populationstandard deviation is 1100. Let’s conduct the test based on aType I error of 0.05.Step 3 Compute the test value and find the P-value.Z -1.72Step 4 and Step 5CH8: Hypothesis TestingSantorico - Page 309
Example: The medical Rehabilitation Education Foundation reportsthat the average cost of rehabilitation for stroke victims is 24,672. Tosee is the average cost of rehab is different at a particular hospital, aresearcher selects a random sample of 35 stroke victims at the hospitaland find the average cost of their rehab is 25250. The standarddeviation of the population is 3251. At α 0.01, can it be concludedthat the average cost of stroke rehabilitation at a particular hospital isdifferent from 24,672?Step 3 Compute the test value and find the P-value.Z 1.05Step 4 and Step 5CH8: Hypothesis TestingSantorico - Page 310
Section 8-3: t Test for a MeanWhen a population is normally or approximately normallydistributed, but the population standard deviation is unknown,the z test is inappropriate for testing hypotheses involvingmeans. Instead we will use the t test when is unknown andthe distribution of the variable is approximately normal. CH8: Hypothesis TestingSantorico - Page 311
The one-sample t test is a statistical test for the mean of apopulation and is used when the population is normally orapproximately normally distributed and σ is unknown.The formula for the test value of the one-sample t test is:t CH8: Hypothesis TestingX snd.f. n-1Recall from Chapter 7 that the tdistribution is a family of curvesand requires us to know thedegrees of freedom in order tofind the appropriate t value.Santorico - Page 312
Finding Critical Values Using Table F Determine if the test is one-tailed or two tailed. Determine the degrees of freedom Find the significance level by looking in the appropriaterow for the number of tails and down the column with thedegrees of freedom. If the degrees of freedomis not in the table, always round DOWN to the nearest table value (this is a conservativeapproach). If the test is a left-tailed test, then the critical value is theNEGATIVE of the value given in the table.CH8: Hypothesis TestingSantorico - Page 313
Example: Find the critical t value for 0.01 with sample size of 13for a left-tailed test. Left tailed means the critical t value will be negative n 13 means the degrees of freedom are n-1 12 The critical value is -2.681CH8: Hypothesis TestingSantorico - Page 314
Example: Find the critical t value for 0.05 with sample sizeof 21 for a right-tailed test. Example: Find the critical t value for 0.10 with sample sizeof 59 for a two-tailed test. CH8: Hypothesis TestingSantorico - Page 315
Finding P-Values Using Table FTo find a p-value: Draw a picture of the area we’re trying to find. Find row corresponding to df n 1. Find the 2 values in the row that the value of the teststatistic falls between. Find the α’s that c
CH8: Hypothesis Testing Santorico - Page 271 There are two types of statistical hypotheses: Null Hypothesis (H0) – a statistical hypothesis that states that there is no difference between a parameter and a specific value, or that there is no diff