Transcription
Perfume EngineeringPure AmbitionClare HoangCicely WilliamsKyla Patterson
ppiness FunctionResultsEconomic Analysis
ObjectiveThe objective of our project is toengineer a new scent of perfumeover a 10 year life span. Inaddition to this, marketing of theproduct and economic analysismust also be taken into account.
Background
Functions of a Perfume FunctionsProvide a pleasant odor Cover base smell of productGive product identity Signify product change ExamplesAir freshenersSoaps or lotionsBanana Boat sunscreenNew and Improved!
Perfume ConstructionMaking a scent – Attributes Scent – Ingredients Color – Aesthetics Oiliness of fluid – Concentration of Essential Oils Initial strength of fragrance - Concentration Endurance - Time*These attributes’ role in the happiness function willbe discussed in later slides.
Parts of a PerfumeThere are three main parts of a perfume: Basics the basics are the materials inthe essential oilthat are present at higher percentages Diluent ingredients inmixture Solventthe perfume that dilutes the
Emulsion Due to the solubility of the essential oils inwater, perfume is an emulsion Range from 1 ppm to20,000 ppm Not a significant amount Oil and aqueous phase Continuous phase Dispersed phase A stable emulsionis au/wissenschaft.htm
Vocabulary Top note – component of a fragrance with high Middle note – component of a fragrance with Base note – component of a fragrance with low Odor threshold – minimum concentration in air Odor value – the concentration in air of an odorevaporation ratemedium evaporation rateevaporation rateat which an odor is detectable by the human nose
Scent Pyramid ExampleType of scent(Examples)Lemon, LavenderHibiscus, RoseMusk, VanillaTypical Percentage ofScent in FragranceTop NoteMiddle NoteBase Note15-25%30-40%45-55%Mata, Vera G., Paula B. Gomes, and Alfrio E. Rodrigues. "Engineering Perfumes." AIChEJournal 51 (2005): 2834-2852.
Types of PerfumesTypesTotal (vol %)Remainder (vol %)OilAlcoholWaterParfum15 to 3090 to 955 to 10Eau de Parfum8 to 1580 to 9010 to 20Eau de Toilette4 to 880 to 9010 to 20We chose to use Eau de Parfumto reach the “average” market
Plan of Action Determine the components of a perfume thatmaximize the ROI and the HappinessTo do this:First calculate the market and the demand Next determine the initial composition of perfume Relate attributes of perfume to economics using thescent concentrations as manipulated variables Use Solver in Excel to optimize ROI by varyingscent concentrations
Marketing
Target Market Female Age We25-40chose this market becausethis group is more likely tohave a stable job/income.
Introduction Location Due to investment opportunities, Oklahoma CityMetropolitan Statistical Area (MSA) is our choiceintroduction location
AdvertisingThe intended course of action is to advertise to thetarget market in the MSA. Therefore we havechosen to advertise in the following areas:Advertising1%1% 5% 0% 7%NewspapersTelevisionDirect MailRadioMagazines86%Online
Pricing Model Budget Modelp1d1 p2 d 2 Y d α1αp1d1 p2 d 2 ββd 2Where p1 and p2 are ours and our competitor’s product prices( /bottle)d1 and d2 are our and our competitor’s demand (# ofbottles sold)Y is total amount of sales for product ( )
Pricing Model FixedDemand Modeld1 d 2 D α d1 β 11 α1 β1 α(D d1 )For our product, the budget model is mostappropriate. Although this may be the case,due to demand constraints, the fixed demandmodel will be implemented accordingly.
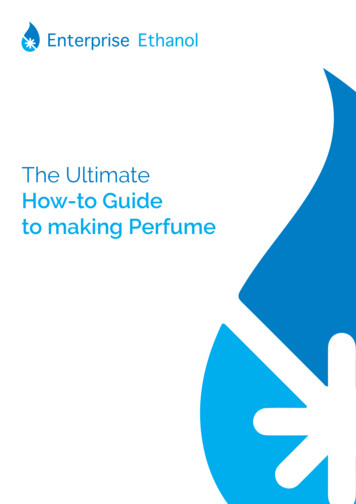
Determination of α α determined through several logicalassumptionsAssume that competition is completelyrecognized, horizontal fitAssume linear recognition fit, then plateau forour recognitionAll of the α’s are averaged over time
Graph of α Determinationalphaers (people)Aware 0.680000Competition0.460000400000.2200000Pure Ambition0001 22344 56 678Time (years)Time (years)9 8101012
Happiness Function
Perfume Survey A survey was used to determine the qualities of afragrance desired by the target marketGiven to a sample group of target market;females between the ages of 25 and 40Asked to rate several perfumes over a period ofeight hoursAsked to define characteristics of ideal perfumeThese values were used to model the “perfect”fragrance
ComponentsWhat are consumers looking for in a perfume?Scent (60%)Initial strength offragrance (1%)Endurance (35%)Oiliness of fluid (1%)Color (3%)H(perfume) (0.6)yscent (0.35)yendurance (0.03)ycolor (0.01)yviscosity (0.01)yinit.strength
Additional Variables There were other determinants to consider in aconsumer’s initial purchase of a perfume thatwere not considered directly in the happinessfunction. These include: Skin reaction – Set as a concentration constraint(Each EO cannot exceed 5 vol% of totalperfume volume) Price – Determined with pricing model
Initial Scent How pleasing or displeasing the scent of theperfume on immediate application is to theconsumer x x x x x yscent 0hr zcitrus have znatural have z floral have zmusk have zoriental have xwant citrus xwant natural xwant floral xwant musk xwant orientalWhere z weight each scent carries Where x mole fraction for each scent
Scent After Four Hours The smell of the perfume after four hours How pleasing or displeasing to the consumer thescent of the perfume is four hours after application xy scent 4 hr z natural have xwant x z floral have natural xwant x z musk have floral xwantTop note is no longer detectable x zoriental have musk xwant oriental
Scent After Eight Hours The smell of the perfume after eight hours How pleasing or displeasing to the consumer thescent of the perfume is eight hours after applicationy scent 8 hr xhave z natural xwant xhave z musk natural xwant xhave z oriental musk xwant orientalTop note and middle note are no longer detectable
Color The color of the packaging How appealing the color of the perfume packaging is tothe consumerycolor wcolor K * (0.03) For our fragrance, the happiness due to coloris assigned the number 1 The color red was chosen based on the results of thesurvey which maximizes happiness for color
Oiliness The oiliness of the perfume was determined using theconcentration of the essential oils in the perfumeyoiliness woiliness {10low coil highif not met} (0.01)The range is determined by the concentration constraintsset by the volume percentage of oil allowed in an eau deparfumVolume Percent Range: 8% – 15% of total
Initial Strength Any unhappiness caused by the initial scent of thefragrance being either too strong or too weak on initialcontacty init . strength winit . strength C A CW 1 CW * (0.01) Where CA is the actual initial concentration in air, andCW is the wanted concentration in air determined bysurvey data and comparison to competition
Endurance How long the smell will still be noticeable to othersafter it is applied The amount of time that the perfume can still be detectedby others in a ten centimeter radius from the personwearing the perfumeyendurance1wendurance OVi zt Thrsi (0.17)t zThrs odor threshold With: f 0; iff 1; if OVi z OVi zttOV odor value Thrsi 0t z Thrsi t z 0
Diffusion Model The endurance parameter in the function hastwo variables: time, distanceA diffusion model was used to approximate thechange in concentration of the fragrance overtime and distance
ln γ i ln γ ic ln γ iRActivity Coefficients Activity coefficients were obtained using theUNIFAC method from The Properties ofLiquids and Gases by Reid, Poling, andPrausnitz[1] This method was used because it determinedactivity coefficients due to interactions betweenstructural groups instead of utilizingexperimental data[1] Reid, Prausnitz, Poling. The Properties of Gases and Liquids. 4th Edition. New York City,NY. McGraw-Hill, Inc. 1987
ln γ i ln γ ic ln γ iRActivity Coefficientsln γ i ln γ ln γciRi Combinatorial – due to differences in sizesand shapes of the molecules in the mixture Residual – due to energy interactions betweenthe different groups
Analysis in ExcelUsing Excel, we iterated the change in concentrationover time up to a distance of 1 ft and a time of 8 hours Most data was knownwith the exception of theconcentration changeover distanceThis was calculatedusing a derivation ofFick’s Second Law
Fick’s Second Law ci ci D 2 t z2 Small amount of liquid on surface with concentrationchanging over timeDerivation for numerical analysisRequired assumptions due to lack of experimental data Liquid and gas phases are in equilibrium Unidirectional diffusion Ideal gas law holds Each component diffuses separately
Diffusion Model A diffusion model was used to define endurancein the perfume Optimum endurance of the scent was defined byusing the concentration of the fastest depletingbase note at time equal to eight hours This concentration must be equal or greater thanthe threshold of the scent to be considered as“enduring”
Numerical AnalysisDerivation of Fick’s 2nd Law[(cz ,t c z ,t t )c z z ,t t 2c z ,t t cz z ,t t ] D t z 2Boundary Conditions: t 0, CA (z, 0) CAo for all z z 0, CA (0, t) CAs for t 0 z , CA ( , t) CAo for all t
(ctz c zt t t) c zt tz c zt t z D c zt t c zt tz z z Diffusion Model (cont.)From Fick’s 2nd Law (ctz) c zt t D t c zt tz c zt t z c zt t c zt tz z zExpanding we gett tzc ctz[D t t t 2 cz z 2czt t czt tz z]Simplifying we get[1 t tc c z z c zt tz2tz]with z 2 D t
Analysis in Excel Cont’d c / zWith thesevalues, we canfind theconcentrationat any timeand at anypositionc tz
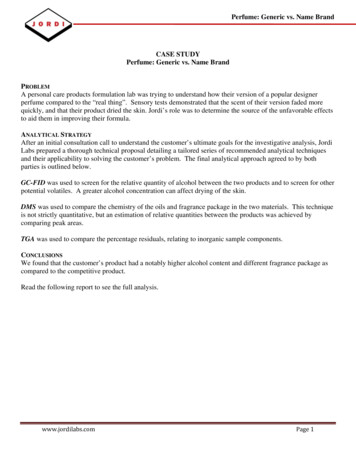
Concentration ProfilesConcentration profiles were developed by plottingconcentration versus time at distance zConcentration vs. z -distanceSandalwood (Linalool)0.0014Conc 0.10.150.20.250.30.35z - distance (m)t 1 hrt 2 hrt 3 hrt 4 hrt 5 hrt 6 hrt 7 hrt 8 hr
Concentration vs. Time The fastestdepletingcomponent wasdetermined to beSandalwood, with athreshold in air of6.4 x 10-5 g/m3, andan endurance timeof 9 hours Based on thesevalues, theendurance of theperfume wasdeterminedConcentration (mol/m3).Concentrationvs. Time0.00002z-distance 0.1mConcentration 10-0.0000050.0005Time odMuskVanillaAmberThreshold161820
Happiness Function To determine the engineered variables withrespect to the consumer variables from thesurvey, graphs of happiness versus eachconsumer variable were developed These were then related to intermediatevariables which could be manipulated toform the fragrance
Scent GraphsHappinessvs. ConsumerHappinessvs. ConsumerAmountAmount(Linearized)Scent- 0-HRScent0 t(VolumeFraction)0.80.911
Scent GraphsVolume fraction vs. Mole fractionCitrus (0-Hour)0.8Consumer amount(volume 0.7Intermediate Variable (mole fraction)0.80.91
Scent Graph With IntermediateVariableHappiness vs. Intermediate VariableScent 0 iental0.2000.10.20.30.40.50.60.7Intermediate Variable (mole fraction)0.80.91
Determination of βHappiness ComparisonCategoriesPure t. Strength9.96.7Color10.08.5Oiliness0.506.5Overall Score6.907.6Overall Happiness0.7180.756β Happiness of Competition / Happiness of Pure Ambition
Economic Analysis
Process Flow DiagramMixer Based ondemand P-10 Production 13300 bottles/year 1.7 oz/bottle 665 ing
Capital Investment
Production Costs – Max ROI
Perfume Results
Formula of Perfume - MaxHappiness 80%PERFUME lventDI Water8.5DiluentPeony0.50Top NoteLemon2.32Top NoteHoneysuckle0.50Middle NoteHibiscus0.50Middle NoteRose0.50Middle NoteAmber1.09Base NoteVanilla1.09Base NoteSandalwood3.85Base NoteAfrican Musk4.65Base Note
Maximum Happiness Decision Based on project life of 10 years and MaxROI @ 80% HappinessRevenue: 600Total Capital Investment: 286,000Total Annual Production Cost: 500,000Total Profit: - 315,000Return on Investment: -110.43%
Formula of Perfume 75%HappinessPERFUME lventDI Water8.5DiluentPeony0.26Top NoteLemon2.98Top NoteHoneysuckle0.26Middle NoteHibiscus0.26Middle NoteRose0.26Middle NoteAmber1.73Base NoteVanilla1.73Base NoteSandalwood6.99Base NoteAfrican Musk0.54Base Note
Most Profitable Decision Based on project life of 10 years and MaxROI @ 75% HappinessRevenue: 820,000Total Capital Investment: 255,000Total Annual Production Cost: 565,000Net Profit: 170,000Return on Investment: 56.91%
Market Scenarios Three economic scenarios in question Higheconomic pricing on raw materials Average economic pricing on raw materials Low economic pricing on raw materialsA standard deviation of 20% wasassumed Raw materials contribute a largepercentage of cost for calculating thetotal product cost
ROI vs. HappinessROI vs. Happiness at differing economic scenarios
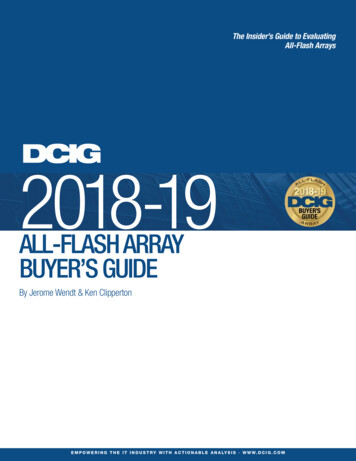
Risk Analysis for Max HappinessDistribution for ROI (%)X -111.915%0.45X -108.9595%Mean -110.42820.4Mean ROI: -110.43 %0.350.30.25Probability of Occurrence:0.20.15 40 %0.10.050-115-113-111-109-107Distribution for ROI (%)X -111.915%1Cumulative Probability100% Chance of losing moneyX -108.9595%Mean -110.42820.80.60.40.20-115-113-111-109-107
Risk Analysis for Maximum ROIDistribution for ROI (%)X 51.445%0.14X 62.3395%Mean ROI: 59.91 %Mean 56.91460.120.1Probability of Occurrence: 12%0.080.060.040.02040506070Distribution for ROI (%)X 51.445%1Cumulative ProbabilityX 62.3395%Mean 56.91460.80.6100% Chance of gainingmoney0.40.2040506070
MiniMax Regret A regret analysis wasperformed on low,medium, and highmarket values for rawmaterial cost Based on MiniMaxanalysis F7 is theoptimum choice
Regret AnalysisRegret AnalysisF125F2F3-25ROIF4F5-75F6F7-125F8-175Sce na rio 1Low M a rke t Sce na rio 2Ave ra ge M a rke tSce na rio 3High M a rke tA regret analysis was performed on the perfume formulations atthe three economic scenariosTraditional – F7Optimistic – F7Pessimistic – F7
ConclusionsPure Ambition is profitable!Based on the following parameters: 75% HappinessDemand 13,300 peoplePrice 60/bottle
Questions?
Determine the components of a perfume that maximize the ROI and the Happiness To do this: First calculate the market and the demand Next determine the initial composition of perfume Relate attributes of perfume to economics using the scent concentrations as manipulated variables Use Solver