Transcription
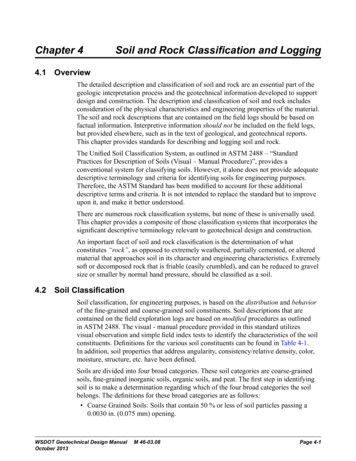
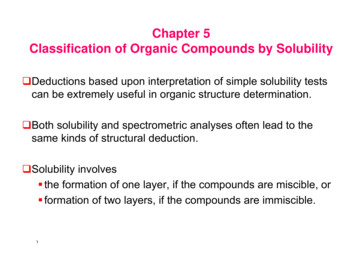
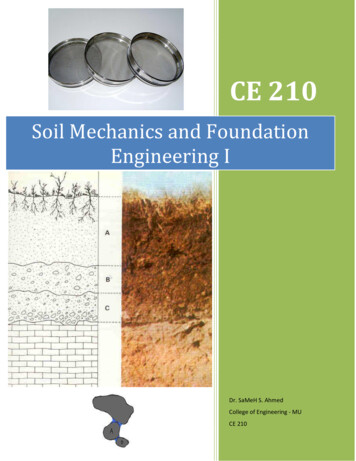
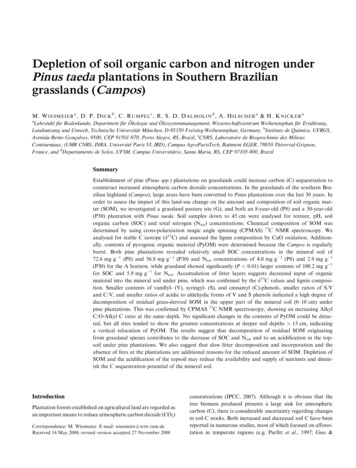
2019 Geotechnical ManualCHAPTER 5SOIL CLASSIFICATION AND LABORATORY TESTING5.0GENERAL: WEIGHT VOLUME RELATIONSHIPIn nature, soils are three-phase systems consisting of solid soil particles, water, and air (or gas). Todevelop the weight-volume relationships for a soil, the three phases can be separated as shown in Figure5.1(a). Based on this separation, the volume relationships can be defined in the following manner. Void ratio (e) is the ratio of the volume of voids to the volume of soil solids in a given soil massdefined by:𝑉𝑣𝑒 𝑉𝑠Equation (5.1)Where: Vv volume of voidsVs volume of soil solids Porosity ( ) is the ratio of the volume of voids to the volume of the soil or,𝜂 𝑉𝑣 100(%)𝑉Equation (5.2)Where: V total volume of ��� 𝑉𝑉𝑉𝑉𝑠 𝑉𝑣1 𝑒𝑠𝑣𝑉𝑠 𝑉𝑠Equation (5.3) Degree of saturation (S), defined by the following, is the ratio of the volume of water in the voidspaces to the volume of voids, which indicates the percentage of the total volume of voids filled withwater:𝑉𝑤𝑆 100(%)𝑉𝑣Equation (5.4)Note that completely dry soil has S 0%, whereas fully saturated soil has S 100%.Weight Volume Relationship:Total Weight WW Wa Ws Ww Ww Ws (Wa 0)Wa, Ww , and Ws are weights of air, water, and solids in the soil.Total Volume VV Va Vw VsPage 1 of 19
2019 Geotechnical ManualVa, Vw, and Vs are volumes of air, water and solids in the soil. Specific gravity of solid (Gs):𝛾𝑠𝛾𝑤Where: s and w are unit weights of solid and water.𝐺𝑠 w 62.4 lb/ cu ft. Weight of solid (Ws):𝑊𝑠 𝛾𝑠 𝑉𝑠 𝐺𝑠 𝛾𝑠 𝑊𝑠 𝐺𝑠 𝛾𝑤 (when 𝑉𝑠 1)VaWeightWaWwVolumeAirVvVwVWaterWVsWsSolidFigure 5.1 Weight-Volume Relationship(a) Components of soilsWeightVolumeWa 0Ww Vw wWaterWs Gs wSolidVolumeWeightAirVv eVs 1Ww e wWaterVw wGs eWs Gs wSolidVs 1Vw Vv eGsw eS, when Vs 1(b) Unsaturated soil; Vs 1, three-phase diagram(c) Weight-volume relationships, two-phasediagramPage 2 of 19
2019 Geotechnical ManualThe weight relationships are water content, moist unit weight, dry unit weight, and saturated unit weight.They can be defined as follows: Moisture or water content (w):𝑊𝑤 100(%)𝑊𝑠𝑤 Equation (5.5)Moist (natural or bulk) density (lb/cu ft):𝛾bulk 𝑀𝑡𝐺𝑠 𝛾𝑤 (1 𝑤) 𝑉𝑡1 𝑒Equation (5.6)Dry unit weight (lb/cu ft):𝛾𝑑 𝛾bulk𝐺𝑠 𝛾𝑤 1 𝑤1 𝑒Equation (5.7)Saturated unit weight (lb/cu ft) where the air voids are filled with water so that:𝑉w 𝑒 and 𝑀𝑤 𝑒𝛾𝑤Thus,𝛾sat 𝛾𝑤 (𝐺𝑠 𝑒)(1 𝑒)Equation (5.8)Submerged unit weight (lb/cu ft):𝛾 ′ 𝛾sat 𝛾𝑤 𝛾𝑤 (𝐺𝑠 1)1 𝑒Equation (5.9)Page 3 of 19
2019 Geotechnical Manual5.1MOISTURE CONTENTThis test shall consist of determination of moisture content on all fine-grained soil samples inaccordance with AASHTO T-265. It is important to note that the moisture content w is expressed as apercentage in Equation 5.5. Moisture content is an important soil property that relates with soilbehavior, clay content, organic content, calcium carbonate, shear strength, compressibility, and otherengineering properties. This test may not be required on soils with less than 35% passing #200 Sieve(0.075 mm).5.2SPECIFIC GRAVITY TESTSpecific gravity tests of soils shall be performed in accordance with AASHTO T-100. Most Indianasoils have specific gravities ranging between 2.60 to 2.75. Soils with organic content or porousparticles may have lower specific gravities. Coal combustion residuals may have higher specificgravities.5.3CLASSIFICATION TESTS5.3.1GRAIN SIZE DISTRIBUTIONThe results of sieve analyses, plotted in the form of a gradation curve, are used to estimate soilpermeability. The following tests shall be performed on samples obtained to verify the fieldclassification of the major soil types encountered during the investigation. The number of testsshall be limited to reasonably establish the stratification without duplication, unless approvedotherwise. A minor soil type, if not critical, may be given a visual classification, instead ofperforming classification tests for reference.5.3.1.1 SIEVE ANALYSISA sieve analysis is a quantitative determination of the distribution of particle sizes present inthe soil sample. The testing will be accompanied by means of a hydrometer analyses. Themethod of determining the distribution of particle sizes in soils shall be in accordance withAASHTO T-88 and INDOT’s triangular classification chart as given in this section. Soilclassification shall be in accordance with AASHTO M-145.Sieves shall be U.S. sieve sizes: 75 mm (3 in.), 50 mm (2 in.), 25 mm (1 in.), 9.5 mm (⅜ in.),4.75 mm (No. 4), 2.00 mm (No. 10), 0.425 mm (No. 40), and 0.075 mm (No. 200).5.3.1.2 HYDROMETER ANALYSISThis work shall consist of the hydrometer analysis in accordance with AASHTO T-88, whichincludes a determination of specific gravity in accordance with AASHTO T-100. If more than20% of a sample passes the No. 200 sieve, a hydrometer analysis shall be performed. A grainsize distribution curve shall be provided and should include the combined results of the sieveanalysis.Soil behavior changes when the soil’s clay content is greater than 20 % in soil matrix.Engineering judgment should be used to perform a hydrometer analysis on each predominantsoil type.Page 4 of 19
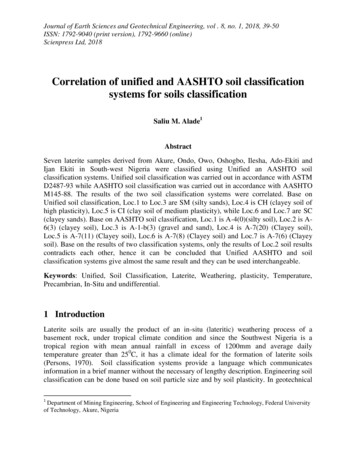
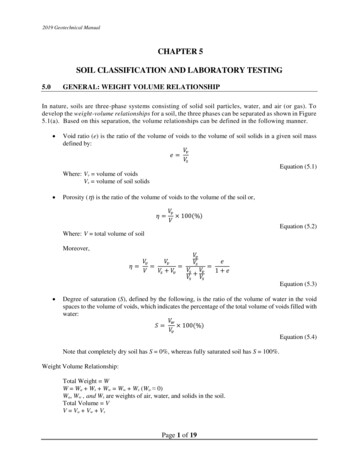
2019 Geotechnical Manual5.3.2ATTERBERG LIMITS AND PLASTICITY INDEX (PI)The liquid limit (LL) is determined according to the AASHTO T-89 method. The plastic limit (PL)and plasticity index (PI) are determined according to AASHTO T-90. At different water contents,a fine-grained soils can exist in several states of consistency. Soil behavior can be predicted withAtterberg limits. The consistency and the behavior (i.e., the relative ease that fine-grained soilscan be deformed) depend primarily upon the amount of water present in the soil-water system.Usually, soils with a higher LL contain a greater clay content. In 1911, A. Atterberg, a Swedishsoil scientist, proposed the boundaries of four states of consistency in terms of limits. These limitsand the zones between the limits are illustrated in Figure 5.2.Each limit represents a moisture content beyond which the soil changes from one state to another.The plasticity index (PI) represents the range of moisture contents, through which the soil is in theplastic state. The PI is simply the moisture content at the LL minus the moisture content at the PL.The limits are useful for soil classification and correlate with the soil’s engineering behavior, suchas compressibility, permeability, shrink-swell, and strength. The shrinkage limit (SL) can be usefulin predicting the maximum loss of volume. For example, an embankment material may undergoshrinkage when removed from a wet borrow and subsequently dried after rolled into a fill. As soildries to the SL, there is a loss of volume and water. Further drying removes water only withoutcorresponding volume loss.Behavior ConditionsBoundary NamesLiquid StateIncreasing wLiquid Limit (LL)Plastic StatePlasticity Index (PI)(PI LL – PL)Plastic Limit (PL)Semisolid StateShrinkage Limit (SL)Solid StateDryFigure 5.2 Consistency of soils as indicated by Atterberg limitsThe LL, PL and SL vary for each soil, but the procedures for obtaining these values have beenstandardized. The LL is determined in the laboratory by measuring the moisture content at whicha standard groove of soil, placed in a standard brass cup, will close when the cup is dropped 2 5times from a 0.394 in. height. The PL is determined by measuring the moisture content at which athread of soil begins to crumble, when rolled into a 1/8 in. diameter. The SL is determined by dryinga sample of saturated soil and measuring the limiting moisture content at which no further volumechanges occur with loss of water.The PI of A-7-5 subgroup is equal to or less than LL – 30, whereas PI of A-7-6 subgroup is greaterthan LL – 30. Generally, the optimum moisture content (OMC) of cohesive soils is a couple percentbelow the moisture content at the PL.Page 5 of 19
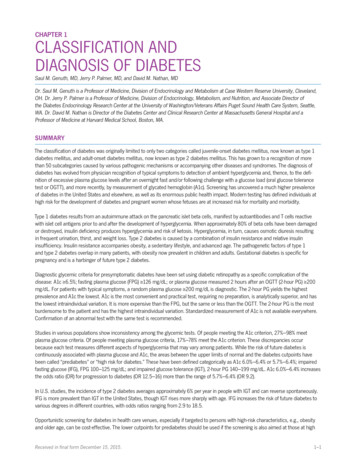
2019 Geotechnical ManualPlease note that additional parameters of group index (GI) are determined to classify fine soils.GI shall be calculated after performing the soil classification and Atterberg limit. Additionally, theGI is reported along with the classification test. The GI indicates the percentage and plastic natureof the portion of the material passing No. 200 sieve. Calculation of the GI is the final part of theAASHTO classification. Generally, the higher the value of the GI for a given classification, thepoorer the performance of the soil. Therefore, GI relates with construction properties of a soil, suchas strength, compressibility, or volume change.The formula used to calculate the group index is as follows:GI (𝐹 35)[0.2 0.005(LL 40)] 0.01(𝐹 15)(PI 10)GI Group Index. Reported as a positive whole number or zeroF Percentage passing the No. 200 sieveLL Liquid limitPI Plasticity indexPage 6 of 19
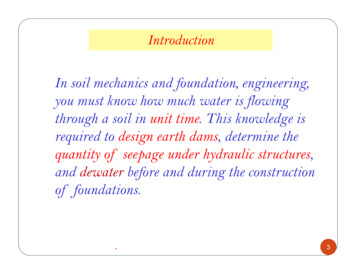
Table 5.4 Classification of soil and soil-aggregate mixtures from AASHTO M-145OrganicGroupSubgroupGranular Materials(35% Or Less Passing No. ay Materials(More than 35% Passing No. % PassingNo. 10 50 max.—No. 40 30 max. 50 max.No. 200 15 max. 25 max.LL and PIofFractionPassingNo. 40LL—PI6 max.Types ofSignificant Stone Fragments,Gravel and SandMaterialsSubgradeRating—51 min.10 max.——35 max.——35 max.——35 max.——35 max.——36 min.——36 min.——36 min.——36 min.N.PN.P.40 max.10 max.41 min.10 max.40 max.11 min.41 min.11 min.40 max.10 max.41 min.10 max.40 max.11 min.41 min.11 min.FineSandSilty or Clayey Gravel and SandExcellent to GoodSilty SoilsFair to PoorPage 7 of 21Clayey SoilsPeatUnsuitable
2019 Geotechnical ManualSoil ClassificationINDOT Textural Soil ClassificationDefinitions:Boulder 10 inCobbles10 in - 3 inGravel3 in - No. 10 SieveCoarse SandNo. 10 - No. 40 SieveFine SandNo. 40 - No. 200 Sieve (0.075 mm.)Silt0.075 - 0.002 mm.Clay 0.002 mm.Colloids 0.001 mmSoil with organic content (AASHTO T-267) 8% or less is considered a mineral soil.Page 8 of 19
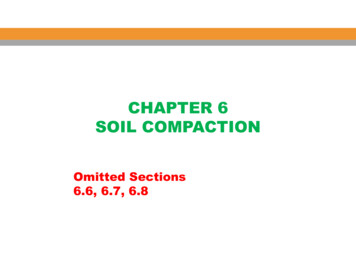
2019 Geotechnical ManualSoils having 0 to 19% Retained on No. 10 sieve (Chart below may be used)ClassificationSandSandy LoamLoamSilty LoamSiltSandy Clay LoamClay LoamSilty Clay LoamSandy ClaySilty ClayClay% Sand & Gravel80-10050-8030-50Up to 500-2050-8020-50Up to 3050-700-200-50% Silt0-20up to 5030-5050-8080-1000-3020-5050-800-2050-700-50% Clay0-20up to 20Up to 200-200-2020-3020-3020-3030-5030-5030-100Soils having 20% or more retained on No. 10 sieve and more than 20% passing No. 200 sieve (Silt andClay).Classify in accordance with table above, followed by the term describing relative amount of gravel according to thefollowing:20% to 35% gravel – “with some gravel”36% to 50% gravel – “and gravel”Examples:Clay loam with some gravelSandy loam and gravelSoils having 20% or more retained on No. 10 sieve less than 20% passing No. 200 sieve.ClassificationGravelSandy GravelGravelly SandSand and Gravel% Gravel85-10040-8520-4020-50% Sand0-1515-4040-8020-50% Silt0-150-200-200-20% Clay0-150-200-200-20Note: When the gradation of a given sample does not meet the requirements for any classification exactly, it shallbe placed in the classification to which it comes the closest.Organic Soils: The following classification system shall be used for organic soils in accordance withAASHTO T-267. Soils with organic content should have low shear strength, low unit weight, and a highmoisture content. Based on research, loss on ignition (AASHTO T 267) overestimates the organic contentby a couple of points. The soil’s organic content percentage relates well with moisture content, unit weight,shear strength, compressibility, etc. The Engineer should use engineering judgment while reviewing thistest.ClassificationWith Organic MatterOrganic Soil (A-8)Peat (A-8)Percentage4 OC* 1516 OC* 30OC* 30* Organic Content in PercentagePage 9 of 19
2019 Geotechnical ManualMarly Soils: Marl may be encountered below the organic soils in addition to areas where water is ponded. Thefollowing classification system shall be used for marly soils with calcium and magnesium carbonate content. Thetest shall be performed in accordance with sequential loss on ignition following ITM 507.With Trace Marl1% to 9%With Little Marl10% to 17%With Some Marl18% to 25%Marly Soil (A-8) No group index26% to 40%Marl (A-8) No group indexMore than 40%ITM 507 may either overestimate marl content or involve error on the high side when soils with sand is burnedoff in muffle furnace. Engineers should perform the test when soils are lighter, spongy, or soils with shells.Engineer should use their engineering judgment while reviewing this test along with moisture, or unit weight.Sequential loss on ignition of soil relates well with moisture content, unit weight, shear strength, andcompressibility.As guide, the sequential loss on ignition marl test is recommended when max dry density is 105 pcf andmoisture is 25%.5.4pH TESTThe pH test is performed in accordance with AASHTO T 289 using only distilled water. The test should be performedon all classification test samples and others as necessary. When the test is performed on moder ate to non-organicmaterial, sample sizes should be 0.04 lbs (20.0 grams) of material passing the No. 4 (4.75 mm) sieve. The samplesshall be prepared in accordance with AASHTO T-87.5.5ORGANIC CONTENT (LOSS OF IGNITION)This test shall determine the organic content in accordance with AASHTO T-267. High organic content in soilsresult in high moisture and low shear strength. Organic soils in foundations or compacted embankments maydecompose or decay over time resulting in settlement. Hence, organic soils are undesirable in geotechnicalengineering. This method will provide a quantitative estimation of oxidized organic matter in the soil mass. Whenall the carbon is burned such as coal or minerals, it overestimates loss on ignition. Sometimes, loess from southernIndiana will have a higher loss on ignition due t
classification shall be in accordance with AASHTO M-145. Sieves shall be U.S. sieve sizes: 75 mm (3 in.), 50 mm (2 in.), 25 mm (1 in.), 9.5 mm (⅜ in.), 4.75 mm (No. 4), 2.00 mm (No. 10), 0.425 mm (No. 40), and 0.075 mm (No. 200). 5.3.1.2 HYDROMETER ANALYSIS This work shall consist of the hydrometer analysis in accordance with AASHTO T-88, which includes a determination of specific gravity in .