Transcription
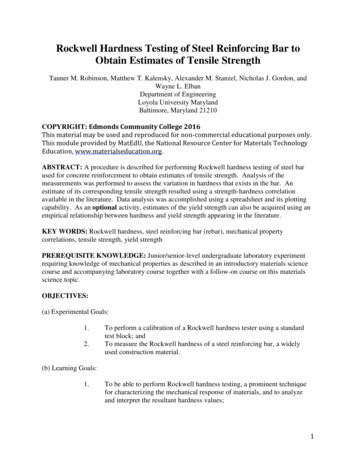
Experiment: Mechanical Testing- Impact & Hardness TestingObjectiveThe main objective of this experiment is to introduce two important basic mechanical property tests; hardness(using Rockwell testing) and impact (using Charpy testing). Chauvenet’s Criterion will be applied to identifyoutliers and probability paper will be used to ascertain whether or not the repeated measure hardness data isnormally distributed.AbstractThe mechanical properties of materials are ascertained by performing carefully designed laboratoryexperiments that replicate, as nearly as practical, the service conditions. Factors to be considered includethe nature of the applied load(s), its’ duration and the applicable environmental conditions. It is possiblefor the load to be tensile, compressive, or shear, and its magnitude may be constant with time, or it mayfluctuate continuously. Application time may be for only a fraction of a second, or it may extend over aperiod of many years. Service temperature can also be an important factor.Mechanical properties are of concern to a variety of parties (e.g., producers and material consumers,research organizations and government agencies) that have differing interests. Consequently, it isimperative that there be some consistency in the manner in which tests are conducted, and in theinterpretation of their results. This consistency is accomplished by using standardized testing techniques.Establishment and publication of these standards are often coordinated by professional societies. In theUnited States the most active organization is the American Society for Testing and Materials (ASTM); itsAnnual Book of ASTM Standards comprises numerous volumes that are updated yearly. A large numberof the ASTM Standards are relate directly to mechanical testing techniques including specifications formeasuring the hardness and impact properties of materials.Background – Impact TestingToughness is a measure of the amount of energy a material can absorb before fracturing. It becomes ofengineering importance when the ability of a material to withstand an impact load without fracturing isconsidered. Impact test conditions were chosen to represent those most severe relative to the potentialfor fracture, namely, (1) deformation at a relatively low temperature, (2) a high strain rate (i.e., rate ofdeformation), and (3) a triaxial stress state (which may be introduced by the presence of a notch).Two standardized tests, the Charpy and Izod, are commonly used to measure Impact Energy (sometimesreferred to as Notch Toughness). The Charpy V-notch (CVN) technique is most commonly used in theUnited States. For both Charpy and Izod, a V-notch is machined into a bar specimen with a square crosssection. A standard V-notch test apparatus is schematically illustrated in Figure 1. The load is applied asan impact blow from a weighted pendulum hammer that is released from a cocked position at a fixedheight "h". The specimen is positioned at the base as shown. Upon release, a knife edge mounted onthe pendulum strikes and fractures the specimen at the notch, which acts as a point of stressconcentration for the high velocity impact blow. The pendulum continues its swing, rising to a maximumheight "h’", which is lower than "h". Based on the difference between h and h’, the energy absorption ofthe specimen is computed. The primary difference between the Charpy and Izod techniques lies in themanner of specimen support as is indicated in Figure 4. Variables including specimen size and shape, aswell as notch configuration and depth can influence the test results.Rolfe and Barsom (1987) developed a correlation between CVN and Fracture Toughness (KIc) that is givenby:Where KIc is the fracture toughness at slow loading rates (ksi(in)1/2), σys is the 0.2% offset yield strength(ksi), and CVN is the standard Charpy V-Notch impact test value.2
Figure 1(a) and 1 (b) – Schematic Drawing of a Standard Impact-Testing Apparatus. [Callister, 1991]Background - Statistical ConsiderationsChauvenet's CriterionEngineers often find that some data points look bad and out of place in comparison with the bulk of the datain a set of repeated measures data. When this occurs, the engineer must decide if outlying data points areexperimental blunders, and hence may be neglected, or if they represent some new type of physicalphenomenon that is peculiar to a certain operating condition. The engineer cannot just ignore those pointsthat do not fit with expectations, thus Chauvenet developed a criterion to determine whether or not suspectdata points can be eliminated from the analysis (points may be eliminated from the analysis but should neverbe eliminated from the data set!).3
Suppose "n" measurements of a quantity are taken and "n" is large enough that we may expect theresults to follow a Gaussian (Normal) Error Distribution. This distribution may be used to compute theprobability that a given reading will deviate a certain amount from the mean. A probability much smallerthan 1/n is very unlikely to occur in a set of "n" measurements. Chauvenet's criterion specifies that areading may be rejected if the probability of obtaining the particular deviation from the mean is less than1/(2n.). Table 1 lists values of the ratio of mean deviation to standard deviation for various values of "n"according to this criterion.In applying Chauvenet's criterion to consider the elimination of suspect data points, one first calculatesthe mean value and standard deviation using all of the collected data points. The deviations of theindividual points from the mean are then compared with the standard deviation in accordance with theinformation in Table 3. If the critical value is exceeded then the data points in question are eliminatedfrom the analysis. For the final data presentation, a new mean value and standard deviation arecomputed with the rejected data points eliminated. Note that Chauvenet's criterion might be applied asecond or third time to eliminate additional points, but this practice is unacceptable, and only the firstapplication may be used.Table 1 - Chavenet's Criterion For Rejecting A ReadingNumber of readings,n234567101525501003005001,000Ratio of maximum acceptable mean deviation tostandard deviation, dmax/ .293.48Normal Distribution – Probability PaperTo determine whether a data set follows a Gaussian distribution, Probability Paper is often utilized.Probability Paper uses the coordinate system where the ordinate (Y axis) has the percent of readings at orbelow the value of the abscissa (X axis) which is the value of a particular reading. The data must be RankOrdered prior to plotting and the largest value cannot be plotted because the Y-axis does not extend to100%. The X-axis spacings are such that Normally Distributed Data (Gaussian) will plot as a straight line; thusif the plotted data is approximately linear when plotted on probability paper, then the data can be said to benormally distributed. The upper and lower ends of the curve are less important than the center portion indetermining the adequacy of the Normally Distributed assumption.Example 1: The following length data were collected for the measurement of the length of a single steel rod.Apply Chauvenet's Criterion to determine if suspect data points can be eliminated, plot the data onprobability paper, and comment on the normality of the distribution.4
Reading12345678910X i, cm4.644.634.374.664.614.654.594.694.704.68The mean of the data set is given by:Sample standard deviation can be computed as:The following table presents the data in Rank Order, the Mean Deviations (di) and the ratio of the meandeviations to the standard deviation:Rank Order12345678910Xi (cm)4.374.594.614.634.644.654.664.684.694.70 di 0 di 0.71520.8204Chauvenet’s tAcceptAcceptAccept"DO NOT ELIMINATE THE DATA POINT FROM THE DATA SHEET"!!!Since dmax / S for the ten readings is 1.96 (see Table 1), the first data point can be eliminated from the dataanalysis, but to determine whether or not the data is Normally (Gaussian) Distributed, the data should now betabulated in rank order with appropriate cumulative percentages and the rejected data points not included:(*Since there are now only 9 data points, the % Below Xi will be in increments of 1/9 X 100 or 11.11%)5
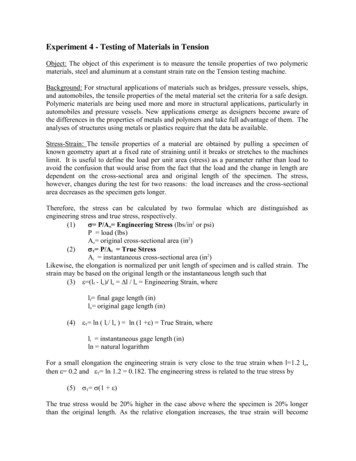
Rank Order123456789Xi (cm)4.594.614.634.644.654.664.684.694.70% Below Xi11.1122.2233.3344.4455.5566.6677.7788.8899.99The data are now plotted on Probability Paper as shown below to evaluate the Normality of the data.The mean value of the revised data set, without the Chauvenet rejected data points included, shouldnow be computed. For this problem,XREV 4.650 cm,if the data is Normally Distributed then an approximately linear fit should pass through 50% very near4.650 cm (see Figure 5). One would conclude that the data appears to be linearly distributed based onthe probability plot shown in Figure 5.Rod Length, Xi (cm)Figure 2 – Example Data Plotted on Probability Paper.6
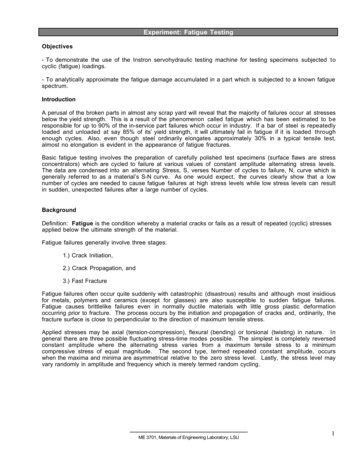
Background - Hardness TestingHardness is a measure of a material’s resistance to localized plastic deformation (e.g., a small dent orscratch). Hardness testing involves a small indenter being forced into the surface of the material being testedunder controlled conditions of load and rate of application. The depth or size of the resulting indentation ismeasured, which in turn is related to a hardness number; the softer the material, the larger and deeper theindentation, and the lower the hardness index number. Measured hardnesses are only relative (rather thanabsolute) thus care must be taken when comparing values determined by different techniques.Macro-Hardness (Rockwell and Brinell) testing is the most commonly applied materials test in industry due toseveral factors:1) Macro-Hardness Testing is simple to perform and does not require highly skilled operators;2) Through the use of different loads and indenters, hardness testing can be used for determining the3)4)hardness and approximate strength of most metals and alloys including soft bearing materials and highstrength steels;Hardness readings can be taken in a few seconds with minimal preparation; andFor Rockwell hardness testing, no optical measurements are required; all readings are direct.There are two common methods applied to measure material hardness macroscopically: Rockwell and Brinell.Rockwell hardness differs from Brinell hardness testing in that the indentation size is measured in Brinelltesting while Rockwell hardness is determined by the depth of the indentation made by a constant appliedload. For thin test samples or samples for which the relatively large Brinell or Rockwell indentations must beavoided, the Superficial Rockwell hardness test is often employed. Superficial Rockwell hardness testingemploys lower loads to the indenter in order to minimize penetration.The Rockwell Hardness Test consists of measuring the additional depth to which an indenter is forcedby a heavy (major) load beyond the depth of a previously applied light (minor) load as illustrated inFigures 6 and 7. Application of the minor load eliminates backlash in the load train and causes theindenter to break through slight surface roughness and to crush particles of foreign matter, thuscontributing to much greater accuracy in the test.The minor load is applied first, and a reference or "set" position is established on the measuring device orthe Rockwell hardness tester. Then the major load is applied at a prescribed, controlled rate. Withoutmoving the workpiece being tested, the major load is removed and the Rockwell hardness number isindicated on the dial gage. The entire operation takes from 5 to 10 seconds.Figure 3 – Diamond-Cone Brale Indenter used in Rockwell Hardness Testing (2X). [Metals Hdbk, 1992]7
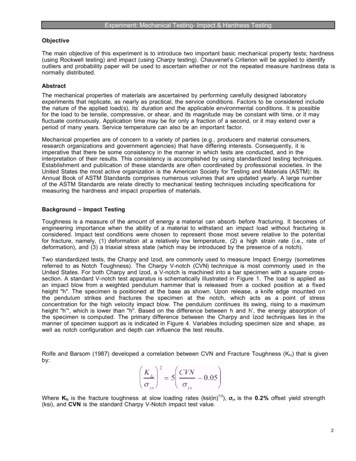
Figure 4 – Indentation in a workpiece made by application of (a) the minor load, and (b) the major load, on a diamond Braleindenter in Rockwell hardness testing. [Metals Hdbk - Desk Edition, 1992].Hardness value based on the difference in depths of indentation produced by minor and major load.Diamond indenters are used mainly for testing materials such as hardened steels and cementedcarbides. Steel-ball indenters, available with diameters of 1/16, 1/8, 1/4 and 1/2 in., are generallyused for testing materials such as soft steel, copper alloys, aluminum alloys and bearings metals.Designations and typical applications of various indentors are listed in Tables 2 and 3.Table 2 – Rockwell Hardness Scale Designations for Combinations of Type of Indenter and Major Load.[Metals Handbook - Desk Edition, 1992]8
Table 3 – Typical Applications of Regular Rockwell Hardness Scales. [Metals Handbood - Desk Edition, 1992]The minor load is always 10 kg in regular Rockwell hardness testing. No Rockwell hardness value isexpressed by a number alone. A letter has been assigned to each combination of load and indenter, asindicated in Tables 1 and 2. Each number is suffixed first by the letter H (for hardness), then the letter R (forRockwell), and finally the letter that indicates the scale used. For example, a value of 60 in the Rockwell Cscale is expressed as 60 HRC, etc. One Rockwell number represents an indentation of 0.002 mm (0.00008in.).Therefore a reading of 60 HRC indicates an indentation from minor to major load of (100 - 60) X 0.002 mm 0.080 mm or 0.0032 in. A reading of 80 HRB indicates an indentation of (130 - 80) X 0.002 mm 0.100 mm.The metal immediately surrounding the indentation from a Rockwell hardness test is cold worked thus multiplereadings cannot be taken at the same point on a material’s surface. If multiple tests are conducted on asingle part the indentations should each be a minimum of 3 indentation diameters apart. The depth ofmaterial affected during testing is on the orde
There are two common methods applied to measure material hardness macroscopically: Rockwell and Brinell. Rockwell hardness differs from Brinell hardness testing in that the indentation size is measured in Brinell testing while Rockwell hardness is determined by the depth of the indentation made by a constant applied load. For thin test samples or samples for which the relatively large Brinell or