Transcription
Cognos 11.1Report Writer BasicsApril 2019
2019 Kent State UniversityThis information is provided by the Division of Information Technology, Kent State Universityand is proprietary and confidential. These materials are made available for the exclusive use ofKent State University employees, and shall not be duplicated, published or disclosed for otherpurposes without written permission.Page 2
Table of ContentsIntroduction .4Accessing Cognos Report Studio.5Report Writer User Interface.8Building a Report.9Adding Data Items .9Validate the Report.10Running a Report.10Report Display .11Saving Reports .12Opening Saved Reports .12Customizing the Report Display.13Edit a Report Title .13Edit a Column Name.14Grouping Results.16Aggregation .17Adding Filters.20Pre-Defined Filters. 20Custom Filters. 21Prompts and Prompt Pages.26Prompt Pages .27Additional Prompts .31Prompt User Interface.35Prompt Sorting . 35Multi-Select . 36Select UI (User Interface for thePrompt List) . 37Prompt Required . 37For additional information regarding Cognos policies and access, or modifications to the ODS,contact the Business Intelligence Team at cognos@kent.edu. For technical assistance, contactthe Help Desk at 330-672-HELP (4357) or support.kent.edu. Additional Cognos training materialsare available at www.kent.edu/it/cognos-resources.Page 3
IntroductionAgendaCognos report Studio is a web-based application designed to allow users to easily createcomplex reports utilizing many different sources of data.The purpose of this training guide is to introduce Report Studio. The course objectives are:Access Report StudioIdentify key areas in Cognos ConsumerExplore Report StudioBuild and format queries in Report StudioAccessing Cognos Report StudioCognos Report Studio is used in both test and production instances to allow for practice increating reports and designing tested and approved reports for public use.Navigating Report StudioCognos Report Studio navigation consists of a selection of Menus, Tools, and Windows to aidthe writing and design of reports.Report Studios ToolbarInsertable Objects WindowWork AreaProperties PaneCreating and Modifying ReportsCreating a ReportEditing TitlesFiltersPrompt PagesSortingPage 4
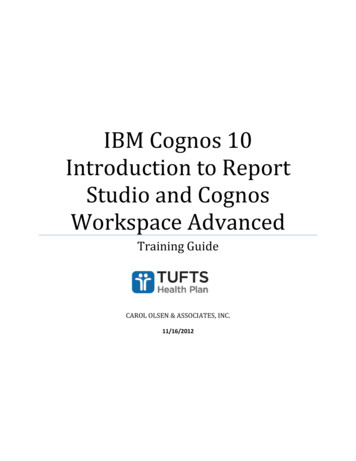
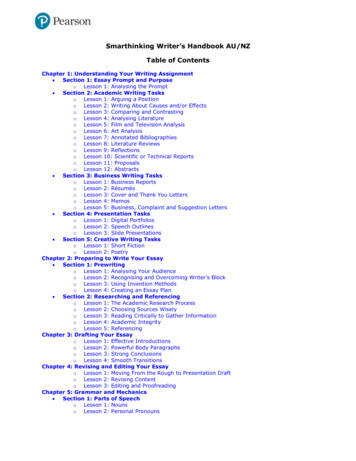
Accessing Cognos Report StudioIf Report Writer access has been granted, users will be able to create new reports and editpersonally saved reports from Cognos as accessed through FlashLine.On the Home screen, a button labeled “New” is located in the bottom of the Navigation Menupanel on the left.Page 5
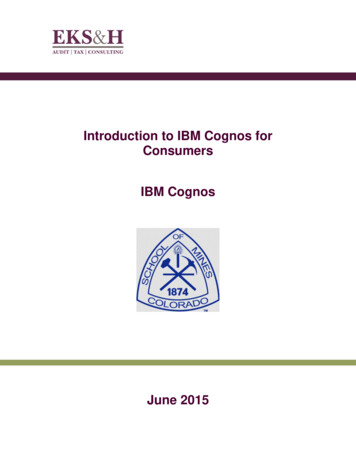
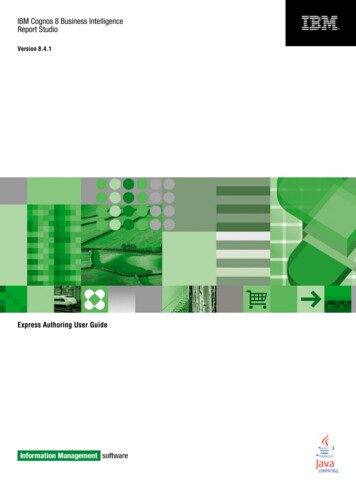
Clicking this button opens a selection panel for choosing what Cognos item is to be created.Clicking on the desired item will display the Templates and themes window for selection from alisting of available preset layout templates and color themes. A blank template will allow for acustom layout.Page 6
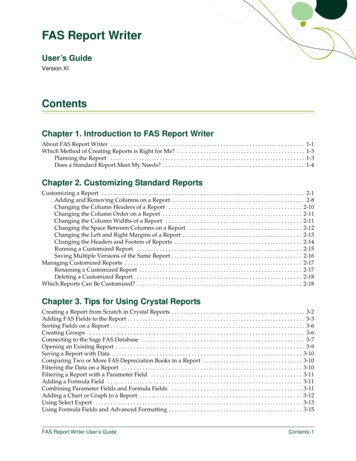
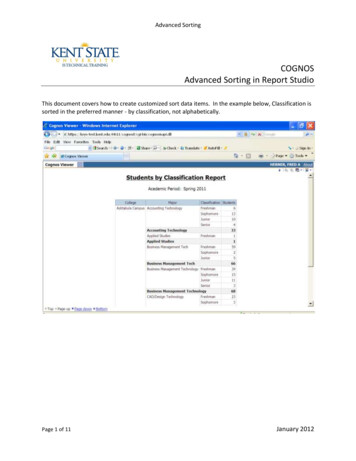
After selecting a report layout, a page will open prompting users to Select sources from whichto retrieve data for the report.Clicking the Select source button allows users to choose from the data packages available tothem as granted by the Security Access Group.Selecting the data package and clicking the Open button will create the report page and allowfor adding objects to build the report.Page 7
Report Writer User InterfaceThe working page is designed in several sections. Across the top of the page is a functionbanner. Directly below is a Navigation Menu banner. To the left is the Insertable Objects pane,and to the right is the Canvas, with an additional toolbar specifically for items placed on thereport canvas.The function banner, across the top of the page, includes several action buttons used increating a report in Cognos.On the left are buttons to save, edit, undo, redo, and run. In the center of the menu banner is adrop-down navigation tool to toggle between documents. On the right is a More button toselect additional options related to the current page, as well as a button to access notifications.Below the menu banner of action buttons is a navigation banner offering access to differentpages and views of the report. Included on the left are a home button, previous and nextbuttons, and a breadcrumb trail. Further to the right are buttons to lock or unlock items in thework area, change the page view, manage items in the report, and set properties.The Insertable Objects pane offers access to data items to be included in the report through thedata sources, data items, and report toolbox.The report Canvas on the right is the building space for the report items to be added. A set ofdesign tools is located in a toolbar at the top of the canvas to design, create, and edit the reportitems and format.Page 8
Building a ReportThe next section contains information on how to build a report. The formatting options thatwill be covered in this section include inserting data items, adding a title, changing columnnames, adding filters and prompts, grouping and aggregation.The first step is deciding what information needs to be displayed in the report. Then, as thereport is created, additional items may be added to enhance the usability of the report.For this example, we will create a report of a Student Count by College and Major.Adding Data ItemsThere are two methods for adding data items to a report; double click or drag and drop.Either of the following steps may be used to add a data item to a report.1. Double click on the data item to insert it into the report. If there are data items in thereport, the data item will be added to the right of a selected column.2. To drag a drop a data item, click on the item from the Insertable Objects Pane and drag itto the right of where the item should be placed.NOTE: The item is in the correct spot when the thin line starts flashing.Page 9
ExampleAdd the following data items to the report from the INSERTABLE OBJECTS PANE, in the SOURCE TAB:1.2.3.4.5.CollegeCollege DescriptionMajorMajor DescriptionPersonal University ID (or PIDM) – (Person UID PIDM, the ID KSU ID)NOTE: When adding data items, the Code item is more efficient for a query than theDescription. It is best to sort and retrieve data using the Code, and display using the Description.Validate the ReportBefore a report is run, it is suggested to validate the report to ensure it contains no errors.Clicking the Manage Report buttonValidate option.opens a drop-down selection panel to access theIf no errors are present, the report can be run to view the results in a report format.Running a ReportBecause the report data is used at the university in many differentways, various report formats are often desired. For this, reports can beproduced in a variety of formats, depending on the need of the user.Clicking on the Run Options buttonopens a menu of reportformat options to be retrieved. A saved report may be rerun in adifferent format at any time.Additionally, at the bottom of the run menu is a selection noted asShow Run Options, which will allow users to set default settings forthe output of a report.Page 10
Report DisplayLinks at the bottom allow for navigation through the pages of the report.The report retrieves the data based upon the report page.Though the Code Items work best for retrieving data, they may not be helpful being displayedon the report itself. These items can be removed from the Report Page without being removedcompletely from the report.CLICK in the column body to select the entire column, andreveal a pop-up options window. Select CUT from theoptions.Using the Cut feature will remove the Code Item only fromthe Report Page. Using the Delete function would remove thequery from the report entirelyPage 11
Saving ReportsSaving report versions allows report writers to revisit previous levels of report creation withoutthe need to develop reports from step one.Clicking on the Save iconandselecting Save As allows users to savethe current report view in a specifiedlocation. It is recommended to saveitems in the My content folder andnaming the report for future access.Opening Saved ReportsOnce a report has been saved to the My Folders tab, it can be easily accessed to be run basedon updated data, or opened to be edited or modified, among other options, by clicking themore options, or 3-ellipses button and selecting from the dropdown list.Page 12
Customizing the Report DisplayEdit a Report TitleReport Studio allows the author to add and format report titles and column headers for acustomized report view that is easier to read. The report title is referred to as the Page Headerand can be added by clicking the Page Ellipses button, choosing the Headers & footers option,and selecting Page header & footer.If a pop-up window appears, the check box can be selected for Header, and clicking the OKbutton will create the Title Header on the report page.A Header Insert button will appear at the top of the report page. The type of header can bechosen by clicking the button.Page 13
A variety of items will appear for selection. Most commonly the Text item is used, and aHeading can be typed in.Edit a Column NameTo make the data more professional, column headers may be changed to reflect the data.Click on the column header to be changed. The propertiesfor the cell will appear in the Properties Window.In the Source Type selection, click on the label to reveal theoptions drop-down box and select the option for Text.Page 14
The column heading will change to a messageindicating to double-click to edit the text.A Text box will open for the entry of the newcolumn heading.Continue through the remaining columnheadings as necessary.It may also be helpful to organize the ReportPage. Selecting the column body, clicking onthe SORT BUTTON in the Toolbar, and choosingASCENDING wil assure the column is presentedin alphabetical order.This yields a more easily readable report.Page 15
Grouping ResultsGrouping data in the Report page,simplifies the report by showing eachitem only one time.Click in the column for the data groupitem. Use the Structure option in theMenu Bar or click on the Group/Ungroupbutton in the toolbar to show the sameitems together.Continue to group additional data items as needed to create sub-groups.The page is now grouped first by College, and then each College is grouped by Major. When thereport is run the results will display the grouping.Page 16
AggregationOne of the features of Cognos Report Studio is the ability to Aggregate, or summarize, datafrom grouped items. This helps the user more easily analyze the data.Some of the more common types of aggregation are:1.2.3.4.5.TotalAverageMinimumMaximumCountSums the items in the groupAverages the items in the groupDisplays the lowest number in the groupDisplays the highest number in the groupcounts the number of items in the groupOne way to add aggregation is to edit the properties of the data in the e Prop
Cognos Report Studio navigation consists of a selection of Menus, Tools, and Windows to aid the writing and design of reports. Report Studios Toolbar Insertable Objects Window Work Area Properties Pane . Creating and Modifying Reports . Creating a Report Editing Titles Filters Prompt Pages Sorting . Page 4