Transcription
March 10, 2017Standard NewsletterMy Favorite Small-Cap StockThe market now seems to be entering into a consolidation mode. The S&P 500 isup over 15% since the election of Donald Trump. The new resistance on the DJIAappears to be 21,000, while the new support level would seem to be 20,000. MyJanuary 17 article on Seeking Alpha outlined my current target price for themarket going forward.My weekly newsletter gave a BUY SIGNAL on the market back on March 27th of2009. That BUY SIGNAL has remained in place ever since, but at some point thenewsletter will give a SELL SIGNAL. I talk about the market and my favoritestocks on my daily Nationwide Best Stocks Now Radio Show.Recent “blowout” jobs numbers would almost seem to insure a March rate hike bya now hawkish Fed. The bond market continues to look awful! I hope you heededmy major bond market warning back in the summer of last year.Small-cap stocks have been under some pressure recently. I see value there,however. Here is my current favorite small-cap stock now 1
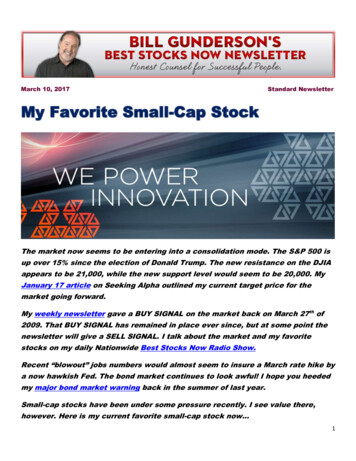
For whatever reason, U.S. small-cap stocks have come under some pressure recently.It is more than likely because of rising interest rates. Much of what President Trump is doingshould be very beneficial for small-cap stocks, however. Regulation reform, healthcarereform, and a more competitive tax structure should all help this all-important sector of oureconomy.I like to combine performance with growth and value in my methodology of selecting stocks.The value part of the equation is getting harder and harder to find. After all, the S&P 500 isnow up over 15% since election-day. The market currently trades at a forward PE ratio of17.8. This is the highest level since 2004. If the market can achieve the earnings growth that isexpected this year and next, then it can support a continued bull market, however.I have given many examples of stocks that I still find to possess those rare qualities ofperformance plus value, however. Last week, I wrote about two healthcare stocks that standto benefit from an overhaul of Obamacare. They both broke out to new highs this pastweek.I wrote about my favorite cheap large-cap stock last week. It also had another terrific week.Back on January 23rd of this year, I wrote about my current favorite stock. It continues to doextremely well. I have also written many articles in-between. You can follow me on SeekingAlpha or on Stocktwits @BillGunderson.As I mentioned before, this week I want to write about my favorite small-cap stock. FortCollins, CO is not exactly a hot-bed for technology companies, but it is home to AdvancedEnergy Industries (AEIS).2
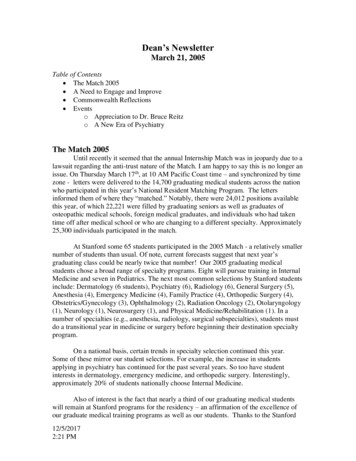
This small-cap company has current market capitalization of about 2.5 billion and theymanufacture power conversion products that transform power into usable forms.Data from www.beststocksnowapp.comThis stock has been a stellar performer. Just look at the alpha that the stock has deliveredover the last one, three, five and ten years. It currently earns a proprietary performancegrade of “A” and a momentum grade of “A ”.Data from www.beststocksnowapp.com3
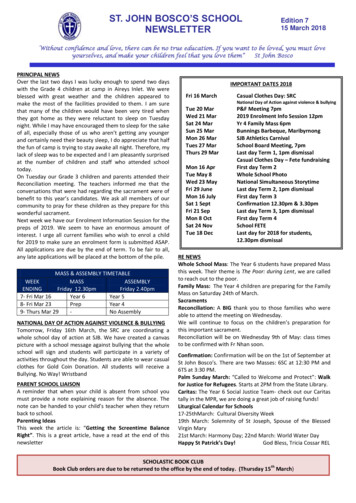
Past performance is one thing, what about the future potential for the shares, however? Weturn to its current valuation and analysts expectations for that. So, here we go.Data from www.beststocksnowapp.comThe company has been growing earnings at an average annual pace of 33% per year overthe last five years. Analyst’s expectations continue to be quite optimistic for the next fiveyears. I have tempered my numbers quite q bit. I learned to be conservative in my estimatesduring my short stint as an analyst.Even with tempered down numbers, I come up with a five year target price of 120 on theshares. That represents 85.7% upside potential five years from now. The forward PEG ratio onthe shares currently calculates out at 0.36. There is obviously a wide margin in there for errorwith the stock trading at only 17X forward earnings.4
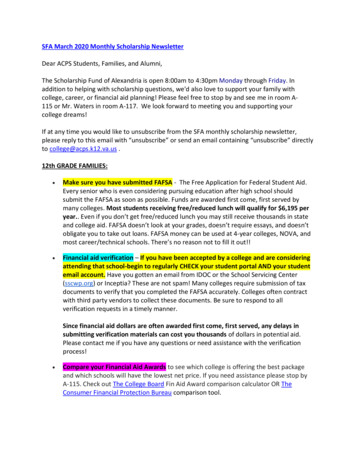
The chart of AEIS has pretty much followed the growth in earnings over the years. It broke outagain to new highs on Friday.The five year average annual return of the shares has run pretty much in sync with itsaverage annual earnings growth. It is funny how those two numbers seem to go hand inhand.Advance Energy Industries (AEIS) is currently ranked at number 94 out of 4,180 stocks, elf’s,mutual funds, and closed end funds in my database. It is also one of the stocks that Icurrently own in my Ultra Growth Portfolio.Data from www.beststocksnowapp.com5
Here is how the market fared this past week:AssetFri. 3/3/17Fri. 372.60-10.52Change-0.44%Inverse S&P 500 (SH)34.2634.370.110.32%Forward PE of S&P .73-0.49%NASD5870.755861.73-9.02-0.15%S&P600 (Small) SML849.29830.39-18.90-2.23%S&P400 (Mid-Cap) MID1739.321710.91-28.41-1.63%Tot.Wld Stock Index (VT)65.0764.89-0.18-0.28%Emg. Mkts (VWO)38.9438.64-0.30-0.77%Em Mkt Sm. Cap (DGS)43.6643.50-0.16-0.37%Europe (VGK)50.3850.510.130.26%India (INP)70.3470.640.300.43%China (FXI)37.8737.65-0.22-0.58%China "A" Shares (ASHR)24.8924.72-0.17-0.68%Canada (EWC)26.8426.54-0.30-1.12%Russia (RSX)20.5619.50-1.06-5.16%Brazil (EWZ)38.5837.10-1.48-3.84%Latin America (ILF)31.7930.72-1.07-3.37%20 Yr. U.S Treas. (TLT)119.35117.25-2.10-1.76%High Yield Bond Index (HYG)87.9986.34-1.65-1.88%7-10 Yr. U.S Treas. (IEF)104.57103.97-0.60-0.57%U.S. 10yr. Tr. Yield TNX2.49%2.58%0.09%0.09%German 10yr. Tr. Yield0.36%0.49%0.13%0.13%Japan 10yr. Tr. Yield0.08%0.09%0.01%0.01%Greece 10yr. Bond7.05%7.19%0.00%0.14%Brazil 10yr. Bond10.24%10.26%0.02%0.02%U.S Dollar Gold GOLD1235.001204.50-30.50-2.47%The big story of the week was the plunge in oil prices and the big drop in the bond market.This served to keep a lid on the U.S. equity market. Maybe the DJIA is finally finding a newresistance level at 21,000?Crude oil was down a whopping 9% for the week. I have been saying that OPEC cuts werebeing met with increases in U.S. production. Interest rates finally broke above their resistancelevel of 2.5%. They closed the week at 2.58%, and they look like they are headed for 3%. TheFED remains very hawkish. Blowout jobs numbers only served to insure a March rate hike bythe Fed. The European market continues to break out. The ECB remains DOVISH!6
Here is where the market stand year to date:AssetFri. 12/31/16 Fri. 29.18%11.35%-0.73%9.54%5.97%Inverse S&P500 (SH)36.5434.37-12.46%-5.94%Forward PE (3,800) 89%S&P600 .90%S&P400 8%3.02%Tot World Stock Index . Mkts Em Mkt Sm. Cap 2%Europe (VGK)47.9450.51-3.89%5.36%India %China China "A" Shares 42%Canada ussia Brazil %Latin America 39%20 Yr. U.S Treas. 58%High Yield Bond Index (HYG)86.5586.34xxxx7.41%-0.24%7-10 Yr. U.S Treas. %U.S. 10yr. Tr. Yield S Dollar 2%The S&P 500 is now up 5.97% year to date. The market is currently trading at a forward PEratio of 17.8X. Maybe 18X is now the valuation ceiling? That is the number that I have beenusing. In the short-term, the market continues to be pricey. The market has not been thisexpensive since 2004. Can it support higher prices? We will look at that in the Big Pictureportion of this week’s newsletter.The Dow is now up 5.77% for the year. U.S. small-caps are now slightly negative for the year.It appears to me that they are being passed over by the index investors that are gobbling upthe Large Caps.Emerging markets are now up 8.0%. The U.S. bond market is now NEGATIVE for the year.7
BILL GUNDERSON’S WEEKLY TECHNICAL ANALYSIS OF THE MAJOR INDEXESTechnical analysis is one of the three legs of the stool that I like to stand on. Theother two are Valuation and Momentum.It now appears that the S&P 500 is THIS SECTION IS FOR CLIENTS AND SUBSCRIBERS ONLY. FOR MORE INFO CLICK HEREHere is the current ranking of the 34 asset classes that I track on a daily basis. I am not anasset allocator. I believe in being invested in the best asset classes, not the worst ones.Top 10 (3 wks. ago)Top 10 (2 wks. ago)Top 10 (This week)THIS SECTION IS FOR CLIENTS AND SUBSCRIBERS ONLY. FOR MORE INFO CLICK HEREHere are this week’s worst ranked asset classes. Avoid these neighborhoods.Bottom 10 two weeks agoBottom 10 last weekBottom 10 this week8
Here is this week’s all-important ranking of the 77 indexes that I track on a daily basis: GRADING LEGEND(A ) BEST (A) Strong Buy (A-) Buy (B ) Weak Buy (B) Strong Hold (B-) Hold (C ) WEAK HOLD (C) SELL(C-) Strong Sell (D ) Weak SHORT (D) SHORT (D-) Strong Short (F ) Horrible (F) WorstBEST two weeks ago (Top 10)Top Ten last weekTop Ten this weekTHIS SECTION IS FOR CLIENTS AND SUBSCRIBERS ONLY. FOR MORE INFO CLICK HERELeveraged Indexes-this really magnifies where the top indexes are. (When there are some)2 Wks. agoLast weekThis weekTHIS SECTION IS FOR CLIENTS AND SUBSCRIBERS ONLY. FOR MORE INFO CLICK HEREHere are this week’s ten bottom ranked indexes. These are the ones to avoid.Worst Indexes 2 weeks agoWorst Indexes last weekWorst Indexes this week9
Here is my current ranking of the sixty sectors that I track on a daily basis. It is vital to be inthe right sectors in the market.Top 10 three weeks agoTop 10 two weeks agoTop 10 this weekTHIS SECTION IS FOR CLIENTS AND SUBSCRIBERS ONLY. FOR MORE INFO CLICK HEREThe ranking of the leveraged sectors also magnifies where the leading sectors are:2 Wks agoLast weekThis weekTHIS SECTION IS FOR CLIENTS AND SUBSCRIBERS ONLY. FOR MORE INFO CLICK HEREHere are this week’s bottom ranked sectors. It is just as important to stay out of the worst onesBottom 10 Two Weeks AgoBottom 10 Last WeekBottom 10 This WeekWOULD YOU LIKE TO SET UP A PHONE APPOINTMENT WITH BILL GUNDERSON? YOU CAN TALK TOME DIRECTLY ABOUT YOUR PORTFOLIO OR THE MARKET IN GENERAL. GIVE US A CALL AT 855611-BEST OR CLICK HERE.10
I sent out many PUSH NOTIFICATIONS for PREMIUM app subscribers this past week. Thisservice is now available for iOS Apple, Android, and WEB premium app subscribers. Inaddition to the push notifications, we are also now sending out accompanying emails. Thesepush notifications are instantaneous. This is really remarkable technology.If you are having any trouble receiving the notifications, contact me directly atbill@Gundersoncapital.com I have a great technical support dept. that will get right on itand help you. I aim to please all subscribers to my services!THE PREMIUM SUBSCRIPTION GIVES YOU ACCESS TO ME VIA EMAIL. I WILL DO MY BEST TORESPOND TO YOUR QUESTIONS ABOUT THE MARKET JUST AS QUICKLY AS I CAN. I AM HERE TOHELP! I AM FISHING THESE WATERS EVERY DAY OF MY LIFE“Live trading” notifications are now available on the web based app.www.beststocksnowapp.com. You do not need a smart phone to receive these e-mails. Theycome via your laptop, tablet, or PC.The cost for live trading notifications is 89 per month. This also includes my weekly clientnewsletter. This service is not included in the free version of the app or the 9.99 monthlysubscription to the app.I do not tweet live trades any more. I still send out several per day however, on stocks thatreally look outstanding. Here is a segment from a recent show, explaining how this “livetrading” service works.11
THIS WEEK’S BOTTOM LINE MARKET FORECAST by Bill GundersonEarnings season is THIS SECTION IS FOR CLIENTS AND SUBSCRIBERS ONLY. FOR MORE INFO CLICK HEREPlease follow me on Twitter or Stocktwits @BillGunderson throughout the week for anychanges in my current stance on the market or individual stocks. My tweets are also foundon my BEST STOCKS NOW app every day, and on the homepage of my website:http://www.GundersonCapital.com12
I consider this my flagship portfolio. This model is made up of large-cap companies that I deemsuitable for investors who have a conservative growth risk profile. Time horizon of at least 3-5 yearswould be appropriate. 5-10 YEARS IS EVEN BETTER! Investors need to be able to ride through swings upor down of at least 10-25% along the way, however. Unforeseen world events are also always a risk! Ifappropriate, bonds, a high degree of cash, or inverse funds could be included in this portfolio. This inan actively managed portfolio.This portfolio is now up 66.38% since its Jan. 1, 2010 inception (after all fees and expenses). It has alsobeen protected by me several times along the way from that bear looming out there somewhere. Ibelieve in Growth with Vigilance along the way. It is now up 5.37% ytd. This is net of a maximumannual mgt. fee of 2% and all 3.50 trades. I sold THIS SECTION IS FOR CLIENTS AND SUBSCRIBERS ONLY. FOR MORE INFO CLICK HERETHE AVERAGE DIVIDEND YIELD OF THE STOCKS IN THIS PORTFOLIO IS NOW 7.32%. This portfolio is forinvestors seeking Income along with the possibility of Growth. This is a good mix for retirees who areseeking a CD or Bond alternative-albeit with greater risk. This is my MOST CONSERVATIVE overallportfolio. Still, investors need to be able to handle up to, or even greater than 10-25% swings up ordown. Again, unforeseen world events are always a risk. If appropriate, this portfolios could containbonds or inverse funds.This portfolio had a bad week with the big drop in oil prices and the big jump in interest rates. It is nowup 1.52% YTD after all expenses. I sold THIS SECTION IS FOR CLIENTS AND SUBSCRIBERS ONLY. FOR MORE INFO CLICK HEREThis is my new portfolio. I merged the moderate risk with the aggressive growth portfolio. It is designed forinvestors with long-term time horizons, seeking maximum growth. It is also my most AGGRESSIVE and VOLATILEportfolio. Investors need to be able to stomach as much as 10-35% swings or higher from time to time in anultra-growth style of investing. This portfolio goes anywhere in the world, wherever the action is. It can containstocks of any size.This portfolio is now up 4.82% YTD. This portfolio was down about 1% this past week on the sell-off in small-caps. Ibought THIS SECTION IS FOR CLIENTS AND SUBSCRIBERS ONLY. FOR MORE INFO CLICK HERE13
This is my “PLAY” account. For the most part, these stocks are too small or too thinly tradedfor my managed accounts. This is not a day-trading account. I am looking to bag some bigwinners, while keeping a short leash on my positions.This portfolio had another bad week. This is an extremely volatile portfolio. It is not for the faintof heart. I am looking for several big winners in it this year. My seven trades in a row winstreak finally came to an end this past week. I bought THIS SECTION IS FOR CLIENTS AND SUBSCRIBERS ONLY. FOR MORE INFO CLICK HEREThis is my new portfolio. I merged the mutual fund with the ETF portfolio. It is designed for investors with long-termtime horizons, seeking maximum growth. Investors need to be able to stomach as much as 10-35% swings orhigher from time to time in a growth style of investing. This portfolio goes anywhere in the world, wherever theaction is.This portfolio is now up 5.34% YTD. I THIS SECTION IS FOR CLIENTS AND SUBSCRIBERS ONLY. FOR MORE INFO CLICK HERE14
Current Best Mutual Funds Now Top ranked funds 2 wks ago.Top ranked funds last week.Top ranked funds this week.THIS SECTION IS FOR CLIENTS AND SUBSCRIBERS ONLY. FOR MORE INFO CLICK HEREFund Rank 10-20 2wks agoFund rank 10-20 last weekFund rank 10-20 this week.15
Bottom ranked funds 2 wks agoLeading ETFS 2 weeks agoBottom ranked funds last weekLast week’s top ten ETF’sBottom ranked funds this week.This weeks leading ETF’sTHIS SECTION IS FOR CLIENTS AND SUBSCRIBERS ONLY. FOR MORE INFO CLICK HERE16
ETF 11-20 two weeks agoETF 11-20 last weekETF 11-20 this weekWorst ETFS 2 weeks agoLast week’s worst ETF’sThis weeks worst ETF’s17
BASIC 401-K ALLOCATIONTHIS SECTION IS FOR CLIENTS AND SUBSCRIBERS ONLY. FOR MORE INFO CLICK HEREU.S. Small Cap Growth0.0%U.S. Mid Cap Growth0.0%U.S. Small Cap ValueU.S. Mid Cap ValueU.S. REIT’s0.0%U.S. Govt. BondsDeveloped International0.0%Emerging Markets Stocks0.0%0.0%U.S. Large Cap GrowthU.S. Large Cap Value0.0%0.0%0.0%U. S. Corp. Bonds0.0%0.0%Emerging Market Income0.0%Natural Resources/Energy0.0%Precious Metals0.0%Technology0.0%Money Market (CASH)0.0%Europe0.0%Asia/China0.0%Healthcare Sector0.0%Inverse (if available)0.0%Leveraged U.S. Stock Indexes 0.0%TSP Plans or Basic 401-k plansMany folks have a very limited selection of choices in their retirement plans. This is my current recommendationfor such basic plans. Lowering THIS SECTION IS FOR CLIENTS AND SUBSCRIBERS ONLY. FOR MORE INFO CLICK HEREU.S. Lg. & Midcap Stocks0.0%C FundU.S. Sm. & Mid-Cap stocks0.0%S FundU.S. Bonds (CASH)0.0%G Fund (Government Securities)Bond Fund0.0%International Dev. Mkts.0.0%0.0%Asset Allocation0.0%L fundF Fund (Govt. Bonds, Mortgage bonds, and Corp. Bonds)I Fund18
Looking for a Hedge? Here is my current ranking of inverse (Bearish) ETF’s:Two Weeks AgoLast week.This week.Leveraged Inverse Rankings2 Wks agoLast weekThis week19
Bill Gunderson is a professional fee-based money manager. Gunderson CapitalManagement manages hundreds of accounts all across the country. Minimum account sizeis 100,000. Annual Mgt. fees are 2% on accounts under 250,000, 1.5%-1.75% on accountsbetween 250k and 1 million, and 1%-1.25% on accounts over 1 million. Call us for aportfolio evaluation and more info. (855)611-BEST.To view this past week’s show archives click hereBILL GUNDERSON’s WEEKLY TOP 200 LISTTwo Weeks agoLast WeekThis WeekThis is just an appetizer, here is the full list.THIS SECTION IS FOR CLIENTS AND SUBSCRIBERS ONLY. FOR MORE INFO CLICK HERE20
Bill Gunderson'sBest Stocks NowTop 200 as of Friday 3/10/2017One Yr.6 Mos3 MosEightSixFourThreeTwoOneYear Ago Year Ago Mos. Ago Wks. Ago Wks. Ago Wks. Ago Wks. Ago Wks. Ago Wk. Ago Yest. 89190191192194195196197198199200HEDJ 61.15B Europe Hedged Index34802562415485295167198759158AET 132.80B Aetna Inc152817463017231612588451602224FIS 82.23B Fidelity National Information S516547717150636012267965153RP 34.75B Realpage 93950283389040773678403234122300231EA 89.81B Electronic ArtsELLI 99.09B Ellie MaeKITE 83.98B Kite PharmacueticalHTD 24.15B John Hancock Tax Advantage Dividend Income287100919515212718692761RCL 97.25B Royal Caribbean Cruises19892001378411256282111443AAPL 139.14B Apple Computer6781081617388715243252576237STMP 130.00B Stamps.com Inc906392278360334316641840185SPLP 18.30B Steel Partners Hldgs LP37501244312033493477331024371966105VDC 141.56B Vanguard Cons. Staples959271529635657335208589
March 10, 2017 Standard Newsletter My Favorite Small-Cap Stock The market now seems to be entering into a consolidation mode. The S&P 500 is up over 15% since the