Transcription
July 29, 2017STANDARD NEWSLETTERWHAT HAPPENED TO AMAZON?As a professional money manager, one of the biggest questions for me from this last week oftrading is should I keep my Amazon stock or not?In the meantime, it was an extremely busy week in the market. Dow stocks like Caterpillar(CAT), McDonald’s (MCD), and Boeing (BA) helped propel the Dow Jones IndustrialAverage to new all-time highs!In fact, I would call Boeing the stock of the week. I continue to own it in my Income &Growth Portfolio.Facebook posted very impressive earnings earlier in the week. The stock continues to hit newall-time highs and I continue to own it in my Premier Growth Portfolio. The NASDAQ washitting new all-time highs on Thursday before a very dramatic intra-day turnaround to thedownside. It seemed to center around Amazon. Just exactly what took place?The Minnesota Workshop scheduled for Sept. 13 is coming together. It will be in theBloomington area, and we will be inviting several of our best friend in Minnesota to theTwins vs, Padre game the night before. Stay tuned 1
With 57% of the companies in the S&P 500 having now reported earnings, 73% of them havebeat their expectations, while 73% have also beat their revenue expectations. The latternumber is extremely good!You will see later in the newsletter where my current EPS estimates and target prices for theS&P 500 are currently at. It has been earnings that have driven this market higher for overeight years. It will be the direction of future earnings forecasts that will either drive this markethigher or set off the next bear market.That is why I update the overall earnings picture each and every week in my newsletter. Thiswas one of the most important factors that led me to make my Bull call back on March 27th,2009. The market has more than tripled since then. This all-important weekly market call isavailable to my clients, live-trading, and premium subscribers only.As usual, there were some good, some bad, and some ugly earnings reports this past week.Facebook (FB), Caterpillar (CAT), and Boeing (BA) all knocked the cover off of the ball. Iupdate my current status and target prices on these stocks when I get to the individualportfolios.These five model portfolios are available to my client and “live-trading” subscribers only.Over 130 S&P 500 stocks will report earnings this coming week. I will be on top of it each dayon my Gunderson Best Stocks Now Radio Show.Vertex Pharmaceutical, Google, Lam Research, Starbucks, and STM electronics alsoreported earnings this past week. I kept four of them and dumped one. I am now up over100% on my STM position. It is one of the 30 stocks that I currently own in my Ultra GrowthPortfolio. This portfolio is having an extremely good year.John McCain single handedly shot down even a skinny repeal of Obamacare. Did McCainvote no to get even with Trump, or did he vote no in the best interest of the country? Itmakes one wonder if the Republicans can get anything done, especially badly needed taxreform.An analyst at Stifel admits that he made a big mistake in putting a BUY recommendation onGE several months ago, but he continues to maintain that same BUY recommendation. Saywhat?Another one of my holdings in the Ultra Growth Portfolio blasted off to new highs after astunning earnings report. More on that in the portfolio section of the newsletter. But, the storyof the week was Amazon (AMZN). What exactly happened on Thursday and Friday?I am working on a special report that will detail the issue at Amazon in their latest earningsreport. This will go out to clients and all newsletter subscribers when I finish it tomorrow orMonday. I am taking a deep dive into the numbers.2
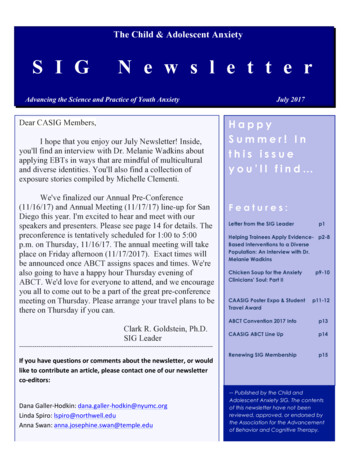
Here is how another record breaking week in the market verse S&P 500 (SH)32.8232.840.020.06%Forward PE of S&P 16%NASD6387.756374.68-13.07-0.20%S&P600 (Small) SML868.25865.00-3.25-0.37%S&P400 (Mid-Cap) MID1773.921762.34-11.58-0.65%Tot.Wld Stock Index (VT)69.1669.310.150.22%Emg. Mkts (VWO)42.6042.940.340.80%Em Mkt Sm. Cap (DGS)47.6647.780.120.25%Europe (VGK)56.3856.540.160.28%India (INP)81.0482.311.271.57%China (FXI)42.0442.420.380.90%China "A" Shares (ASHR)27.9428.030.090.32%Canada (EWC)27.8027.900.100.36%Russia (RSX)20.0019.98-0.02-0.10%Brazil (EWZ)37.0637.390.330.89%Latin America (ILF)32.5332.760.230.71%20 Yr. U.S Treas. (TLT)125.69123.89-1.80-1.43%High Yield Bond Index (HYG)88.7388.910.180.20%7-10 Yr. U.S Treas. (IEF)107.14106.62-0.52-0.49%U.S. 10yr. Tr. Yield TNX2.23%2.29%0.06%2.69%German 10yr. Tr. Yield0.51%0.54%0.03%0.03%Japan 10yr. Tr. Yield0.07%0.08%0.01%0.01%Greece 10yr. Bond5.26%5.38%0.12%0.12%Brazil 10yr. Bond10.05%10.01%-0.04%-0.04%U.S Dollar ld GOLD1255.001275.6020.601.64%Overall, it was another record breaking for the stock market, although the NASDAQ pulledback a little bit just as I expected. Don’t look now, but the Dow, led by Boeing (BA) is closingin on 22,000, while the S&P 500 is closing in on 2,500.Emerging Markets led by India also had a good week. Meanwhile the bond market driftedlower as interest rates drifted higher and oil had one of its best week in a long, long time. It isvery difficult to predict the direction of commodity prices, especially when the suppliers areallowed to tighten or loosen the spigot to manipulate prices.3
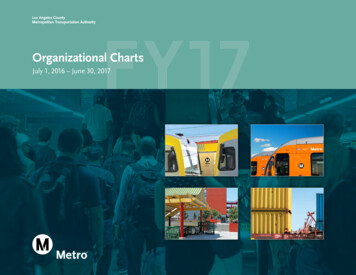
Here is where the market stands year to date.AssetFri. 12/31/16 .41%29.18%11.35%-0.73%9.54%10.42%Inverse S&P500 (SH)36.5432.84-12.46%-10.13%Forward PE (3,800) 8.42%S&P600 23%S&P400 8%6.12%Tot World Stock Index g. Mkts %Em Mkt Sm. Cap 7%Europe (VGK)47.9456.54-3.89%17.94%India %China %China "A" Shares (ASHR)23.4528.0316.00%-5.14%51.18%-24.81% -16.19%19.53%Canada ussia Brazil EWZ)33.7437.3923.65%-3.85%-18.17% -43.45%61.22%10.82%Latin America (ILF)27.5832.761.70%-15.51%-16.47% -33.39%30.16%18.78%20 Yr. U.S Treas. 0%High Yield Bond Index (HYG)86.5588.91xxxx7.41%2.73%7-10 Yr. U.S Treas. U.S. 10yr. Tr. Yield .S Dollar l53.8249.795.21%-2.07%-42.97% 4.38%8.56%10.80%-10.37%The S&P 500 is now up 10.4% year to date, while the Dow is up 10.5%. Meanwhile, U.S. smallcap stocks are up just 3.2% for the year. Emerging markets are now up 20% overall with India(INP) being the best performer with an YTD return of 31.5%.The U.S. Ten Year treasury (IEF) is now up just 1.7% for the year. The prospects for the bondmarket continue to look very bad to me. Oil is now down 7.5% for the year, but it had a verygood week.4
BILL GUNDERSON’S WEEKLY TECHNICAL ANALYSIS OF THE MAJOR INDEXESTechnical analysis is one of the three legs of the stool that I like to stand on. Theother two are Valuation and Momentum.Every week I update my technical analysis of the S&P 500, DJIA, NASDAQ, Emerging Markets,Europe, Bonds, Interest Rates, Crude oil, Gold, the U.S. dollar etc. Many times it is throughtechnical analysis that trouble or good things begin to show up. I have been using technicalanalysis in my research for over 25 years.My weekly technical analysis is available to newsletter subscribers and clients only.Here is the current ranking of the 34 asset classes that I track on a daily basis. I am not anasset allocator. I believe in being invested in the best asset classes, not the worst ones.Top 10 (3 wks. ago)Top 10 (2 wks. ago)Top 10 (This week)The weekly ranking of the asset classes, world indexes, leverage indexes, sectors, andleveraged sectors is extremely important in spotting the best and worst neighborhoods in themarket at the current time.THESE WEEKLY RANKINGS ARE AVAILABE TO CLIENTS AND NEWSLETTER OR APP SUBSCRIBERSONLY.WOULD YOU LIKE TO SET UP A PHONE APPOINTMENT WITH BILL GUNDERSON? YOU CAN TALK TOME DIRECTLY ABOUT YOUR PORTFOLIO OR THE MARKET IN GENERAL.DO YOU HAVE A FINANCIAL PLAN? IF NOT, WHY? How can you arrive at a destination withouta roadmap and periodic checkups? Call (855)611-BEST or Contact us here.Why not take advantage of Bill Gunderson’s 20 years plus of experience in the business tocreate a roadmap for you? Bill and his team are great coaches to have along the way!I sent out many PUSH NOTIFICATIONS for PREMIUM app subscribers this past week. Thisservice is now available for iOS Apple, Android, and WEB premium app subscribers. Inaddition to the push notifications, we are also now sending out accompanying emails. Thesepush notifications are instantaneous. This is really remarkable technology.If you are having any trouble receiving the notifications, contact me directly atbill@Gundersoncapital.com I have a great technical support dept. that will get right on itand help you. I aim to please all subscribers to my services!THE PREMIUM SUBSCRIPTION GIVES YOU ACCESS TO ME VIA EMAIL. I WILL DO MY BEST TORESPOND TO YOUR QUESTIONS ABOUT THE MARKET JUST AS QUICKLY AS I CAN. I AM HERE TOHELP! I AM FISHING THESE WATERS EVERY DAY OF MY LIFE5
“Live trading” notifications are now available on the web based app.www.beststocksnowapp.com. You do not need a smart phone to receive these e-mails. Theycome via your laptop, tablet, or PC.The cost for live trading notifications is 89 per month. This also includes my weekly clientnewsletter. This service is not included in the free version of the app or the 9.99 monthlysubscription to the app.I do not tweet live trades any more. I still send out several per day however, on stocks thatreally look outstanding. Here is a segment from a recent show, explaining how this “livetrading” service works.BILL GUNDERSON’S CURRENT EPS AND TARGET PRICE FORECAST FOR THE S&P 500.As of today with 57% of the companies in the S&P 500 having reported earnings for thesecond quarter of 2017 THIS IS THE MOST IMPORTANT SECTION OF MY WEEKLY NEWSLETTER! THE MARKET FOLLOWSEARNINGS. EACH WEEK I UPDATE MY EARNINGS ESTIMATES AND TARGET PRICES FOR THEMARKETS.I AM A MARKET TIMER. I AM NOT A PERMABULL. MY NEWSLETTER GAVE OUT A BUY SIGNAL ONMARCH 27TH, 2009. THE MARKET HAS TRIPLED SINCE THEN. HOW IMPORANT WAS THE TIMELYCALL TO INVESTORS.THIS SECTION OF THE NEWSLETTER GIVE WEEKLY BUY OR SELL SIGNALS ON MARKETS, BONDS,COMMODITIES, ETC.THIS SECTION OF THE NEWSLETTER IS AVAILABLE TO CLIENTS, NEWSLETTER SUBSCRIBERS, ANDAPP SUBSCRIBERS ONLY.6
You can follow me on Twitter or Stock twits @Bill Gunderson throughout the week for my comments onindividual stocks or on the markets. My tweets are also found on my BEST STOCKS NOW app every day, and onthe homepage of my website: http://www.GundersonCapital.com7
This is my new portfolio. I merged the moderate risk with the aggressive growth portfolio at the beginning of lastyear. It is designed for investors with long-term time horizons, seeking maximum growth. It is also my mostAGGRESSIVE and VOLATILE portfolio. Most of the stocks in this portfolio come from the S&P400 and S&P 600.Investors need to be able to stomach as much as 10-35% swings or higher from time to time in an ultra-growthstyle of investing. This portfolio goes anywhere in the world, wherever the action is. It can contain stocks of anysize, but I mostly focus on small and mid-cap stocks with it.This portfolio is now up 19.0% YTD after all fees. It is up 21.3% before fees. By contrast, the U.S. small-cap index isup only 3.2% this year. This is my best performing portfolio so far this year. I sold THIS SECTION IS FOR CLIENTS AND LIVE TRADING SUBSCRIBERS ONLY. FOR MORE INFO CLICK HEREI consider this my flagship portfolio. This model is made up of large-cap companies that I deem suitable forinvestors who have a conservative growth risk profile. Most of the stocks in this portfolio are members of theS&P 500. Time horizon of at least 3-5 years would be appropriate. Investors need to be able to ride throughswings up or down of at least 10-25% along the way, however. Unforeseen world events are also always a risk! Ifappropriate, bonds, a high degree of cash, or inverse funds could be included in this portfolio. This in anactively managed portfolio.This portfolio is now up 79.7% since its Jan. 1, 2010 inception (after all fees and expenses). It has also beenprotected by me several times along the way from that bear looming out there somewhere. I believe in Growthwith Vigilance along the way. This portfolio is now up 13.8% ytd. This is net of a maximum annual mgt. fee of 2%and all 3.50 trades. It is up 14.9% before expenses. I sold THIS SECTION IS FOR CLIENTS AND LIVE TRADING SUBSCRIBERS ONLY. FOR MORE INFO CLICK HERETHE AVERAGE DIVIDEND YIELD OF THE STOCKS IN THIS PORTFOLIO IS NOW 2.43%. This portfolio is forinvestors seeking Income along with the possibility of Growth. This is a good mix for retirees who areseeking a CD or Bond alternative-albeit with greater risk. This is my MOST CONSERVATIVE overallportfolio. Still, investors need to be able to handle up to, or even greater than 10-20% swings up ordown. Again, unforeseen world events are always a risk. If appropriate, this portfolios could containbonds or inverse funds.This portfolio is up 5.21% YTD after all expenses, 6.41% before expenses. I sold THIS SECTION IS FOR CLIENTS AND LIVE TRADING SUBSCRIBERS ONLY. FOR MORE INFO CLICK HERE8
This is my new portfolio. I merged the mutual fund with the ETF portfolio. It is designed forinvestors with long-term time horizons, seeking maximum growth. Investors need to be ableto stomach as much as 10-35% swings or higher from time to time in a growth style ofinvesting. This portfolio goes anywhere in the world, wherever the action is.This portfolio is now up 10.29% YTD after all fees, 11.45% before fees. I made THIS SECTION IS FOR CLIENTS AND LIVE TRADING SUBSCRIBERS ONLY. FOR MORE INFO CLICK HEREGUNDERSON SPECULATIVE TRADING PORTFOLIOThis is my “PLAY” account. For the most part, these stocks are too small or too thinly tradedfor my managed accounts. This is not a day-trading account. I am looking to bag some bigwinners, while keeping a short leash on my positions.This is an extremely volatile portfolio. It is not for the faint of heart. I am looking for several bigwinners in it this year. This portfolio is THIS SECTION IS FOR CLIENTS AND LIVE TRADING SUBSCRIBERS ONLY. FOR MORE INFO CLICK HERE9
Current Best Mutual Funds Now Top ranked funds 2 wks ago.Top ranked funds last week.Top ranked funds this week.This section of the newsletter shows my current rankings of mutual funds, exchanged tradedfunds, inverse funds, and inverse funds. This is very valuable information for fund and etfinvestors.Fund Rank 1-10 2wks agoFund rank 1-10 last weekFund rank 1-10 this week.Bottom ranked funds 2 wks agoBottom ranked funds last weekBottom ranked funds this week.Leading ETFS 2 weeks ago Last week’s top ten ETF’sThis weeks leading ETF’sTHIS SECTION IS FOR CLIENTS AND LIVE TRADING SUBSCRIBERS ONLY. FOR MORE INFO CLICK HEREBASIC 401-K ALLOCATION – THIS SECTION OF THE NEWSLETTER GIVE MY CURRENT FEELINGABOUT CURRENT 401-K allocations.T. Rowe Price U.S. Sm.Cap Gr. (PRSDX)0.0%T. Rowe Price U.S. Sm.Cap Value (PRVSX)0.0%T. Rowe Price U.S. Mid-Cap Gr. (RPMGX) 0.0%T.Rowe Price U.S. Mid-Cap Value (TRMCX)0.0%T. Rowe Price U.S. Lg. Cap Gr. (TRLGX)0.0%T. Rowe Price U.S. Lg. Cap Value (SICAV)0.0%T. Rowe Price REIT Fund (TRREX)0.0%T Rowe Price Interm. U.S. Govt. Tr.(PRTIX)0.0%T. Rowe Price U.S. Corp. Bonds (PRPIX)0.0%T. Rowe High Yield U.S. Corp. Bonds (PRHYX) 0.0%T. Rowe Price Intl. Stock Fund (PRTIX)0.0%T. Rowe Price Emg. Mkt. Stock Fund0.0%T. Rowe Price Emg.Mkt. Income (PREMX)0.0%T. Rowe Price Technology Fund (PRGTX)0.0%T. Rowe Price Healthcare Sector (PRHSX)0.0%T. Rowe Price Europe Fund (PRESX)0.0%T. Rowe Price Gold Fund (TGLDX)0.0%T. Rowe Price Balanced Fund (RPBAX)0.0%Fidelity Energy Fund (FSENX)0.0%T. Rowe Price Financial Svcs. Fund (PRISX)0.0%T. Rowe Price Asia Fund (PRASX)0.0%T. Rowe Price Govt. Money Market. (PRRXX)0.0%Inverse (SH)-if available)0.0%TOTAL100.0%10
TSP Plans or Basic 401-k plansMany folks have a very limited selection of choices in their retirement plans. This is my current recommendationfor such basic plans.U.S. Lg. & Midcap Stocks0.0%C FundU.S. Sm. & Mid-Cap stocks0.0%S FundU.S. Bonds (CASH)0.0%G Fund (Government Securities)Bond Fund0.0%F Fund (Govt. Bonds, Mortgage bonds, and Corp. Bonds)International Dev. Mkts.0.0%Asset Allocation0.0%I FundL fundLooking for a Hedge? Here is my current ranking of inverse (Bearish) ETF’s:Two Weeks AgoLast week.This week.This is a very difficult market to find any short opportunities. XIV stands alone.Leveraged Inverse Rankings2 Wks agoLast weekThis weekBill Gunderson is a professional fee-based money manager. Gunderson CapitalManagement manages hundreds of accounts all across the country. Minimum account sizeis 100,000. Annual Mgt. fees are 2% on accounts under 250,000, 1.5%-1.75% on accountsbetween 250k and 1 million, and 1%-1.25% on accounts over 1 million. Call us for aportfolio evaluation and more info. (855)611-BEST.To view this past week’s show archives click here11
BILL GUNDERSON’s WEEKLY TOP 300 LISTTwo Weeks agoLast WeekThis WeekThis is just an appetizer, here is the full list.THIS SECTION IS FOR CLIENTS AND LIVE TRADING SUBSCRIBERS ONLY. FOR MORE INFO CLICK HERE12
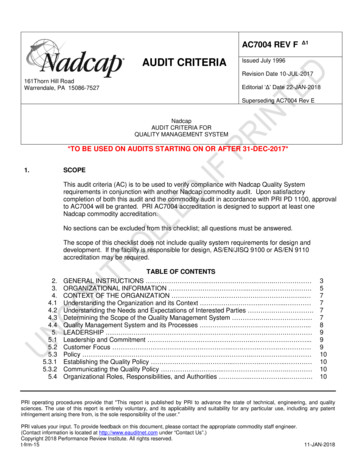
Bill Gunderson'sDec. 31Best Stocks Now2016Top 200 as of Friday 7/28/2017CSTM 8.55B Constellium N.VTERP 13.19B Terraform Power Inc.ARNC 25.12B Arconic Inc.SUPV 17.75B Grupo Supervielle S.A. ADRRYAAY 115.75B Ryanair Holdings plcIXN 137.59B Global Info Tech.IndexFSPTX 171.02B RYINX 102.03EWS 25.05ONCEFourThreeTwoOneWks. Ago Wks. Ago Wks. Ago Wk. asic Materials377526951406056181151Alternative Energy5512698206332693331593152Basic Financial - 101554978108103120156Fidelity Select TechnologyMutual Fund59822021930250175152157B Rydex Internet AMutual Fund7021567988169221195158B Singapore IndexIndex3281245523961015701196159 70.29B Spark TherapeuticsDrug0210177440876197160UPLD 24.85B Upland Software Inc.322647174221161ALL 89.68B Allstate CorpInsurance66912486398693200162COHR 269.67B Coherent IncTechnology166310551034178187203163OTEX 33.89B Open Text CorpTechnology1369763669313120119164OSUR 17.73B OraSure Tech IncMedical2297121193184194205165UPV 52.90B Europe Index 2XLeveraged Index2462137297976184207166MIDU 38.84B Mid-Cap Index 3XLeveraged Index1985178157316149158167MOMO 43.19B Momo Inc Ads Cl ATechnology-China0676659177231225168NVDA 161.74B Nvidia CorpTechnology766552579150234141169KRU 76.04B Banking Sector 2xLeveraged Sector21993133864479288170BGSIX 24.44B BlackRock Science & Technology OppMutualInstlFund41224041788263280133171UOPSX 132.20B ProFunds UltraNASDAQ-100 SvcMutual 1277262178Mutual Fund1122040153516824922418007269341307116181Basic Materials21
Jul 28, 2017 · BILL GUNDERSON’S CURRENT EPS AND TARGET PRICE FORECAST FOR THE S&P 500. As of today with 57% of the companies in the S&P 500 having reported earnings for the second quarter of 2017 THIS IS THE MOST IMPORTANT SECTION OF MY WEEKLY NEWSLETTER! THE MARKET FOLLOWS