Transcription
ATTACHMENT D-5Beaver Valley Power Station, Unit No.License Amendment Request No. 1582Attached is WCAP 15337 Rev. 2 "Revised Thermal Design ProcedureInstrument Uncertainty Methodology for FirstEnergy Nuclear Operating(Non-Proprietary Class 3)Company Beaver Valley Unit 2."
Westinghouse Non-Proprietary Class 3Westinghouse RevisedThermal Design ProcedureInstrument UncertaintyMethodology forFirstEnergy NuclearOperating CompanyBeaver Valley Unit 2WestinghouseElectricCompanyLLC
WESTINGHOUSE NON-PROPRIETARY CLASS 3WCAP-15337, Rev. 2WESTINGHOUSE REVISED THERMAL DESIGN PROCEDUREINSTRUMENT UNCERTAINTY METHODOLOGYFOR FIRSTENERGY NUCLEAR OPERATING COMPANYBEAVER VALLEY UNIT 2December, 2000T. P. WilliamsJ. R. ReaganC. R. TuleyWestinghouse Electric Company LLC4350 Northern PikeMonroeville, Pennsylvania 15146-2886Copyright by Westinghouse Electric Company LLC, 2000 All Rights Reserved
TABLE OF CONTENTS1.IN TRO D U C T ION .1II.METHO D O LOG Y .2ImI.INSTRUMENTATION UNCERTAINTIES .5Pressurizer Pressure Uncertainties .5TABLE I PRESSURIZER PRESSURE CONTROL SYSTEMU NCERTA INTY .Tavg U ncertainties .TABLE 2 TAVG ROD CONTROL SYSTEM UNCERTAINTY .RCS Flow M easurement Uncertainties .6789TABLE 3 FLOW CALORIMETRIC INSTRUMENTATIONUN CERTAINTIES .TABLE 4 FLOW CALORIMETRIC SENSITIVITIES .1618TABLE 5 CALORIMETRIC RCS FLOW MEASUREMENTUNCERTAIN TY .Loop RCS Flow Indication Uncertainty (Using the Plant Computer) .1921TABLE 6 COLD LEG LOOP RCS FLOW INDICATION UNCERTAINTY . 22Reactor Power Measurement Using a Feedwater Venturi Measurement .23TABLE 7 POWER CALORIMETRIC INSTRUMENTATIONUNCERTAINTIES .TABLE 8 POWER CALORIMETRIC SENSITIVITIES .TABLE 9 SECONDARY SIDE POWER CALORIMETRIC2829MEASUREMENT UNCERTAINTY .30Reactor Power Measurement Using a Caldon LEFM Measurement .TABLE 10 POWER CALORIMETRIC INSTRUMENTATION31UNCERTAINTIES (USING AN LEFM ON FEEDWATERHEAD ER ) .TABLE 11 POWER CALORIMETRIC SENSITIVITIES .3537TABLE 12 SECONDARY SIDE POWER CALORIMETRICMEASUREMENT UNCERTAINTY .38RESULTS/CONCLUSIONS .39RE FEREN CE S .40IV.Figure 1 Calorimetric RCS Flow Measurement ( Using Feedwater Venturi Secondary Side) . 41Figure 2 Calorimetric Power Measurement ( Using Feedwater Venturi) .42Figure 3 Calorimetric Power Measurement (using LEFM) .431
WESTINGHOUSE REVISED THERMAL DESIGN PROCEDUREINSTRUMENT UNCERTAINTY METHODOLOGYI.INTRODUCTIONFour operating parameter uncertainties are used in the uncertainty analysis of the RevisedThermal Design Procedure (RTDP). These parameters are Pressurizer Pressure, Primary CoolantTemperature (Tavg), Reactor Power, and Reactor Coolant System Flow. They are frequentlymonitored and several are used for control purposes. Reactor power is monitored by theperformance of a secondary side heat balance (power calorimetric) at least once every 24 hours.RCS flow is monitored by the performance of a calorimetric flow measurement at the beginningof each cycle. The RCS Cold Leg loop flow indicators are compared with the calorimetric flowmeasurement. Pressurizer pressure is a controlled parameter and the uncertainty reflects thecontrol system.Tavgis a controlled parameter via the temperature input to the rod control system,and the uncertainty reflects this control system.Westinghouse has been involved with the development of several techniques to treatinstrumentation uncertainties. An early version used the methodology outlined in WCAP-8567(1,2,3)"Improved Thermal Design Procedure",which is based on the conservative assumption thatthe uncertainties can be described with uniform probability distributions. Another approach isbased on the more realistic assumption that the uncertainties can be described with random,normal, two-sided probability distributions.(4 ) This approach is used to substantiate theacceptability of the protection system setpoints for many Westinghouse plants, e.g., D. C.(5)Cook 2 , V. C. Summer, Wolf Creek, Millstone Unit 3 and others. The second approach is nowutilized for the determination of all instrumentation uncertainties for the RTDP parameters andprotection functions.The purpose of this revision is to document the calculation of the instrumentation uncertaintiesfor the daily power calorimetric measurement at the 1.4 % uprated conditions when using theCaldon Leading Edge Flow Meter (LEFM) in the feedwater header.I
II.METHODOLOGYThe methodology used to combine the error components for a channel is the square root of thesum of the squares (SRSS) of those groups of components which are statistically independent.Those uncertainties that are dependent are combined arithmetically into independent groups,which are then systematically combined. The uncertainties used are considered to be random,two-sided distributions. This technique has been utilized before as noted previously, and hasbeen endorsed by the NRC staff(6,7,8,9)and various industry standards(01The relationships between the error components and the channel instrument error allowance are(12)variations of the basic Westinghouse Setpoint Methodology and are based on Beaver ValleyPower Station Unit 2 (BVPS 2) specific procedures and processes and are defined as follows:1.For precision parameter indication using special test equipment or a digital voltmeter(DVM) at the input to the racks;CSA {(PMA) 2 (PEA)2 (SMTE SCA) 2 (SPE)2 (STE) 2(SMTE SD) 2 (RDOUT) 2 }1 2 BIAS2. (SRA) 2 Eq. 1For parameter indication utilizing the plant process computer;CSA {(PMA) 2 (PEA)2 (SMTE SCA)2 (SPE) 2 (STE) 2 (RA)2(SMTE SD) 2 (RMTE RCA) 2 (RTE) 2 (RMTE RD)2 (COMPMTE COMPCAL)2 (COMPMTE COMPDRTFT) 2}1 /2 BIAS3.Eq. 2For parameters which have control systems, the control board indicators are used as theverification method for proper control system operation.2222CSA {(PMA)2 (PEA) 2 (SMTE SCA) (SPE) (STE) (SMTE SD)2" (SRA)2 (RMTE RCA) 2 (RTE) 2 (RMTE RD)2" (CA)2 (RMTE RCA) 2IND (RDOUT) IND (RMTE RD)2IND}) /2" BIASEq. 32
where:CSAPMAPEASRASCASMTE SPESTE Channel Statistical AllowanceProcess Measurement AccuracyPrimary Element AccuracySensor Reference AccuracySensor Calibration AccuracySensor Measurement and Test Equipment AccuracySensor Pressure EffectsSensor Temperature EffectsSD Sensor DriftRCARMTERTE Rack Calibration AccuracyRack Measurement and Test Equipment AccuracyRack Temperature EffectsRD Rack DriftRDOUTCA Readout Device AccuracyController AllowanceCOMP Plant ComputerIND Indicator. The parameters above are defined in References 5 and 12 and are based on ISA S51.1-1979(R93) 3). However, for ease in understanding they are paraphrased below:PMAPEASRASCASMTESPESTESDRCA- non-instrument related measurement errors, e.g., temperaturestratification of a fluid in a pipe.- errors due to a metering device, e.g., elbow, venturi, orifice.- reference (calibration) accuracy for a sensor/transmitter.- calibration tolerance for a sensor/transmitter.- measurement and test equipment used to calibrate a sensor/transmitter.- change in input-output relationship due to a change in static pressurefor a differential pressure (d/p) cell.- change in input-output relationship due to a change in ambienttemperature for a sensor or transmitter.- change in input-output relationship over a period of time at referenceconditions for a sensor or transmitter.- calibration accuracy for all rack modules in loop or channel assumingthe loop or channel is string calibrated, or tuned, to this accuracy.3
RMTERTE- measurement and test equipment used to calibrate rack modules.- change in input-output relationship due to a change in ambienttemperature for the rack modules.RD- change in input-output relationship over a period of time at referenceconditions for the rack modules.RDOUT - the measurement accuracy of a special test local gauge, digital voltmeter ormultimeter on its most accurate applicable range for the parameter measured,or 1/2 the smallest increment on an indicator (readability).CA- allowance of the controller rack module(s) that performs the comparison andcalculates the difference between the controlled parameter and the referencesignal.COMP - allowance for the uncertainty associated with the use of the plant computer.IND- allowance for the uncertainty associated with the use of an indication meter.Control board indicators are typically used.BIAS- a one directional uncertainty for a sensor/transmitter or a process parameterwith a known magnitude.A more detailed explanation of the Westinghouse methodology noting the interaction of severalparameters is provided in References 5 and 12.4
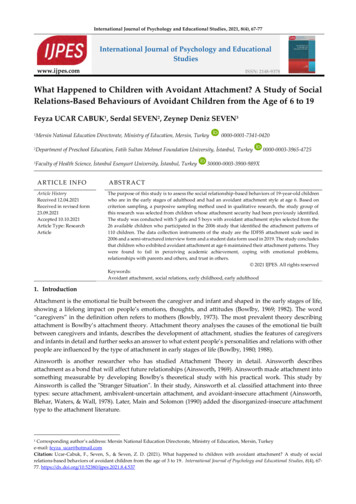
III.INSTRUMENTATION UNCERTAINTIESThe instrumentation uncertainties will be discussed first for the two parameters that arecontrolled by automatic systems, Pressurizer Pressure, and Tavg (through rod er pressure is controlled by a system that compares the measured vapor space pressureto a reference value. This uncertainty calculation accounts for a closed-loop control systemdesign where [I] a,c. The control channel uncertaintiesfor the automatic control system include allowances for the pressure transmitters, the processracks/indicators and the control system. This uncertainty calculation includes control boardindicator uncertainties for performance verification of the automatic control system.On Table 1, the electronics uncertainty for this function is [[Ia.This includes a Limit of Error (LOE) of [] ac] c which corresponds toto account for the seismiceffects associated with the Rosemount 1152 transmitter. In addition to the control systemuncertainty, an allowance is made for pressure overshoot or undershoot due to the interaction andthermal inertia of the heaters and spray. An allowance of [] a,c is made for this effect.Additionally, a bias of [] ,c is included for temperature compensation of Bartontransmitters and long term negative drift effects. The total control system uncertainty, includingthe LOE and bias, is [] ac with a standarddeviation of [] 3c presuming a normal, two-sided probability distribution.5
TABLE IPRESSURIZER PRESSURE CONTROL SYSTEM UNCERTAINTY[Rosemount Model 11 52GP9 Transmitter (control); Barton 763 Transmitter (indication)]All Values in % ]BIAS 2 a,c RCARMTE RTERDRCAND RMTEIND RTEr RDND RDOUTrNDCA SPAN 800 psi a,cCSA (% span)CSA (PSI)CONTROLLER UNCERTAINTY* treated as a bias6
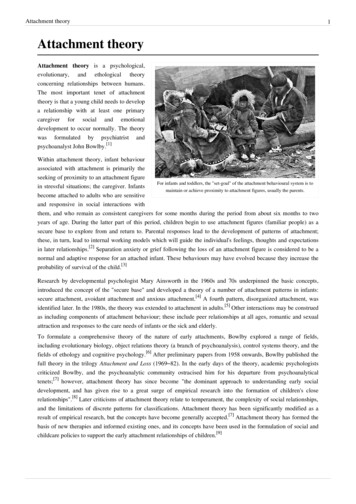
Tavg Uncertaintiesis controlled by a system that compares the median Tavg (via Median Signal Selector) fromthe loops with a reference derived from the First Stage Turbine Impulse Chamber Pressure.TavgAppropriate operation of the control system is verified through indication. Tavg is the average ofthe narrow range TH and Tc values for a loop. The median loop Tavg is then used for rod control.Allowances are made (as noted on Table 2) for hot leg and cold leg streaming, the RTDs, turbinepressure transmitter, process racks/indicators and controller. Based on the assumption that 2Thot and 1 Tcold cross-calibrated RTDs are used to calculate Tavg (assuming one failed ThotRTD per loop) and that the RTDs are located in the hot and cold legs, i.e., the RTD bypassmanifolds are removed, the electronics uncertainty is calculated to be [] ac. Assuming anormal, two-sided probability distribution results in an electronics standard deviation (s 1) of[ acHowever, this does not include the deadband of [] aCassociated with automatic control.The Tavg controller accuracy is the combination of the instrumentation accuracy and thedeadband. The probability distribution for the deadband has been determined to be []. a'c The variance for the deadbanduncertainty is then: a,c ac(s2)2 [Combining the variance for instrumentation and deadband results in a controller variance of:(ST) 2 (S1)The controller STA bias of [Twold2 (S2)2[] a,c [] a'c for a total random uncertainty of [],c.for ToýId streaming (in terms of Tavg), based on a conservative [streaming uncertainty is included in Table 2. Therefore, the total uncertainty of thecontroller with the bias is [] a,3random and [7] a'c bias.]
TABLE 2TAVG ROD CONTROL SYSTEM UNCERTAINTYTavg *Turbine Pressure ** INDCATPSENL# Hot Leg RTDs 2/Channel*% of Inst. span **% of Inst. span # Cold Leg RTDs 1/Channel100 OF (530-630 -F)700 psi a,cELECTRONICS CSAELECTRONICS SIGMACONTROLLER SIGMACONTROLLER CSACONTROLLER BIASJ[8 a,c
RCS Flow Measurement UncertaintiesRTDP and BVPS 2 Technical Specifications require an RCS flow measurement with a highdegree of accuracy. A total RCS flow measurement is performed every fuel cycle, 18 months, toverify RCS flow and to normalize the RCS flow instrument channels. Periodic surveillance isperformed with the process computer/control board indicators to ensure that the RCS flow ismaintained above the assumed safety analysis value, i.e., Minimum Measured Flow (MMF). The18 month RCS flow surveillance is satisfied by performance of a secondary side power-basedcalorimetric RCS flow measurement. The calorimetric flow measurement is performed at thebeginning of a cycle, near full power operation.The flow measurement is performed by determining the Steam Generator thermal output(corrected for the RCP heat input and the loop's share of primary system heat losses) and theenthalpy rise (Ah) of the primary coolant. Assuming that the primary and secondary sides are inequilibrium, the RCS total vessel flow is the sum of the individual primary loop flows, i.e.,WRCS Y-(WL).Eq. 4The individual primary loop volumetric flows are determined by correcting the thermal output ofthe Steam Generator (presuming Steam Generator blowdown is secured), subtracting the RCPheat addition, adding the loop's share of the primary side system losses, dividing by the primaryside enthalpy rise and multiplying by the Cold Leg specific volume. The equation for thiscalculation is:WL LQsGQ-OP (O,/N)(hH-c)hc)Eq. 5where;WL Loop Flow (gpm)A Constant conversion factor 0.1247 gprn/(ft3 l/hr)QSG Steam Generator thermal output (BTU/hr)Qp RCP heat addition (BTU/hr)QL VcNhHhc Primary system net heat losses (BTU/hr)Specific volume of the Cold Leg at Tc (ft 3/lb)Number of primary side loopsHot Leg enthalpy (BTU/Ib)Cold Leg enthalpy (BTU/lb). 9
The thermal output of the Steam Generator is determined by a secondary side calorimetricmeasurement, which is defined as:QsG (hý - hf)WfEq. 6where;hs hf Wf Steam enthalpy (BTU/lb)Feedwater enthalpy (BTU/lb)Feedwater flow (lb/hr).The Steam enthalpy is based on the measurement of Steam Generator outlet pressure assumingsaturated conditions. The Feedwater enthalpy is based on the measurement of Feedwatertemperature and inferred Feedwater pressure. The Feedwater flow is determined by multiplemeasurements and the following equation:Wf (K) (Fa) {(pf )(d/p)} 11 /2Eq.7where;K Fa pfd/p FeedwaterFeedwaterFeedwaterFeedwaterventuri flow coefficientventuri correction for thermal expansiondensity (lb/ft3)venturi Ap (inches H20)The Feedwater venturi flow coefficient is the product of a number of constants including as-builtdimensions of the venturi and calibration tests performed by the vendor. The thermal expansioncorrection is based on the coefficient of expansion of the venturi material and the differencebetween Feedwater temperature and calibration temperature. Feedwater density is based on themeasurement of Feedwater temperature and Feedwater pressure. The venturi Ap is obtained fromthe output of the differential pressure cell connected to the venturi.RCP heat addition is determined by calculation, based on the best estimate of coolant flow, pumphead, and pump hydraulic efficiency.The primary system net heat losses are determined by calculation, considering the followingsystem heat inputs and heat losses:10
Charging flowLetdown flowSeal injection flowRCP thermal barrier cooler heat removalPressurizer spray flowPressurizer surge line flowComponent insulation heat lossesComponent support heat lossesCRDM heat lossesA single calculated sum for 100% RTP operation is used for these losses or heat inputs.The Hot Leg and Cold Leg enthalpies are based on the measurement of the Hot Leg temperature,Cold Leg temperature and the nominal Pressurizer pressure. The Cold Leg specific volume isbased on measurement of the Cold Leg temperature and nominal Pressurizer pressure.The RCS flow measurement is thus based on the following plant measurements:Steamline pressure (Ps)Feedwater temperature (Tf)Feedwater pressure (Pf) (assumed value)Feedwater venturi differential pressure (d/p)Hot Leg temperature (TH)Cold Leg temperature (Tc)Pressurizer pressure (PP)and on the following calculated values:Feedwater venturi flow coefficients (K)Feedwater venturi thermal expansion correction (Fa)Feedwater density (pf)Feedwater enthalpy (hf)Steam enthalpy (hs)Moisture carryover (affects h,)Primary system net heat losses (QL)11
RCP heat addition (Qp)Hot Leg enthalpy (hH)Cold Leg enthalpy (hc).These measurements and calculations are presented schematically in Figure 1. The derivation ofthe measurement and flow uncertainties on Table 5 are noted below.Secondary SideThe secondary side uncertainties are in four principal areas, Feedwater flow, Feedwater enthalpy,Steam enthalpy and net pump heat addition. These areas are specifically identified on Table 5.For the measurement of Feedwater flow, each Feedwater venturi is calibrated by the vendor in a a,chydraulics laboratory under controlled conditions to an accuracy of [] . Thecalibration data which substantiates this accuracy is provided to the plant by the vendor. Anadditional uncertainty factor of [ a,c is included for installation effects, resultingin a conservative overall flow coefficient (K) uncertainty of [] a'c. Since RCSflow is proportional to Steam Generator thermal output which is proportional to Feedwater flow,the flow coefficient uncertainty is expressed as [] a,c . It should be noted that noallowance is made for venturi fouling. The venturis should be inspected, and cleaned ifnecessary, prior to performance of the precision measurement. If fouling is present but notremoved, its effects must be treated as a flow bias.The uncertainty applied to the Feedwater venturi thermal expansion correction (Fa) is based onthe uncertainties of the measured Feedwater temperature and the coefficient of thermal expansionfor the venturi material, typically 304 stainless steel. For this material, a change of I 'F in thenominal Feedwater temperature range changes Fa by []* and the Steam Generatorthermal output by the same amount.An allowance in Fa of 5 % for the material variance of the composition of 304 stainless steel isused in this analysis. This results in an additional uncertainty of [flow. Westinghouse uses a conservative value of []aIc in Feedwater] a' in the uncertainty calculation.Using the NBS/NRC 1984 Steam Tables, it is possible to determine the sensitivities of variousparameters to changes in Feedwater temperature and pressure. Table 3 notes the instrument12
uncertainties for the hardware used to perform the measurements. Table 4 lists the varioussensitivities. As can be seen on Table 5, Feedwater temperature uncertainties have an effect onventuri Fa , Feedwater density and Feedwater enthalpy. Feedwater pressure uncertainties affectFeedwater density and Feedwater enthalpy.Feedwater venturi d/p uncertainties are converted to % Feedwater flow using the followingconversion factor:2% flow (d/p uncertainty)(l/2)(transmitter span/100)The feedwater flow transmitter span is [] ,cof nominal flow.Using the NBS/NRC 1984 Steam Tables, it is possible to determine the sensitivity of Steamenthalpy to changes in Steam pressure and Steam quality. Table 3 notes the uncertainty in Steampressure and Table 4 provides the sensitivity. For Steam quality, the 1984 Steam Tables wereused to determine the sensitivity at a moisture content of [Table 4.]. This value is noted onThe net pump heat addition uncertainty is derived from the combination of the primary systemnet heat losses and pump heat addition and are summarized for Beaver Valley as follows:System heat lossesComponent conduction andconvection lossesPump heat adderNet Heat input to RCS-2.0 MWt1.4 MWt 11.4 MWt- 8.0 MWtThe uncertainty on system heat losses, which is essentially due to charging and letdown flows,has been estimated to be [] 'I of the calculated value. Since direct measurements are notpossible, the uncertainty on component conduction and convection losses has been assumed to beII] ac of the calculated value. Reactor coolant pump hydraulics are known to a relativelyhigh confidence level, supported by system hydraulics tests performed at Prairie Island Unit 2and by input power measurements from several other plants. Therefore, the uncertainty for thepump heat addition is estimated to be [] a3c of the best estimate value. Considering these13
parameters as one quantity, which is designated the net pump heat addition uncertainty, the]C of the total, which is less than [combined uncertainties are less than [a,of core power.Primary SideThe primary side uncertainties are in three principal areas, hot leg enthalpy, cold leg enthalpy andcold leg specific volume. These are specifically noted on Table 5. Three primary side parametersare actually measured, TH, Tc and Pressurizer pressure. Hot Leg enthalpy is influenced by TH,Pressurizer pressure and Hot Leg temperature streaming. The uncertainties for theinstrumentation are noted on Table 3 and the sensitivities are provided on Table 4. The hot legstreaming is split into random and systematic components. For BVPS 2 where the RTDs arelocated in thermowells placed in the scoops of the eliminated bypass manifold piping, the hot leg] ac random and [ atemperature streaming uncertainty components are [systematic.The cold leg enthalpy and specific volume uncertainties are affected by Tc and Pressurizerpressure. Table 3 notes the Tc instrument uncertainty and Table 4 provides the sensitivities.Parameter dependent effects are identified on Table 5. Westinghouse has determined thedependent sets in the calculation and the direction of interaction, i.e., whether components in adependent set are additive or subtractive with respect to a conservative calculation of RCS flow.The same evaluation was performed for the instrument bias values. As a result, the calculationexplicitly accounts for dependent effects and biases accounting for sign (or direction of effect).14
Using Table 5, the 3 loop uncertainty equation (with biases) is as follows: a,cFlow -Eq. 8 a,cFlow Based on the number of loops; number, type and measurement method of RTDs, and the vesselDelta-T, the flow uncertainty is:# of loopsflow uncertainty (% flow)3ae[o a,ca standard deviation (%flow)[15
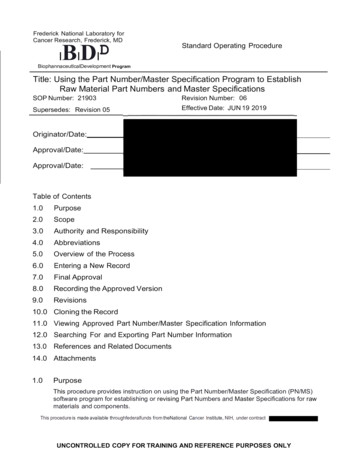
TABLE 3FLOW CALORIMETRIC INSTRUMENTATION UNCERTAINTIESFW TEMPOFFW PRESFW AP%APSTM PRESS% SPANTHOFTCOFPRZ PRESS% SPAN ECompTERDCompDriftRDOUTCSA16
TABLE 3 (continued)FLOW CALORIMETRIC INSTRUMENTATION UNCERTAINTIESFW TEMPFW PRES# OF INSTRUMENTS USEDI/LoopI/LoopINST SPAN 600(')OFFW APSTM PRESS2/Loop1600(2)psiTHTCPRZ PRESS33/Loop3/Loop I/Loop1200(4)120(')120(')800(6)psiOFOFpsi%AP a,cINSTUNG.](RANDOM) 1INST UNC.(BIAS) 1NOMINAL 437.5 F 911 psia100%Flow811psia610.4 0 F542.0 F 2250psia(1) Plant Computer is used for this measurement.(2) Feedwater Pressure is not measured.(3) Flow is measured by the Plant Computer.(4) Steam Pressure is measured with a local test gauge.(5) Temperature is measured with a digital voltmeter at the output of the cold leg R/Eand hot leg Tavg process instrumentation modules.(6) RCS Pressure is measured by the plant computer.17
TABLE 4FLOW CALORIMETRIC SENSITAVITIESFEEDWATER FLOW FEEDWATER ENTHALPYTEMPERATUREPRESSUREhshfAh (SG)DELTA PSTEAM ENTHALPYPRESSUREMOISTUREHOT LEG ENTHALPYTEMPERATUREPRESSURE hHh Ah(VESS) cCOLD LEG ENTHALPYTEMPERATUREPRESSURECOLD LEG SPECIFIC VOLUMETEMPERATUREPRESSURE18
TABLE 5CALORIMETRIC RCS FLOW MEASUREMENT UNCERTAINTYCOMPONENTINSTRUMENT UNCERTAINTYFLOW UNCERTAINTY a,cFEEDWATER FLOWVENTURI (FWv)THERMAL EXPANSION COEF.TEMPERATURE (Fa,)MATERIAL (Fa.)DENSITYTEMPERATURE (Pt)PRESSURE (pp)AP(Fp)FEEDWATER ENTHALPYTEMPERATURE (h,)PRESSURE (hp)STEAM ENTHALPYPRESSURE (hp,)MOISTURE (hs moist)NET PUMP HEAT ADDITION (NPHA)HOT LEG ENTHALPYTEMPERATURE (hit)STREAMING, RANDOM (hH, )STREAMING, SYSTEMATIC (hHt)(hHp)PRESSURECOLD LEG ENTHALPYTEMPERATURE (act)(h p)PRESSURECOLD LEG SPECIFIC VOLUMETEMPERATURE (vct)PRESSURE(v )*, **, , INDICATES SETS OF DEPENDENT PARAMETERS19
TABLE 5 (CONTINUED)CALORIMETRIC RCS FLOW MEASUREMENT UNCERTAINTYFLOW UNCERTAINTYCOMPONENTBIAS VALUES a,cSTEAM PRESSUREENTHALPY(hop bias)PRESSURIZER PRESSUREENTHALPY - COLD LEG(hsp bias)SPECIFIC VOLUME - COLD LEG(VCp bias)COLD LEG ENTHALPYR/E(hctbias)FLOW BIAS TOTAL VALUE a,c3 LOOP UNCERTAINTY3 LOOP UNCERTAINTY(WITHOUT BIAS VALUES)(WITH BIAS VALUES)20
Loop RCS Flow Indication Uncertainty(Using the PlantComputer)As noted earlier, the calorimetric RCS flow measurement is used as the reference for normalizingthe loop RCS flow indicators and plant computer points from the cold leg elbow tap transmitters.Since the cold leg elbow tap transmitters feed the plant computer, it is a simple matter to performan RCS flow surveillance to look for relative change on a periodic basis. Table 6 notes theinstrument uncertainties for determining flow by using the loop RCS flow computer points,assuming three RCS flow channels per reactor coolant loop. The d/p transmitter uncertaintiesare converted to percent flow using the following conversion factor:% flow (d/p uncertainty)(1 /2)(transmitter span / 100)2The loop RCS flow indication uncertainty is then combined with the calorimetric RCS flowmeasurement uncertainty. This combination of uncertainties results in the following total RCSflow indication uncertainty:# of channels/loop, 3 RCS loopsZflow uncertainty ( % flow )LI3 a,cThe corresponding value used in RTDP is:L I ac# of channels/loop, 3 RCS loopsstandard deviation ( % flow)321
TABLE 6COLD LEG LOOP RCS FLOW INDICATION UNCERTAINTYPLANT COMPUTERINSTRUMENT UNCERTAINTIES3 RCS Flow Channels Per Reactor Coolant Loop% d/p SPAN% Flow a,cPMA PEA SRA SCA SMTE SPESTE SD BIAS RCA RMTE RTERD COMPCAL COMPMTE COMPDRIFT FLOW CALORIMETRIC BIASFLOW CALORIMETRIC INSTRUMENT SPAN a,cSINGLE LOOP ELBOW TAP FLOW UNCERTAINTY3LOOP RCS FLOW UNCERTAINTY(WITHOUT BIAS VALUES)3LOOP RCS FLOW UNCERTAINTY(WITH BIAS VALUES) a,c22
Reactor Power Measurement Using a Feedwater Venturi MeasurementThe daily power measurement assumes the measurement of the feedwater flow using the APtransmitters and the flow venturis placed in the feedwater lines. This method of measurement issensitive to fouling in the venturi throat which results in an indication of higher-than-actual flowwhich results in a conservative over-estimate of power.Assuming that the primary and secondary sides are in equilibrium; the core power is determinedby summing the thermal output of the steam generators, correcting the total secondary power forSteam Generator blowdown, subtracting the RCP heat addition, adding the primary side systemlosses, and dividing by the core Btu/hr at rated full power. The equation for this calculation is:RP QSG) 0{IQ1p IU.)Eq. 9Hwhere;RP Core power ( %RTP)QSGQp Steam generator thermal output (BTU / hr ) as defined earlier RCP heat addition (BTU / hr ) as defined earlierQLH Primary system net heat losses (BTU / hr ) as defined earlier Rated core power (BTU / hr).For the purposes of this uncertainty analysis (and based on H noted above) it is assumed that theplant is at 100 % RTP when the measurement is taken. Measurements performed at lower powerlevels will result in different uncertainty values.The thermal output of the Steam Generator is determined by a secondary side calorimetricmeasurement, which is defined as:QsG (hs - hf)Wf- (hr - hbd)Wbdwhere;hshf Wf hbd W Eq. 10Steam enthalpy (BTU/lb).Feedwater enthalpy (BTU/lb).Feedwater flow (lb/hr).Steam Generator blowdown enthalpy (BTU/lb).Steam Generator blowdown flow (lb/hr).23
The Steam enthalpy is based on the measurement of Steam Generator out
Beaver Valley Power Station, Unit No. 2 License Amendment Request No. 158 . thermal inertia of the heaters and spray. An allowance of [ ] a,c is made for this effect. Additionally, a bias of [ ] ,c is included for temperature compensation of Barton . CONTROLLER SIGMA CONTROLLER CSA CONTROLLER BIAS # Cold Leg RTDs 1/Channel 100 OF (530 .