Transcription
Experiment 7: Spectrum of theHydrogen AtomNate Saffoldnas2173@columbia.eduOffice Hour: Mondays, 5:30-6:30PMINTRO TO EXPERIMENTAL PHYS-LAB1493/1494/2699
Introduction The physics behind: The spectrum of light The empirical Balmer series for Hydrogen The Bohr model (a taste of Quantum Mechanics) Brief review of diffractionThe experiment: How to use the spectrometer and read the Vernier scale Part 1: Analysis of the Helium (He) spectrum Finding lattice constant of the gratingPart 2: Measuring spectral lines of Hydrogen (H) Determining the initial state of the electronPHYS 1493/1494/2699: Exp. 7 – Spectrum of the HydrogenAtom2
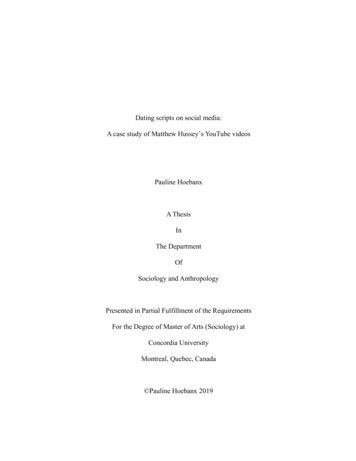
Light Spectra Isaac Newton (1670): shine sunlight through prism and you willobserve continuous rainbow of colors.Yep! Stillme John Herschel (1826): shine light from heated gas throughspectroscope, and you will observe monochromatic lines ofpure color on a dim/dark background.Newton’s rainbowHerschel’s linesPHYS 1493/1494/2699: Exp. 7 – Spectrum of the HydrogenAtom3
Discharge lamps and artificial light Herschel's discovery of emissionspectra from heated gas was studiedextensively in the 1800's.It was realized that a heated gasemits a unique combination ofcolors, called emission spectrum,depending on its composition.Example: Helium gas in adischarge lamp.Main idea: put a large voltageacross the gas. It will break downand emit light. The light emitted iscomposed of discrete colors.PHYS 1493/1494/2699: Exp. 7 – Spectrum of the HydrogenAtom4
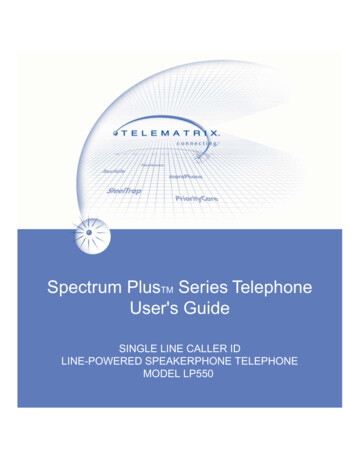
Atomic spectra This is an example of the lines emitted from different gasesPHYS 1493/1494/2699: Exp. 7 – Spectrum of the HydrogenAtom5
Interlude: Spectra in Astronomy In the 19th century astronomers realized that spectroscopy canbe used as a powerful tool to study stars1802: William Wollaston observed sunlight separated intocolors by a prism; he noticed dark lines in the spectrum atdefinite locations.1817: Joseph Fraunhofer observed these spectral lines in otherstars as well. Sometimes they are the same, sometimes theyare different.They correspond to the absorption (not emission!) of somewavelengths due to the most external elements of the solar gasImplication: The stars are made of the same stuff as Earth!PHYS 1493/1494/2699: Exp. 7 – Spectrum of the HydrogenAtom6
Interlude: How stars emit light Emitted spectrum: Very hotstellar center emitscontinuous (blackbody)radiationVisible lightFrom the core all thewavelengths are emitted (justlike a rainbow)Observed spectrum: Beforearriving to us the light passesthrough surface of starsGases at surface absorb light at characteristic wavelengthsTherefore, we detect all the wavelengths but the oneabsorbed. This generates the Fraunhofer’s linesPHYS 1493/1494/2699: Exp. 7 – Spectrum of the HydrogenAtom7
Interlude: How stars emit light Star's absorption spectrum:PHYS 1493/1494/2699: Exp. 7 – Spectrum of the HydrogenAtom8
The Balmer formula J.J. Balmer discovers (1885) that the quantized (discrete) visibleemission spectrum of the hydrogen follows a mathematicalformula: He found the following expression for the wavelength of theabsorption lines completely empirically. He did not provide anyphysical explanation for it:Different values of nf correspond to different line series discovered byseveral scientists before Balmer himself: nf 1 (Lyman Series) nf 2 (Balmer Series) which is visible nf 3, 4, 5, . (Paschen, Brackett, Pfund)PHYS 1493/1494/2699: Exp. 7 – Spectrum of the HydrogenAtom9
Example: the visible spectrum For the Balmer series (visiblespectrum) we fix nf 2If we then change ni we obtain: ni 3 yields λ 656 nm (red) ni 4 yields λ 486 nm (green) ni 5 yields λ 433 nm (blue) ni 6 yields λ 410 nm (purple)NOTE: in the real experiment youwill perform:The Balmer’s equationdescribes the observed linesvery accurately1. “Green” looks bluish-green2. “Blue” looks purple3. “Purple” looks dark violet. Itwill be very hard to see But what is the physics?PHYS 1493/1494/2699: Exp. 7 – Spectrum of the HydrogenAtom10
Bohr’s model for H atom In 1913 Neils Bohr proposed a physical model to describe thespectrum of the hydrogen atom. It was the birth of QuantumMechanics!He hypothesizes that the angular momentum of an electron inorbit around a proton is quantized (i.e. it can only be a discretemultiple of a certain number):Under this simple assumption he managed to compute theenergy of the electron around the atom:As a consequence, the energy of the electron around thenucleus is also quantized!PHYS 1493/1494/2699: Exp. 7 – Spectrum of the HydrogenAtom11
Bohr’s model for H atom In a real life experiment we can never measure the energy ofthe electron. We can however measure differences in its energySuppose that an electron makes a transition from a level ni to alevel nf (with ni nf)In order to conserve energy it will have to emit a photon withenergy exactly Eγ ΔE Eni – EnfQuantum mechanically the energy of a single photon is relatedto its wavelength as Eγ hc/λ Therefore, the wavelength of the emitted photon is: This perfectly describes the spectrum of the hydrogen atom!PHYS 1493/1494/2699: Exp. 7 – Spectrum of the HydrogenAtom12
Towards Quantum Mechanics The Bohr’s model was a very first steptowards a new paradigm of physicsIt still had unresolved problems like: Could not capture some subtle propertiesof H atomsDoes not apply to other kinds of elementsEventually the development of QuantumMechanics (1920's) lead to a description ofmatter that is still in agreement withexperiments todayHowever, the main idea present in theBohr’s model remains: some physicalquantities like energy and angularmomentum can be discrete. This changeseverything!PHYS 1493/1494/2699: Exp. 7 – Spectrum of the HydrogenAtom13
Spectroscopy How can we measure the energy levels (spectrum) of thehydrogen atom? We CANNOT measure individual energy levels!We ARE ABLE TO measure indirectly the transition of an electronfrom one state to another. Absorption and emission of photons.PHYS 1493/1494/2699: Exp. 7 – Spectrum of the HydrogenAtom14
Spectroscopy How can we measure the energy levels (spectrum) of thehydrogen atom? We CANNOT measure individual energy levels!We ARE ABLE TO measure indirectly the transition of an electronfrom one state to another. Absorption spectroscopy: Shine a range of variouswavelength radiation on a sample and measure thewavelengths that get absorbed (excitation of atoms). Absorption and emission of photons.Not the kind of spectroscopy we will useEmission spectroscopy: Given a sample of excited atoms,measure the radiation that is emitted by the atoms. This will be the principle behind this week's experiment.PHYS 1493/1494/2699: Exp. 7 – Spectrum of the HydrogenAtom15
The emission spectrum of hydrogen Energy levels of the hydrogen atom:E0.0 eVDe-excitation ofelectron results inemission of photon-13.6 eVPHYS 1493/1494/2699: Exp. 7 – Spectrum of the HydrogenAtom16
The emission spectrum of hydrogen ELyman series: It is made of all the de-excitations that end upon the nf 1 level Infinite number of them: ni 2, 3, 4, .nf 10.0 eVUnfortunately the Lymanseries is not visible with thenaked eye. Wavelengths arein the ultraviolet region -13.6 eVPHYS 1493/1494/2699: Exp. 7 – Spectrum of the HydrogenAtom17
The emission spectrum of hydrogen Balmer series: All de-excitation emissions to the nf 2 state EInfinite number of them: ni 3, 4, 5.nf 20.0 eV Contrary to the Lymann one,the Balmer series is visible tothe naked eye!-13.6 eVPHYS 1493/1494/2699: Exp. 7 – Spectrum of the HydrogenAtom18
Review: interference of light Question: How can we measure the wavelength of the emittedlight?Answer: We can use interference!Recall: For slits with spacing d, the condition for constructiveinterference (bright spots) is:PHYS 1493/1494/2699: Exp. 7 – Spectrum of the HydrogenAtom19
Review: interference of light One feature of this equation is the it is wavelength dependent.Consequence: Each wavelength will interfere at a differentangle:A diffraction grating can be used as a wavelength separator!PHYS 1493/1494/2699: Exp. 7 – Spectrum of the HydrogenAtom20
The ExperimentPHYS 1493/1494/2699: Exp. 7 – Spectrum of the HydrogenAtom21
Main goals As usual this experiment is divided in two parts. The first one ispreliminary and used for “calibration”. The second one is theactual measure of interestPart 1: Calibration Determine the lattice constant (“d” in previous eqns.) of thediffraction gratingUse He discharge lamp for a line with known wavelength(effectively a calibration)Part 2: Balmer series Four visible de-excitation emission lines (i.e. wavelengths) Measure the angle of interference Calculate initial state of transitionTipsPHYS 1493/1494/2699: Exp. 7 – Spectrum of the HydrogenAtom22
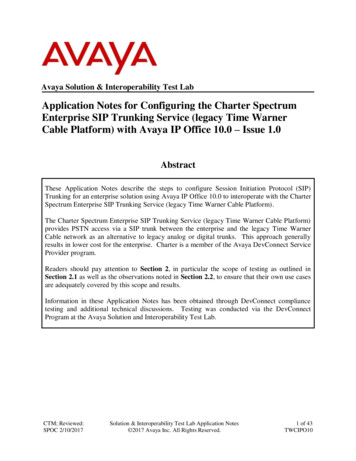
EquipmentYou can rotate thetelescope tube andchange the angle θThis containsthe excitedgas that emitslightThe diffraction grating willsplit the differentwavelengthsThe Vernier scaleallows you to readangles with hightprecisionPHYS 1493/1494/2699: Exp. 7 – Spectrum of the HydrogenAtom23
Equipment Light is emitted from the arc lamp and focused with a lensPHYS 1493/1494/2699: Exp. 7 – Spectrum of the HydrogenAtom24
Equipment When it reaches the diffraction grating, every wavelength isdeviated with a different angle. By looking at the Vernier scaleyou can measure this anglePHYS 1493/1494/2699: Exp. 7 – Spectrum of the HydrogenAtom25
Reading the Vernier scale Vernier scale is a very precise way to measure angles.Fine scale(arcminutes)Coarse scale(degrees)PHYS 1493/1494/2699: Exp. 7 – Spectrum of the HydrogenAtom26
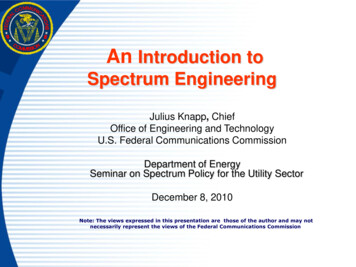
Reading the Vernier scale Vernier scale is a very precise way to measure angles.Fine scale(arcminutes)Coarse scale(degrees)The zero of the arcminute scale will tell you how many degrees youhave rotated the apparatus. 50 degrees plus a bit more than 30arcminutes.PHYS 1493/1494/2699: Exp. 7 – Spectrum of the HydrogenAtom27
Reading the Vernier scale Vernier scale is a very precise way to measure angles.Fine scale(arcminutes)Coarse scale(degrees)Looking at when the fine scale and coarse scale align you candetermine the “little bit”. In this case, they are aligned on the 13 markof the fine scale. So:PHYS 1493/1494/2699: Exp. 7 – Spectrum of the HydrogenAtom28
Part 1: calibration of the grating Using He lamp (yellow lamp), you will determine what thespacing between adjacent slits is.Three steps: Align so that 0th order line is at 0 degrees.Turn the telescope to the left, find first yellow line (m 1) andmeasure angle θL.Turn the telescope to the right, find first yellow line (m 1) andmeasure angle θR.Make sure to record errors for your angle measurements.Take average of both angles. Note that the angle you want touse is the relative angle to the central maximum. This meansthat your angle must be always between 0o and 90oPHYS 1493/1494/2699: Exp. 7 – Spectrum of the HydrogenAtom29
Part 1: calibration of the grating Take as a given the wavelength of the yellow line of He: Using the grating equation and setting m 1, solve for d. Don't forget to propagate errors. Your final calibration result should be:PHYS 1493/1494/2699: Exp. 7 – Spectrum of the HydrogenAtom30
Part 2: Balmer series Replace the helium lamp with the hydrogen one Procedure: For the first and second order lines (m 1 and m 2) do:Measure θL and θR for each spectral line (i.e. dark-purple, purple,greenish-blue, and red line)Calculate the average angle θavgFind the wavelengths λ for each average angle θavg, taking intoaccount the order mDetermine the uncertainty σλ taking into account the error in theangle σθ and the lattice constant σd.Use a weighted average between m 1 and m 2 to find thefinal value offor each colorPHYS 1493/1494/2699: Exp. 7 – Spectrum of the HydrogenAtom31
Part 2: initial energy levels Recall the Balmer’s formula:Starting from that find the initial level ( ni ) as a function of thewavelength and the final level ( nf )Assuming nf 2 find the initial value of n associated to eachobserved wavelengthYou final result will befor each colorPHYS 1493/1494/2699: Exp. 7 – Spectrum of the HydrogenAtom32
Tips I feel like this experiment requires to be careful at the followingfew aspects:1. The experiment is clearly best performed in a dark environment.Try to screen your apparatus from ambient light in the best waypossible (e.g. using the black cloth that you will find on the table)2. As already mentioned, the purple line will most likely look like adark violet one and it will be quite difficult to see it. If you arehaving problems with it ask your TA. If that doesn’t solve theproblem neither, it is ok to skip it3. Remember to always measure your angle with respect to thecentral line. There are no negative angles!PHYS 1493/1494/2699: Exp. 7 – Spectrum of the HydrogenAtom33
PHYS 1493/1494/2699: Exp. 7 – Spectrum of the Hydrogen Atom 2 Introduction The physics behind: The spectrum of light The empirical Balmer series for Hydrogen The Bohr model (a taste of Quantum Mechanics) Brief review of diffraction The experiment: How to use the spectrometer and read the V