Transcription
DATE:June 2013TO:MSU Board of Governor’s Programs and Planning CommitteeFROM:Frank EinhelligSUBJECT: Perspectives on Graduate Student Profile, Retention, and CompletionExecutive SummaryOver two-thirds of MSU graduate students are from Missouri, which is a decrease over the past decade.International and domestic student percentages have grown to 18% and 13%, respectively. The full-time studentproportion has increased to 52% as health-care programs and international student numbers increased. Accessfor part-time students has been expanded by offering via online 12 degree programs and 9 graduate certificateprograms. About 44% of MSU graduate students have a prior degree from MSU and the Accelerated Master’soptions are helping attract some of the best performing undergraduates to continue as MSU graduate students.Graduate students are provided a number of workshops and other out-of-class opportunities to help them besuccessful. The retention of first-time graduate students from program entry to the next year is quite good at85%. Six-year graduation data for students entering in AY06-7 show almost two-thirds have completed theirgraduate degree, and this percentage increases slightly with the full 8-years allowable. Other analyses on earlierstarting years show a final completion rate of 70%. The average time-to-degree is slightly less than three years.Considerable variation among programs is evidenced in degree-program completion and time-to-degree data.Graduate ProfileUnderstanding the graduate profile is important for a perspective on what might be termed “graduatesuccess.” While over two-thirds of MSU graduate students are from Missouri, the percentage ofgraduate students coming from out-of-state has been trending upward and these students now make up31% (Table 1). The average age of graduate students is over 30 years, and thus in the graduatepopulation the concept of “non-traditional” does not have the same meaning as for undergraduates.The proportion of international students has shown a marked increase.Table 1.MSU graduate student profile based on headcount.CategoryMissouri ResidentsOut-of-State (Domestic)Out-of-State (International)MinorityFemaleFirst-time Degree SeekingAverage Student AgeFall 200978%10%12%4%58%20%32Distribution of StudentsFall 2010Fall 201172%72%13%13%15%15%7%7%59%60%19%22%3131Fall 201269%13%18%7.5%61%23%311
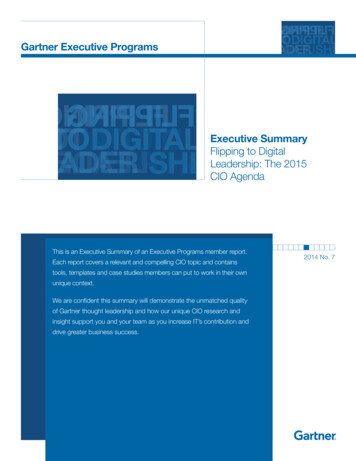
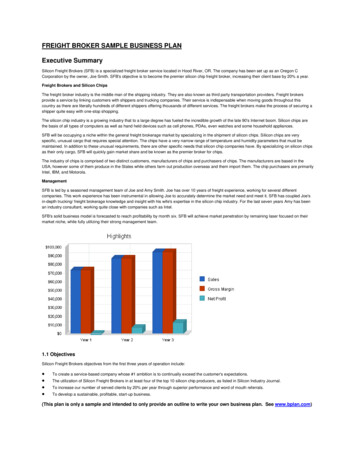
Graduate students are classified as part-time when enrolled in less than nine credits in a semester or less thanfive credits in the summer. For the last three years the ratio of part-time to full-time students has been aboutequal, which is a major change from 10 years ago when part-time students dominated the mix (Table 2).Table 2. MSU graduate headcount part-time to full-time enrollment comparison.Percentage Part-time and Full-Time Students – Fall Term2003 2004 2005 2006 2007 2008 2009 2010 2011 fication20027129Part -TimeFull-TimeThe two primary factors that account for the increase in full-time enrollments are: expansion of programs available and student number admitted in the health science programs (i.e., PhysicalTherapy; Audiology; Physician Assistant Studies; Family Nurse Practitioner specialization; etc.); and an increase in international students, as they are all full-time by Visa requirement (Figure 1).International Graduate Student EnrollmentHeadcount all SemestersFigure 1. Trend in International Student EnrollmentEven though full-time student numbers have increased and the percentage of students classed as full-time hassignificantly increased, graduate education opportunities at MSU have been serving the multiple needs of thepart-time graduate students by increasing access pathways. This has been, in part, by making available degreeprograms in the evening, online, or some combination of these two modalities.Twelve graduate degree programs and 9 graduate certificates are currently available online (Table 3; ograms.htm ). Classes for a number of these programs (but notall) are also available in the traditional face-to-face format. When evening programming is taken into account,approximately half of the graduate degree programs have access by either online, evening, off-campus, or somecombination of these strategies to increase their access availability to the part-time student population (Table 3).2
With the June 15, 2013 approval of the M. of Occupational Therapy program, MSU now offers students achoice of 52 graduate programs, and several of these have two or more options within a program. Further, 22graduate certificates are available and all certificates can either feed into a graduate degree program or can betaken as a free-standing certificate.Table 3. Graduate degree and certificate programs available online.Graduate-Level Online Degree ProgramsAdministrative Studies (M.S.)Computer Information Systems(M.S.) –first week oncampusCriminology and Criminal Justice (M.S.)Doctorate of Nursing Practice (D.N.P.)Early Childhood and Family Development (M.S.)Elementary Education (M.S.Ed.)History, American Studies Track (M.A.)Master’s of Business Administration (M.,B.A.)Nursing, Nurse Educator Track (M.S.N.)Project Management (M.S.)Special Education, Visual Impairment Emphasis (MSEd)Theatre (M.A.)Graduate Certificate Programs (12-18hrs)Conflict and Dispute ResolutionEducational Technology Specialists(exceptpracticum)Homeland Security and DefenseHistory for TeachersProject ManagementSports ManagementScreening Writing for Television and FilmPost-Master’s Nurse EducatorOrientation and MobilityTable 4. MSU graduate programs that can be completed in the evening or somecombination of evening and online class work.Graduate-Degree Evening Programs*Accountancy (M.Acc.)*Business Administration (M.B.A.)*Communication (M.A.)Counseling (M.S.)Criminology (M.S.)Early Childhood & Family Development (M.S.)Educational Administration (M.S.Ed.)Educational Administration (Ed.S.)Educational Leadership (Ed.D.)**Educational TechnologyElementary Education (M.S.Ed.)English (M.A.)Global Studies (M.G.S.)Health Administration (M.H.A.)Health Promotion & Wellness Management (M.S.)Music (M.M.)Public Administration (M.P.A)Public Health (M.P.H.)Literacy (M.S.Ed.)M. Natural and Applied Science (M.N.A.S.)*Religious Studies (M.A.)Social Work (M.S.W.)*Special Education (M.S.Ed.)Student Affairs (M.S.)Writing (M.A.)* Degree can be completed in evening, but may have day class available as well.**Joint program with the University of Missouri - ColumbiaIn addition to students in degree programs, an important characteristic of the MSU graduate profile is that over500 students are taking graduate courses who are not pursuing degrees (Table 5). Non-degree graduate studentsinclude those who already have a master’s, teacher certification students, certificates programs, and othersenrolled post-baccalaureate with a variety of goals. The non-degree fraction of students has been decreasingover the past ten years (Table 5).3
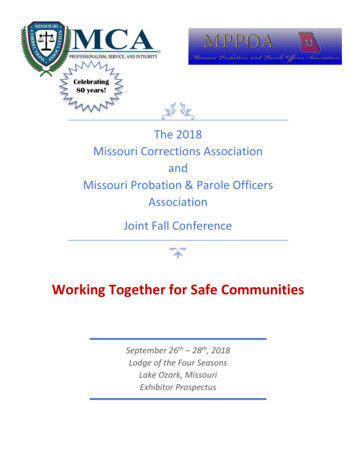
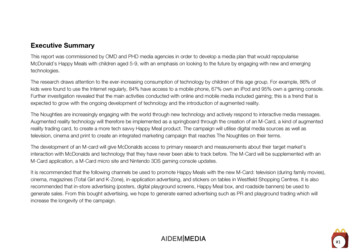
Table 5. Graduate students not enrolled in masters or doctoral degree programs201020112012Fall Semester20052006200720082009529533512Total Non-Degree Students797741656631569Percent of all Grad. Students 24.5% 24.4% 20.8% 19.3% 16.8% 15.9% 16.8% 15.5%Forty-four percent of MSU graduate students have a prior degree [typically undergraduate] from MSU (Table6). In the last decade MSU focused on attracting strong-performing undergraduate students through AcceleratedMaster’s (AM) options that allow an undergraduate student to be accepted to a graduate program while a junioror senior. These students can take a few graduate credits while still an undergraduate. Approximately 200graduate students of the past year came through the AM options. About 300 current undergraduate students havebeen accepted into the AM options which are available in 32 graduate areas.Table 6. Enrolled graduate students having a prior degree from MSU.AY 2010-1142.2%AY 2011-1243.3%AY 2012-1344.0%RetentionStudent retention is often measured as the percentage of students who have returned one year after starting aprogram. On that basis, graduate retention is strong at approximately 85% (Table 7).Table 7. Fall to fall retention or return across all new full- and part-time graduate students.Fall 09 to Fall 1084.12%Fall 10 to Fall 1185.14%Fall 11 to Fall 1285.11%Degree Completion: GraduationA snapshot of the percentage of MSU graduate students completing degree programs is illustrated by the 6-yeargraduation rate of students who entered in Academic Year 2006-07. The average aggregated percent completionacross all programs is 73% (Fig. 2). Our policy is to limit pursuit of a graduate degree to 8 years, and somestudents going part-time will take this full time period allowed to complete a graduate program. A completionrate based on the full 8 years will be a slightly higher percentage. A graduation rate of 70% was found in ananalysis completed for earlier starting years of student admissions, and taking into account 8-years to a degree,so the particular cohort shown here suggests an improved graduation rate. It should also be noted that theCHHS data in Fig. 2 for nursing represents a starting cohort who were caught in a transition period when themasters program in Family Nurse Practitioner moved to a doctoral degree (DNP). This program transition hasdelayed the completion of some students, resulting in the 6-year graduation data showing a lower completionpercentage than has been the past history in nursing.4
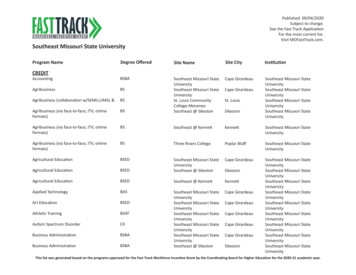
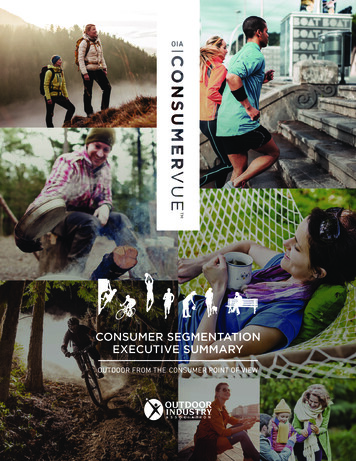
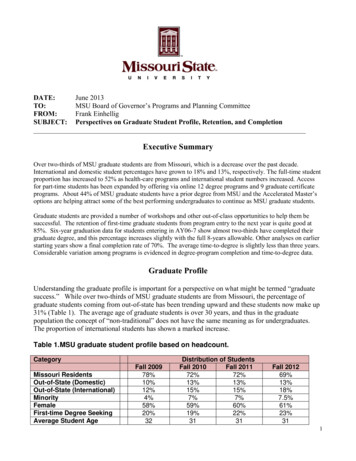
Figure 2. Six-year graduation rate for MSU graduate students across all programs.Time to DegreeThere is a wide range of time-to-degree across graduate programs and even within a program, as one wouldexpect from the graduate profile and the many different clienteles served. This variable is also influenced by thedifferent length of degree programs in terms of credit hours or the absolute required time in the case of somefull-time, cohort programs. For example, the Doctorate of Audiology program is a full-time student programthat takes four years.The average time-to-degree across all programs is slightly less than three years for students graduating in thepast five years (Fig. 3). These data are calculated as the elapsed time span from the first course used on astudent’s Program of Study to the time of graduation. COED-degree programs have the longest average timeto-degree at just over four years (Fig. 3), and COB has the shortest at 2.04 years.Appendix A has time-to-degree data broken out by Colleges and a comparison is shown between the last fiveyears and previous five years (Appendix A, Fig 4). The data comparing the two five-year periods show mostprograms have been fairly consistent in this variable in the two periods.5
1010No. in bars sample sizeMasters & Prof. Doc. overall mean 2612969788380PA StudiesCSDSocial WorkPsychologyCell & Mol BiolPT (DPT)Nurse AnesthNursingPublic HealthHealth P & W MgtAudiology (AuD)CriminologyDSSGlobal Stud (MIAA)Public AdminApplied AnthroReligious StudiesHistoryMathematicsChemistryBiologyMaterials SciPlant ScienceGeospatial SciNat & Appl ntancyMBAProject MgtHealth AdminStudent AffairsEarly Child/ Fam DevTeachingElementary EducSpecial EducLiteracy (Reading)CounselingSecondary EducEduc Admin (MSEd)Instruct Media TechEduc Admin (EdS)Admin StudiesMean Time to Completion (yrs)Time-to-Degree: AY 08-12 Graduates (5 years)CHHSCHPACNASCOALCOBACOEmean 2.51 yrmean 2.75mean 2.73mean 3.31mean 2.04mean 4.33Graduate ProgramsFigure 3. Average time from start to final graduation for students completing degrees in 2008-12.Assistance for Student Success Graduate Student Orientation. One-day program for all new students at the start of the semester.Many departmental programs also have their own, separate orientation program.Teaching Assistant Orientation. One-day program at the start of the semester supplemented bydiscipline-level training programs for TA’s, Some programs run throughout the teaching semester.Graduate Assistantships. Approximately 500 students gain the experience and personal developmentthat comes with work as a graduate assistant, and they become vested in MSU in the process.Graduate College Workshops. Periodic, open workshops on selected topics such as How to Write anAbstract, Thesis Writing, Use of Human Participants in Research, and others.Program Directors. With a few exceptions, graduate programs have a faculty program director who isthe initial advisor for new students. The Program Director often continues as the student’s advisor.Thesis Advisor. Students doing a thesis work with a research advisor and an advisory committee of atleast three faculty.Thesis Research Assistance Funding. The Graduate College has a research-funding program that helps,partially, on some of the direct expenses. (Requires application and review).Research Presentation Funding. The Graduate College provides some financial help to students forpresentation of research at regional and national meetings. (Application and review) Several academicdepartments also provide limited financial support.Graduate Interdisciplinary Presentation Forum. This Forum provides an annual venue for all graduatestudents to present their work.Writing for Graduate Students. Program scheduled for AY2013-14 by Provost Fellow for Writing,Stephanie Norander.6
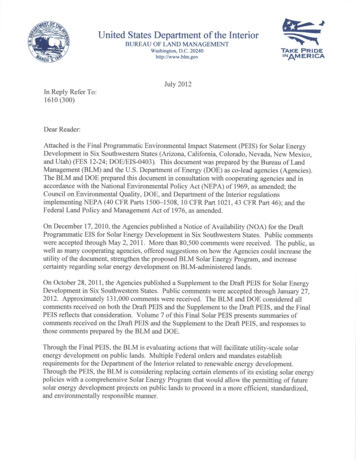
Appendix m0COBAY 08-12 (mean 2.04)AY 02-07 (mean 2.39)No. in bars sample size4423080176134121116521852513853Health AdminMBAProject Mgt0Accountancy0CIS.Mean Time to Completion (yrs)B48No. in bars sample sizeAY 08-12 (mean 3.31)AY 02-07 (mean 3.11)EnglishA.89677Mean Time to Completion (yrs)Figure 4. Time-to-Degree by program and Colleges comparing AY 02-07 and AY 08-12.A COAL; B COB; C CHPA; D CHHS; D COE; E CNAS (includinginterdisciplinary Plant Science from SAGR)7
D.1216Social WorkCell & Mol BioApplied Anthro441372528No. in bars sample size0232967HistoryReligious Stud31395644936521CHPAAudiology (AuD)Public Health2915AY 08-12 (mean 2.51)AY 02-07 (mean 2.40)Health P&W Mgt61695648Public AdminGlobal Stud (MIAA)DSSCriminologyMean Time to Completion (yrs)AY 08-12 (mean 2.75)AY 02-07 (mean 2.81)PT (DPT)Nurse Anesth3748220129CSD4Nursing136837062107970PA StudiesPsychologyMean Time to Completion (yrs)C.55443322110CHHSNo. in bars sample size433221108
F.Resource Plan81719Educ Admin (EdS)Educ TechnologyEduc Admin (MSEd)Literacy (Reading)CounselingSecondary EdSpecial EdElementary EdEarly Child/Fam AY 08-12 (mean 4.33)AY 02-07 (mean 4.08)Geospatial Sci4030546816181093222AY 08-12 (mean 2.73)AY 02-07 (mean 2.89)Nat & Appl SciBiologyMaterials SciPlant SciChemistry5TeachingStudent AffairsMean Time to Completion (yrs)8Math2314Mean Time to Completion (yrs)E.COENo. in bars sample size0CNASNo. in bars sample size4433221186644220509
Forty-four percent of MSU graduate students have a prior degree [typically undergraduate] from MSU (Table 6). In the last decade MSU focused on attracting strong-performing undergraduate students through Accelerated Master’s (AM) options that allow an undergraduate student to be