Transcription
ENGINEERING FOR RURAL DEVELOPMENTJelgava, 23.-24.05.2013.ANALYSIS OF STATE OF LACQUERED LAYER OF METAL SHEET AFTERCORROSION LOADJaroslava Svobodova, Sylvia KusmierczakJan Evangelista Purkyně University in Ústí nad Labem, Czech Republicsvobodova@fvtm.ujep.cz, kusmierczak@fvtm.ujep.czAbstract. The aim of this paper is to perform a microscopic analysis of the state of the sheet metal after the loadin corrosive environment. As an experimental material metal sheets intended for laboratory tests are used, onwhich to the new surface pre-treatment based on nanotechnology before painting were applied. The sheets willbe exposed to corrosive environment in several time periods. The change in the properties of the lacqueredlayer depending on the time of corrosive action will be monitored. Based on the outcome conclusions andrecommendations for manufacturers of coated sheets will be elaborated.Keywords: lacquered layer, corrosion load, metal sheets, chemical pretreatment, nanotechnology.IntroductionSurface treatments have substantial influence on the lifetime and the final quality of lacqueredproducts. Each product is exposed during its lifetime to external conditions, which act on its surface.The largest part of the product is exposed to atmospheric conditions. Products and structures aresubject to corrosion due to aggressiveness of atmosphere. The main cause of corrosion is theatmospheric humidity and the corrosion rate is dependent on the presence of gaseous impurities orsoluble solid impurities. The most aggressive contaminants include SO2, NaCl, hydrogen sulfide,chlorine, hydrogen chloride, industrial dust, ash, nitrogen oxides, etc. [1].To achieve the long-term durability of engineering products surface treatments and surface pretreatments are used. Surface pre-treatments are intended to remove dirt from the surface of the basematerial and to the creation of suitable surface for applying and good adhesion of the final coating.Surface pre-treatments can be divided into mechanical and chemical. Mechanical pre-treatment used inthe area of lacquering is mainly sanding and blasting. Chemical pre-treatments most often are used indegreasing solvents and organic phosphating. Phosphating is a considerably commonly used method,however, at present by legislation on environmental protection pressure is exerted to restrict the use ofhexavalent chromium, reduce heavy metals and improve the quality of wastewater discharged frommanufacturing companies. Modern chemical surface pre-treatments based on nanotechnology attemptto eliminate these undesirable impacts on the environment. These are nanopassivating layers, whichcould in the future replace conventional phosphating processes. These nanolayers are able to providegood conditions for adhesion between the coating layer and the base material similar to phosphating,increase productivity and are environmentally friendly.The bases of these nanoproducts are highly reactive silanes, which create during the reaction withthe surface of the material a chemical bond. These silanes create a highly cross-linked inorganic layeron the surface of material having a thickness of 50-100 nm. Thanks to this layer formed at the surfaceof the material the barrier effect is increasing the corrosion resistance of the material especially incombination with the subsequent powder coating. Inorganic layer is defined as a highly crosslinkedfilm firmly anchored to the surface material by chemical bonds Si – O – M (M-basic material). Thefilm, which arises on the surface of the material, has a homogeneous structure and a thickness in therange of 50 to 100 nm. Nanopassivating product ZircaSil is multimetallic and therefore can be usedfor pre-treatment of Fe materials, galvanized materials and aluminum materials. The corrosionresistance of these coatings is comparable with the technology of phosphating [2].The aim of this paper is to analyze the behavior of the experimental samples after corrosion load,for which a nanopassivating layer was used for the pre-treatment of the surface before applying thepowder coating. The samples were burdened in the corrosion chamber for 480, 720 and 1000 hours.After removal from the corrosion chamber the samples were evaluated according to the standards CSNEN ISO below. For samples microstructural analysis was also performed at which the surface qualityof basic material of the applied powder coating was evaluated and the surface roughness of the basematerial was measured before applying the paint. After performing all tests and analyzes conclusions249
ENGINEERING FOR RURAL DEVELOPMENTJelgava, 23.-24.05.2013.and recommendations will be elaborated for the use of a new nanopassivating layer ZircaSil inpractice.Description of the experimental samplesThe experiment was carried out using laboratory material Q-Panel Fe. This material is being usedfor testing of surface coatings. The basic material is supplied by the manufacturer as easily blast. Thechemical composition of the material is shown in Table 1.Table 1Chemical composition of the of the material Q-Panel FeMaterialQ-panel FeMax. C %Max. Mn %P%S%0.120.600.0450.045Chemical pretreatment of the base materialThe material was pre-treated with alkaline degreasing and subsequently passivated with theproduct ZircaSil .Powder coatingAfter performing the chemical pretreatment powder coating was applied to the samples.Specifically, the powder coating TIGER Drylac Series 29 – light gray color was used. The sampleswere dried at temperature of 90 to 100 ºC per 10 min., temperature and time of paint burning180 C/20min.The experimental samples were provided before the corrosion test by cross-cut according to thestandard CSN EN ISO 17872 Paints and varnishes – Guidelines for the implementation ofcuts throughout coating on metal samples for corrosion tests.Corrosion loadThe experimental samples were corrosion loaded in salt spray of corrosion diagnostic equipmentLIEBISCH . The working conditions of the corrosion chamber were set according to the standardCSN EN ISO 9227. The set parameters are shown in Table 2.Table 2Parameters of corrosion testParameters of the testTemperatureThe average rate of the accumulation of spraymist from a horizontal collector area 80cm²The concentration of sodium chloride(accumulated in the solution)pH ( accumulated in the solution )Corrosion load timeNeutral salt spray35 ºC 2 ºC1.5 ml·h-1 0.5 ml·h-150 g·l-1 5 g·l-16.5 to 7.2480, 720, 1000 hoursAnalysis and evaluation of the samples after corrosion loadThe experimental samples were gradually removed from the corrosive environment and thefollowing tests and analyzes were performed: CSN EN ISO 4628-8 Paints and varnishes – Evaluation of degradation of coatings –Classification of quantity and size of defects and of intensity of uniform changes inappearance - Part 8: The degree of delamination and corrosion around the cut CSN EN ISO 2409 Paints and varnishes – Cross-cut test CSN EN ISO 4624 Paints and varnishes – Pull-off adhesion test250
ENGINEERING FOR RURAL DEVELOPMENT Jelgava, 23.-24.05.2013.Microstructural evaluation: analysis of the behavior of the surface layer after corrosion load,measurement of the layer thickness, roughness measurements on the samples without powdercoating.In Table 3 designation of the experimental samples is indicated, where the basic material Q-panelFe (gently blast cleaned) was pretreated with alkaline degreasing and passivated with nanoproductZircaSil .Table 3Designation of experimental samplesCorrosion load time480 hours720 hours1000 3-4Evaluation of experimental samples after corrosion load according to standards CSNEvaluation of the samples according to the standards CSN listed above is shown in Table 4.Table 4Evaluation of samples after corrosion load according to the standards CSNSampleThe degree ofThe degree ofCrossPull-offCorrosiondelaminationcorrosioncut testadhesion testload timeA1-13Ri 20Group A –A1-25Ri 20480 hA1-34Ri 2015,37 MPa 0 %A1-44Ri 30A2-15Ri 30Group B –A2-25Ri 20720 hA2-35Ri 30A2-45Ri 4015,50 MPa 0 %A3-15Ri 40A3-25Ri 50Group C –1000 hA3-35Ri 40A3-45Ri 5015,54 MPa 0 %The degree of delamination: 1 - very small, 2 - small, 3 - moderate, 4 - high, 5 - very high.The degree of corrosion: Ri 1 - very small, Ri 2 - small, Ri 3 - moderate Ri 4 - large, Ri 5 - very high.Cross-cut test: grade 0 - edges of cuts are completely smooth, no grid squares are damaged.Pull-off adhesion test: pull-of strength in MPa – percentage share of the area and character of thebreach of the system under test. The pull-off adhesion test was carried out on three samples that wehave chosen as a representative from each group. In Table 5 the samples A1-3 A2-4, A3-4 aftercorrosion load are illustrated.Table 5Samples after corrosion loadSampleA1-3A2-4Surface pretreatment –alkalinedegreasing nanopassivation251A3-4
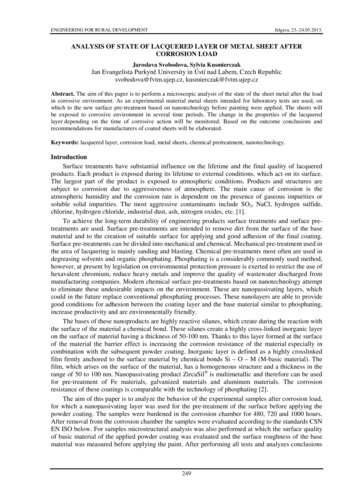
ENGINEERING FOR RURAL DEVELOPMENTJelgava, 23.-24.05.2013.For all samples after corrosive load delamination and corrosion occurred. The degree ofdelamination and corrosion is dependent on the time of corrosion load and reaches values – fordelamination 3-5 (mild-very large) – for corrosion 2-5 (small – very large). The cross-cut test isevaluated for all the samples of level 0. It means that the coated layer on the intact place aftercorrosion load is perfectly adjacent to the base material. The pull-off test also demonstrated excellentlacquer adhesion to the base material. Although there was on the surface of the samples extensivedelamination, we can conclude that the corrosion resistance of the samples in the case of 480 and 720hours is good.Microstructural analysisMicrostructural analysis was performed on a confocal laser microscope Olympus LEXT 3100.Within the microstructural analysis we made measurement of the layer thickness, roughness of thesample without powder coating, evaluation of the surface layer after corrosion load.Measurement of the thickness of the coatingMeasurement of the layer thickness was carried out on the samples A1-1, A2-1, A3-1. Themeasurement results are shown in Table 6.Table 6Measuring of the thickness of the coatingThemeasuredthickness ofthe coatingSample A1-1Sample A2-1Sample A3-1Average: 232.8559 µmMax.: 237.5234 µmMin.: 228.0688 µmAverage: 101.5854 µmMax.: 105.6656 µmMin.: 91.8606 µmAverage: 147.1881 µmMax.: 160.5897 µmMin.: 136.239 µmRoughness measurement of the sample surfaceMeasuring of the roughness of the sample surface before applying the final powder coating wasperformed. Roughness was measured on confocal laser microscope Olympus LEXT 3100. The valuesof the roughness measurements are shown in Table 9.Table 9Measurement of the surface roughnessSurface roughness, µmSRz2Measured area, µm1224803.12500144.28722Measured surface, µm11257988.2935Line measurement, 1334Min.SRa6.85095.07977.99983.6107Microstructural evaluation of the lacquered layerFor creating the metallographic sample and evaluation of microstructure we took samples frompainted sheet metal after corrosion load. These samples were taken from the place where there was nocoating to peel off and from the place of the cut. Microstructural analysis was performed on a confocallaser microscope Olympus LEXT 3100. Microstructural analysis of the sample A1-1.Fig. 1 shows the continuous, unbroken lacquered layer, which was removed from a place wherethere is no separations from the interlayer of the paint. The average thickness of the lacquered layer is232.9 microns. The surface material is ragged and its average roughness Ra is 5.08 microns. Thelacquered layer does not peel and is close fitting to the base material.252
ENGINEERING FOR RURAL DEVELOPMENTJelgava, 23.-24.05.2013.LacqueredlayerBasicmaterialFig. 1. Lacquered layer A1-1 (a)PottingresinLacqueredlayerBasicmaterialFig. 2. Lacquered layer after delamination A1-1 (b)Figure 2 shows a metallographic specimen of the sample taken from the place of the cut. In Figure2 still separation of the lacquered layer did not occur. As it can be seen from the figure the paintedlayer was under corroded and due to corrosion its degradation occurred. On the surface of the materialcorrosion attack is visible. Sample A1-1 was placed in the corrosion chamber for 480 hours. Microstructural analysis of the sample A2-1.By the sample A2-1 occurred after corrosion load 720 hours to the extensive delamination than bythe sample A1-1. On the surface of the sample taken from the place of intact coating the painted layeris compact and fits well to the surface of the material. Its average thickness is 101.6 microns. On thesample from the place of the cut there is the surface of the material with no surface layer. Paint is fromareas around the cut completely peeled. The surface material is attacked by corrosion. Microstructural analysis of the sample A3-1.Sample A3-1 was placed in the corrosion chamber for 1000 h. On the surface of the sample takenfrom the place of intact coating there is documented lacquered layer without damage. The layer fitsclose against the surface of the base material well. The average thickness of the lacquered layer is147.2 microns. On the sample from the place of the cut it occurred to a very large degradation of thesurface. On the surface of the material corrosion products are visible and corrosion reaches to80 micron under the original surface of the material.Within the microstructural analysis the following was performed: thickness measurement of thepaint, sample surface roughness measurement and microstructural evaluation of the coated layer aftercorrosion load. The thickness of powder coating on the surface of the material was different for eachsample. The greatest thickness of the lacquer was measured for sample A1-1, when the average valuewas 232.9 µm and the minimum thickness of the lacquer in sample A2-1 with an average thickness ofthe coated layer of 101.6 µm. On the samples without surface lacquer the surface roughness of thebase material was measured.The average value of line roughness Rz was 48.1 µm and Ra was 5.07 µm. From the previousresearch we have verified values of roughness of the sheet metal, for which iron phosphating wasused. So, we can say that pretreatment of the surface where instead of iron phosphating a newnanoproduct ZircaSil was used has higher roughness values. This pretreatment therefore providessuitable conditions for anchoring the coating on the surface of the base material. Microstructuralanalysis was performed on the samples A1-1, A2-1 and A3-1. From all the samples metallographicsamples were prepared. The sampling sites for metallographic specimen were chosen in order to253
ENGINEERING FOR RURAL DEVELOPMENTJelgava, 23.-24.05.2013.compare the results of the microstructural analysis to the evaluation of the samples according to theCSN standards. The samples were taken from the place where there is no lacquer peel (a) and from theplace of cut (b).The samples taken from the place (a) showed excellent lacquer adhesion to the material surface asdemonstrated earlier by the cross-cut test and pull-off adhesion test. The samples taken from thecutting point (b) were attacked by corrosion and its extent is dependent on the time of corrosion load.The samples were attacked by pitting corrosion on the surface of the base material. For a sample ofA1-1 the lacquer did not completely peel off after 480 hours of corrosion load. For other samples thesurface lacquer from the surface of the sample completely peeled off and the surface corroded. Forsample A3-1 in place of the cut corrosion reaches to a depth of 80 micron below the surface of thebase material.ConclusionThe aim of this paper was to analyze the condition of painted sheet metal after corrosion load, onwhich a new technology nanopassivation has been used. The prepared samples were loaded in thecorrosion chamber for 480, 720 and 1000 hours. The samples were gradually removed from corrosiveenvironment and tests were performed according to the CSN standards and after that microstructuralanalysis was performed.Based on the evaluation of the experimental samples according to the CSN standard and themicroscopic analysis we can make the following conclusions for the use of the new technology ofnanopassivation in practice. Undamaged coating exhibits very good adhesion to the base material asdemonstrated by the grid test, pull-off adhesion test and microscopic analysis. In the vicinity of the cutafter 720 hours extensive separation of the paint layer and corrosion occurred. This degradation can becaused by incorrect choice of the surface finish or poorly applied chemical pretreatment of the surface.Recommendations for improving the life of the painted parts are powder coating applications where itwould be appropriate to achieve a uniform coating thickness across the entire surface of painted sheetmetal. The new method of nanopassivation ranks among the modern methods of chemical surface pretreatments. The method is environmentally friendly and economically beneficial. When using thismethod of surface preparation it is necessary to pay attention to maintain the correct application of thetechnological process and the subsequent application of powder coating on the pre-treated surface.References1. Michna Š., Nová I. Technologie a zpracování kovových materiálů. Prešov: Adin s.r.o., 2008. 326p.2. Palko M. ZircaSil - nová řada již známého systému NANO-technologií pro povrchové úpravy.[online] [01.03.2010.]. Available at: http://itsbrno.cz, 2010. 4 p.3. Český normalizační institut ČSN EN ISO 4628-8 Nátěrové hmoty – Hodnocení degradace nátěrů– Klasifikace množství a velikosti defektů a intenzity jednotlivých změn vzhledu – Část 8:Hodnocení stupně delaminace a koroze v okolí řezu. Praha: 2005. 12 p.4. Český normalizační institut ČSN EN ISO 2409 Nátěrové hmoty – Mřížková zkouška. Praha:2007. 16 p.5. Český normalizační institut ČSN EN ISO 4624 Nátěrové hmoty – Odtrhová zkouška přilnavosti.Praha: 2003. 20 p.6. Svobodová J., Kuśmierczak S. Effect of Nanotechnology Pre-treatments on a Component Life.Toyotarity, 2012, pp. 88-100.7. Svobodová J., Kuśmierczak S. New Trends in Surface Pre-treatment. Toyotarity, 2012, pp. 62-72.8. Kuśmierczak S., Svobodová J. Microscopic Quality Evaluation of Lacquered Steel Sheets.Toyotarity, 2012, pp. 86-99.254
CSN EN ISO 4628-8 Paints and varnishes – Evaluation of degradation of coatings – Classification of quantity and size of defects and of intensity of uniform changes in appearance - Part 8: The degree of delamination and corrosion around the cut CSN EN ISO 2409 Paints and varnishes – Cross-cut test