Transcription
2 0 2 0 U N A C C O U N TA B L E A N D U N A F F O R D A B L UBLICPENSIONLIABILITIESEXCEED 5.8 TRILLION1
UNACCOUNTABLE AND UNAFFORDABLE
Unaccountable and Unaffordable 2020Unfunded Public Pension Liabilities Exceed 5.8 TrillionAbout the American Legislative Exchange CouncilThe Unaccountable and Unaffordable 2020 report was published by the American Legislative Exchange Council (ALEC) as part of itsmission to discuss, develop and disseminate model public policies that expand free markets, promote economic growth, limit thesize of government and preserve individual liberty. ALEC is the nation’s largest nonpartisan, voluntary membership organization ofstate legislators, with more than 2,000 members across the nation. ALEC is governed by a Board of Directors of state legislators.ALEC is classified by the Internal Revenue Service as a 501(c)(3) nonprofit, public policy and educational organization. Individuals,philanthropic foundations, businesses and associations are eligible to support the work of ALEC through tax-deductible gifts.About the ALEC Center for State Fiscal ReformThe ALEC Center for State Fiscal Reform strives to educate policymakers and the general public on the principles of sound fiscal policyand the evidence that supports those principles. We also strive to educate policymakers by outlining the policies that provide the bestresults for the hardworking taxpayers of America. This is done by personalized research, policy briefings in the states and by releasingnonpartisan policy publications for distribution such as Rich States, Poor States: ALEC-Laffer State Economic Competitiveness Index.Managing Editors:Contributing Authors:Jonathan WilliamsChief EconomistExecutive Vice President of PolicyAmerican Legislative Exchange CouncilThomas SavidgeResearch Manager, Center for State Fiscal ReformAmerican Legislative Exchange CouncilThomas SavidgeResearch Manager, Center for State Fiscal ReformAmerican Legislative Exchange CouncilJonathan WilliamsChief EconomistExecutive Vice President of PolicyAmerican Legislative Exchange CouncilLee SchalkSenior Director, Tax and Fiscal Policy Task ForceAmerican Legislative Exchange CouncilSkip EstesAssociate Director, Tax and Fiscal Policy Task ForceAmerican Legislative Exchange CouncilAcknowledgments and Disclaimers:The authors wish to thank Lisa B. Nelson, Christine Phipps, Alexis Jarrett and the professional staff at ALEC for their valuable assistancewith this project.All rights reserved. Except as permitted under the United States Copyright Act of 1976, no part of this publication may be reproducedor distributed in any form or by any means or stored in a database or retrieval system without the prior permission of the publisher.The copyright to this work is held by the American Legislative Exchange Council. This study may not be duplicated or distributed inany form without the permission of the American Legislative Exchange Council and with proper attribution.Contact Information:American Legislative Exchange Council2900 Crystal Drive, Suite 600Arlington, VA 22202703.373.0933www.alec.org
2 0 2 0 U N A C C O U N TA B L E A N D U N A F F O R D A B L ETABLE OF CONTENTSIntroduction .1Section 1: Key Findings .2Section 2: Poor Assumptions Make Poor Pensions .8Section 3: Reform Can Help States Trying to Tread Water .12Appendix: Methodology .14References .16
INTRODUCTIONINTRODUCTIONUnfunded state pension liabilities total 5.82 trillion or 17,748 for every man, woman and child in the United States.State governments are obligated, often by contract and stateconstitutional law, to make these pension payments regardlessof economic conditions. As these pension payments continueto grow, revenue that would have gone to essential serviceslike public safety and education, or tax relief, goes to paying offthese liabilities instead.Unfunded liabilities have increased by more than 900 billionin this year’s report due to several factors:The 10 states with the largest unfunded liabilities, California,Illinois, Texas, Ohio, New York New Jersey, Pennsylvania, Florida,Georgia and Massachusetts have rapidly growing unfundedliabilities. They take up an increasing share of total unfundedliabilities in the country. These states make up 58%of all unfunded liabilities in the country, up from57% last year. Pension investment returns haveagain fallen short of assumptions in this year’sreport, covering FY 2019, with an average of6.5% return instead of the assumed 7.2%.This study uses a risk-free discount rate,expressed as a percent, to determine thevalue of liabilities that pension plans mustpay in the future. The “risk-free” aspect of ourdiscount rate calculation follows the reality thatstates cannot default on their pension promises. This riskfree discount rate is based upon the yields of U.S. Treasury bonds,which means that the rate changes each year. This year, the riskfree discount rate lowered from 2.96% to 2.34%, increasing thepresent value of liabilities. We also measure liability values witha fixed discount rate of 4.5% to account for these changes in therisk-free discount rate.Most state pension plans are structured as defined-benefitplans. Under a defined-benefit plan, an employee receivesa fixed payout at retirement based on the employee’s finalaverage salary, the number of years worked and a benefit2 0 2 0 U N A C C O U N TA B L E A N D U N A F F O R D A B L Emultiplier. Pension plans pay these benefits to millions of publicworkers across the country. These plans accrue assets throughemployee contributions, tax revenue and, in the worst case, bytaking on debt to pay pension promises today. Paying pensionobligations by issuing bonds only kicks the can down the roadto future taxpayers, as they will ultimately be responsible forsolving the pension funding crisis.States are obligated, in some cases constitutionally, to paypension obligations. There are important reforms, however,that can prevent unfunded liabilities from growing in the future.By offering newly elected employees sustainable plans, such ashybrid and defined-contribution plans, similar to how 401(k)plans work for workers in the private sector, states can preventthe rapid growth of unfunded liabilities and give public workersgreater flexibility with their retirement contributions, plusthe ability to take their retirement savings with them to newpositions or new careers.Because of the significant impact unfundedpension liabilities have on state budgetsand individual taxpayers, the AmericanLegislative Exchange Council (ALEC)produces publications to educatepolicymakers and the public aboutthedangerunfundedpensionliabilities pose to core governmentservices and the economy. This reportsurveys more than 290 state-administeredpublic pension plans, detailing assets andliabilities from FY 2011-2019. The unfundedliabilities are reported using three different calculations: Estimates from each respective state Estimates using a risk-free discount rate, which reflectsconstitutional and other legal protections extended tostate pension benefits Estimates using a fixed rate of 4.5%, which comparesfunding ratios and controls for changes in discount rateassumptions over time1
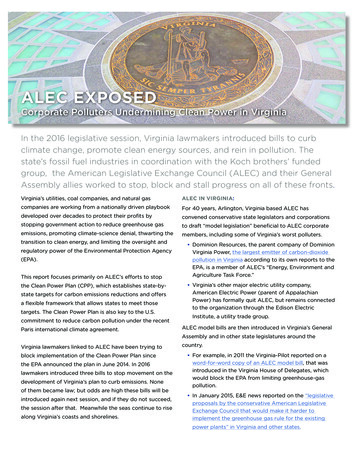
SECTION 1: KEY FINDINGSFigure 1, Table 137Total Unfunded Pension Liabilities, 2020113MT32 ORID5014UT3334AZIA16KSOKNM294818AR28TXIL3015 TN25 24ALSTATE39 VA38 NC2742MSSCGALA43FLHISouth DakotaVermontNorth DakotaWyomingDelawareRhode IslandMaineNebraskaIdahoNew HampshireMontanaWest aOklahomaIndianaNew 111213141516171819202122232425PAWV13RANK444649 9261 BEST17RISK-FREE UNFUNDED LIABILITIES 10,196,806,271 10,209,419,265 11,997,434,609 13,591,478,905 14,102,006,237 18,963,459,987 19,082,764,864 19,099,526,006 19,106,306,953 19,198,501,296 23,149,588,259 24,360,561,619 31,323,107,715 37,007,562,251 43,336,342,256 43,342,547,992 44,001,806,975 47,715,577,572 48,976,700,267 52,065,124,476 52,911,200,935 59,016,137,483 59,208,864,425 66,948,949,617 424344454647484950STATENevadaSouth oradoArizonaMinnesotaConnecticutWashingtonNorth aPennsylvaniaNew JerseyOhioNew YorkTexasIllinoisCalifornia50 WORSTRISK-FREE UNFUNDED LIABILITIES 77,022,271,739 85,441,291,234 89,951,703,249 99,631,050,908 102,373,103,261 102,753,627,887 105,287,199,428 106,868,209,172 107,942,152,600 109,775,895,459 111,208,604,422 115,162,015,369 122,151,299,950 126,298,279,304 136,126,914,592 146,216,045,340 149,825,036,645 217,208,467,450 230,931,024,569 254,408,156,375 323,656,378,765 342,215,439,115 401,505,067,782 405,246,695,783 894,649,357,458Source: Data are based on ALEC Center for State Fiscal Reform calculations. To read the full report and methodology, see ALEC.org/PensionDebt202022NH 10MA 41RI 6CT 36NJ 45DE 5MD 31VTWA
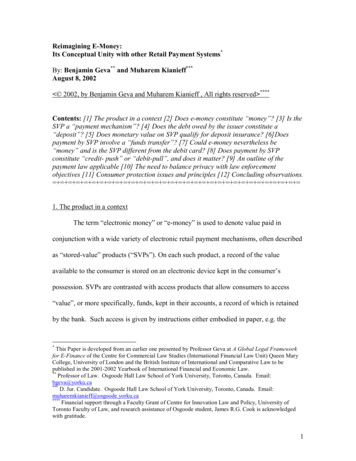
2 0 2 0 U N A C C O U N TA B L E A N D U N A F F O R D A B L EFigure 2, Table 222Total Unfunded Pension Liabilities Per Capita, 20203824MT42 ORNV8UT3320AZIA21KSOKNM261425AR34TX40KY1TN36 idaWisconsinIdahoSouth DakotaUtahNorth CarolinaOklahomaWest VirginiaMichiganAlabamaTexasGeorgiaNew tonIowaNorth DakotaArkansas19 VA9 SDWY43MN74117ME35ND6ID3927NH 16MA 37RI 31CT 48NJ 46DE 18MD 29VTWA1 BEST47UNFUNDED LIABILITIES PER CAPITA 6,345.77 7,859.40 9,873.58 10,113.19 10,169.09 10,691.44 11,526.26 11,543.37 11,646.67 13,157.82 13,592.95 13,630.61 13,654.18 13,846.97 14,111.24 14,119.55 14,196.25 14,481.95 14,796.79 14,829.83 14,877.40 15,123.26 15,523.17 15,743.38 4454647484950STATE50 WORSTUNFUNDED LIABILITIES PER CAPITAMissouriVermontSouth CarolinaMarylandNew YorkRhode OregonNevadaOhioNew MexicoNew JerseyHawaiiConnecticutIllinoisAlaska 16,233.36 16,361.54 16,594.69 16,996.21 17,591.40 17,900.85 18,038.68 18,557.58 19,349.47 19,465.08 20,602.96 21,213.78 21,659.87 22,642.34 22,914.19 23,483.83 24,962.96 25,005.96 27,688.73 28,145.42 28,642.50 31,077.53 31,192.05 31,980.15 42,817.75Source: Data are based on ALEC Center for State Fiscal Reform calculations. To read the full report and methodology, see ALEC.org/PensionDebt20203
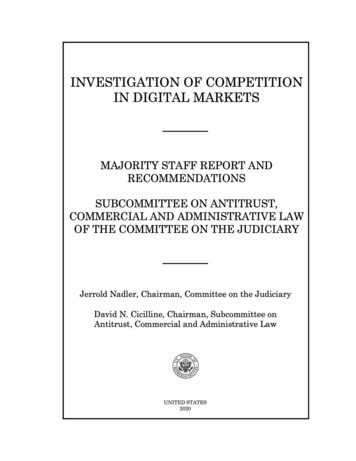
SECTION 1: KEY FINDINGSFigure 3, Table 37Funding Ratios3033MT14 ORID276UT3138AZIA37KS23OKNM21TX16AR2646PA2448 8ND42515KY5TN45 39ALMS20 VA10 NC47WV19LA12AKFLHIFUNDING RATIOSThe funding ratio is one measurement ofthe health of a pension plan. It is the ratio ofplan assets to plan liabilities, expressed as apercent. Each state pension plan should strivefor a 100% funding ratio. The measurementshere use the asset values reported by statesand compares them to the liability values thisreport calculates by using a risk-free discountrate. The important distinction between aplan’s measured liabilities and the risk-freeliabilities are explained in Section 2.SCGA34RANK123456789101144STATEWisconsinSouth DakotaNew YorkIdahoTennesseeUtahWashingtonMaineNebraskaNorth CarolinaIowa1 BESTFUNDING 14%43.82%43.32%43.28%50 WORSTRANK2627282930313233343536STATEFUNDING aryland35.14%Montana33.96%Colorado33.95%New Mexico33.05%North Dakota32.95%Alaska32.71%New st ontRhode IslandMassachusettsNew JerseyHawaiiMississippiPennsylvaniaSouth %24.69%23.87%Source: Data are based on ALEC Center for State Fiscal Reform calculations. To read the full report and methodology, see ALEC.org/PensionDebt2020440NH 35MA 42RI 41CT 50NJ 43DE 13MD 29VTWA
2 0 2 0 U N A C C O U N TA B L E A N D U N A F F O R D A B L EFigure 4, Table 430Change in Funding Ratios from Fiscal Years, 2012-20192217MT47 ORNV7UT1534AZIA632KSOKNMIL383AR1TX48PA823 ME16ND13ID4250NH 9MA 43RI 37CT 28NJ 45DE 44MD 14VTWAKY19 TN29 31AL21 VA46 NC49WV41MSSCGALA233AKFLHI1 BEST3950 WORSTNote: This measurement uses the fixed discount rate of 4.5% to account for changes in the risk-free discount rate that occur kaArkansasWest VirginiaOklahomaKansasUtahOhioNew HampshireNebraskaSouth DakotaPERCENT 3839404142434445464748495012New oloradoMinnesotaNorth 6.05%15.55%15.54%15.11%14.45%14.36%14.31%STATENew MissouriFloridaArizonaKentuckyWyomingRhode usettsDelawareNew JerseyNorth CarolinaOregonPennsylvaniaSouth CarolinaVermontPERCENT e: Data are based on ALEC Center for State Fiscal Reform calculations. To read the full report and methodology, see ALEC.org/PensionDebt20205
SECTION 1: KEY FINDINGSFigure 5, Table 542Percent Actuarially Determined Contribution (ADC) Paid4047MT19 ORID4119UT4338AZIA36KSOKNM484IL3913AR9TXIN4515KY19 TN7 19AL18 VA14 MI1721912WINECOCA19SDWYNVMN194919ME11ND8371 BEST19PERCENT ADC 41516171819191919191919ArkansasNorth CarolinaWest awaiiMaineNew HampshireNew OregonPennsylvaniaRhode IslandSouth DakotaTennesseeUtahWisconsinSouth CarolinaMassachusettsNew hingtonColoradoConnecticutKentuckyMarylandNorth DakotaIllinoisWyomingNew Jersey50 WORSTPERCENT ADC %71.95%71.40%Source: Data are based on ALEC Center for State Fiscal Reform calculations. To read the full report and methodology, see ALEC.org/PensionDebt202065NH 19MA 19RI 19CT 44NJ 50DE 19MD 46VTWA
2 0 2 0 U N A C C O U N TA B L E A N D U N A F F O R D A B L EFigure 6, Table 67Unfunded Liabilities as a Percentage of Gross State Product (GSP)4312MT41 ORNV8UT2431AZIA20KSOKNM44331338AR35TX47KY1TN50 29AL18MS15 VA11 49NYMI22NE921WI3COCA4SDWY42MN63625ME27ND16ID2830NH 14MA 19RI 32CT 39NJ 40DE 5MD 17VTWA1 BEST45PERCENT dianaNebraskaWisconsinDelawareSouth DakotaWashingtonUtahNew YorkFloridaNorth Carolina12North Dakota21.03%13141516171819202122232425TexasNew niaAlabamaVermontArizonaRhode IslandMissouriWest VirginiaLouisianaWyomingSouth CarolinaArkansasConnecticutNew yAlaskaNew MexicoMississippi50 WORSTPERCENT 61.41%Source: Data are based on ALEC Center for State Fiscal Reform calculations. To read the full report and methodology, see ALEC.org/PensionDebt20207
SECTION 2: POOR ASSUMPTIONS MAKE POOR PENSIONSSECTION 2: POOR ASSUMPTIONS MAKEPOOR PENSIONSState government balance sheets are experiencing increasedpressure from growing pension liabilities. This pressure isbecoming more apparent with improved financial reporting. TheGovernmental Accounting Standards Board (GASB) statements67 and 68 went into effect in FY 2014 and 2015, respectively.These changes were discussed extensively in Unaccountable andUnaffordable, 2019.1Most pension plans use historical trends to estimate futureconditions of assets and liabilities.2 Past returns, however, areno guarantee of future performance. As state pension plansinvest their funds in increasingly risky assets, the gap betweenexpected rates of return and actual rates of return widens,with results falling far short of expectations. When investmentreturns come up short of expected returns, taxpayers andplan members must make up the difference through increasedcontributions or employees request the legislature to provideadditional appropriations.Table 7, Figure 7To reflect terminology used in the majority of pension plans,this report will now refer to the actuarial value of assets as thefiduciary net position – FNP – and the actuarial accrued liabilitywill be referred to as the total pension liability – TPL – to reflectthe terminology used by most plans.It is also important to note that the data reflect FY 2019, one yearbefore the economic impact of COVID-19. While FY 2020 financialreports have not been published, initial reports indicate that FY2020 data will show unfunded liabilities increase and investmentreturns fall short of expectations.3INVESTMENT RATE OF RETURNA plan’s assumed investment rate of return is based on a pensionplan’s portfolio of investment assets and their earnings. Howmuch these investments will earn is subject to interest rates andrisks associated with the assets. The assumed rate of return isthus a reflection of the risk of the plan’s investment assets. TheAverage Annual Investment Returns Relative to 1-Year Investment Return for All States, vg. 1-Yr Investment 49%-9.42%13.54%Avg. Investment Return Avg. 1-Yr Investment 6.54%6.43%Avg. Investment Return 7.20%7.71%20%Investment Return (Assumed and Actual)15%10%5%0%-5%-10%Avg. Investment Return AssumptionAvg. 1-Yr Investment Return-15%2001 2002 2003 2004 2005 2006 2007 2008 2009 2010 2011 2012 2013 2014 2015 2016 2017 2018 2019Source: Public Plans Database, Boston College Center for Retirement Research8
2 0 2 0 U N A C C O U N TA B L E A N D U N A F F O R D A B L Ediscount rate is the rate used to determine the value today of theamount a pension plan must pay retirees in the future. To makematters more confusing, investment rate of return and discountrate are often used interchangeably in state financial documents.In the case of public pensions, however, investment rate ofreturn and discount rate are not interchangeable, becausethere are different risk levels associated with pension assets andpension liabilities.4 Over the past four decades, pension assetfunds have changed from low-risk, fixed income investments,such as U.S. Treasury bonds, to an increasingly volatile portfolioof stocks, bonds, and alternative investments.5 This is the resultof lower bond yields over the past 30 years, the desire to chasehigher returns, and the desire from some politicians and planmanagers to use pension funds to advance their own economicdevelopment or political agendas — a perfect storm of badincentives.The figure below shows the disparity between assumed ratesof return, noted by the dotted line, and the actual annual ratesof return, noted by the solid line. Over the past 20 years, theaverage assumed rate of return was 7.71% while the actual1-year investment return was 6.43%, more than a full percentagepoint lower. The result is actual 1-year investment returns overthe past 20 years resemble a roller coaster. This roller coastermakes annual costs more difficult to predict, and, in years ofdownturn, states must increase future contributions to maintaincurrent funding levels.One aspect that has increased the volatility of investmentreturns is politically based investing practices. For instance,environmental, social, and governance (ESG) principles broadlyadvocate investing or divesting pension investments based onvariety of causes.6 Examples include divestments from fossil fuels,tobacco and firearms.7 However, by allowing political causes orsocial issues to drive investment strategies, pension plans couldmiss out on millions of dollars in foregone investment returns.Missing out on those investment returns means plan managersand workers will need to increase their contributions to keeptheir pension plans solvent.While data on pension investment returns for 2020 are slowlybeing published, at the time of this report not enough plans havepublished their data to provide an accurate average of assumedand actual investment returns for the year. As will be discussedin Section 3, many pension plans have struggled to meet targetinvestments even with market recoveries in Q3 and Q4 of 2020.Research by the University of Chicago Law School ProfessorDaniel Fischel found a hypothetical portfolio divested fromfossil fuels produced returns 0.7 percentage points lower onaverage per year than the optimal risk-adjusted portfolio thatdid not divest from fossil fuels over a 50-year period from 19652014.8 This represents a massive 23 percentage point decline ininvestment returns over five decades.California currently has the largest unfunded pension liabilitiesin the United States at over 894 billion, or 22,642 per capita.While poor investment decisions are not the sole cause ofthese massive unfunded liabilities, they are a contributor. Forinstance, the California Public Employee Retirement System andthe California State Teachers Retirement System — CalPERS andCalSTRS respectively — divested from companies tied to tobaccostarting in 2001.9 From 2001-2018, CalPERS lost 3.6 billion ininvestment returns from tobacco divestment alone.10 Californiaalso divested from firearms manufacturers who manufactureguns that are illegal for sale in the state of California, which costCalPERS 11 million in investment returns from 2013-2018.11Contrast California with Wisconsin. Wisconsin does notincorporate ESG divesting into its investment strategy. The Boardof Trustees of the Wisconsin Retirement System clearly states,“Asset classes and sub-asset classes are broadly defined to gainexposure to the entire investable opportunity set and capturethe greatest depth of available investment opportunities to theextent they offer a risk-return trade-off commensurate withSWIB’s return objectives and risk tolerance.”12Reforms passed by the Wisconsin Legislature and Governor ScottWalker in 2011, Acts 10 and 32 incorporated several cost and risksharing measures into the Wisconsin Retirement System (WRS),such as requiring all WRS participants to contribute half of allannual contribution payments for pension plans.13 By requiringparticipants and the state to split the annual contributionpayment every year, Wisconsin’s pension reforms incentivizeprudent investment practices to minimize financial risks andannual costs.14 As shown in Figure 8 below, Wisconsin exceedtheir assumed rate of return by 8.21 basis points in 2020 whenmany pension plans struggled to meet their target investment.These reforms have helped the Wisconsin Retirement Systemmaintain its status as one of the best funded pension systems inthe country for all years measured in this report. These reformshelped safeguard the retirement savings of thousands of publicemployees in Wisconsin while keeping costs relatively low forboth the state and public employees.9
SECTION 2: POOR ASSUMPTIONS MAKE POOR PENSIONSFigure 8Wisconsin Employee Retirement System Assumed VS. Actual Investment Returns, 2001-202030%Act 10 & 32 0%7.00%5.70%1.40%-0.40%2001 2002 2003 2004 2005 2006 2007 2008 2009 2010 2011 2012 2013 2014 2015 2016 2017 2018 2019 2020-8.80%-3.30%-5.40%-20%Actual 1-yr Rate of Return-26.20%-30%Assumed Rate of ReturnSource: Public Plans Database, Center for Retirement ResearchDISCOUNT RATE: ASSUMED VS RISK-FREEDiscount rates are used to measure the level of risk for pensionliabilities and help determine the present value of the amountof pension liabilities owed to public employees in the future.15The Appendix discusses extensively how the present value ofpension liabilities are calculated.As stated previously, states are contractually obligated topay pension liabilities. As pension asset investment volatilityincreases, there has been a major divergence between the riskpremiums of pension assets and liabilities. As the Society ofActuaries’ Blue-Ribbon Panel on Public Pension Plan fundingrecommends, “the rate of return assumption should be basedprimarily on the current risk-free rate plus explicit risk premiumor on other similar forward-looking techniques.”16Because U.S. Treasury bonds are insured with the full faith andcredit of the United States government, the rate of return forthese bonds is the best proxy for a risk-free discount rate. Avaluation of liabilities based on a risk-free rate contrasts sharplywith the overly optimistic assumptions used by nearly everypublic sector pension plan. As economist and pension scholarJoshua Rauh notes:10“The logic of financial economics is very clear that measuringthe value of a pension promise requires using the yields onbonds that match the risk and duration of that promise.Therefore, to reflect the present value cost of actually deliveringon a benefit promise requires the use of a default-free yieldcurve, such as the Treasury yield curve. Financial economistshave spoken in near unison on this point. The fact that thestock market, whose performance drives that of most pensionplan investments, has earned high historical returns does notjustify the use of these historical returns as a discount rate formeasuring pension liabilities.”17This report uses a more prudent discount rate calculated byaveraging 10-year and 20-year U.S. Treasury bond yields tocreate a hypothetical 15-year bond yield to match the 15-yearmidpoint of the amortization schedule of pension liabilities.The discount rate calculated from these bond yields is thebest proxy for a risk-free rate. The 15-year midpoint comesfrom GASB noting “the maximum acceptable amortizationperiod [the length of time to pay liabilities] is 30 years,” andour assumption that pension plans will take the full 30 years topay off liabilities.18 Research has also shown that the midpointof the stream of future benefits for a public pension plan isapproximately 15 years in the future.19 Thus the midpoint of the
2 0 2 0 U N A C C O U N TA B L E A N D U N A F F O R D A B L Eamortization period is used because a lump-sum payment in 15years can be treated as an approximation of the annual benefitliability owed by the plan.20Since the risk-free discount rate depends upon the averageyield of the U.S. Treasury bonds, there have been changes tothe discount rate each year of this report. This year, the riskfree discount rate was 2.34%, a decrease from last year’s 2.96%.In addition, the risk-free discount rate creates a standard formeasuring the present value of pension liabilities for plansthroughout the 50 states. Discount rates can vary dependingon the plan, even for different plans in the same state. Usinga uniform risk-free rate allows for an accurate comparisonof the value of liabilities across pension plans. The risk-freediscount rate used in this year’s report also sharply contrastswith the overly optimistic assumptions used in state financialdocuments, providing a more prudent estimate of the value ofliabilities across pension plans.The actuarially determined contribution rate is the portion(expressed as a percent) that the state must pay that is equalto the payroll of public employees eligible for a pension. Forexample, the PERA contribution rate for Fiscal Year (FY) 2019was 23.28% of a payroll of just under 3 billion – so that portionof the contribution was just under 700 million.21 That amountis then added to the annual increase reserve contribution, thedollar amount the state needs to contribute to increase theplan’s total assets. In FY 2019, that amount was just over 17.5million.22 Thus, the total ADC for the PERA plan in 2019 wasroughly 87 million.If a plan is consistently making ADC payments, it is better
taking on debt to pay pension promises today. Paying pension obligations by issuing bonds only kicks the can down the road to future taxpayers, as they will ultimately be responsible for solving the pension funding crisis. States are obligated, in some cases constitutionally, to pay pension obligations. There are important reforms, however,