Transcription
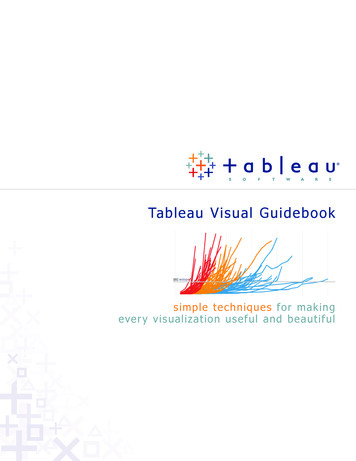
Tableau Visual Guidebooksimple te c hnique s for mak ingever y visualization useful and beautiful
ContentsAsk Your Viz A Question.2Perfecting The Big Picture.3What’s the best view?.3The power of the dashboard.4Orienting your views intuitively.7Pie charts — where to and where NOT to use them.9Sizing: Making sure your viz is visible.10Emphasize the most important data.12Make It Interactive.13Highlighting your best work.16Quick Filters: give the wheel to your users.16Actions — Major League filtering.18Hyperlinking and using the power of the web.20Formatting: Making Your Viz Shine.21Color TV looks better than black and white.So do color vizes.21Fonts: Can you read this?.22Tooltips tell the story.22Make intelligent axesor you’ll just have pretty rectangles.23Labeling your viz in all the right places.24Testing Your Masterpiece.25Don’t let your actions get you into trouble.25Highlighting hijinks.25Wait! Before You Publish .26 2010 Tableau Software, Incorporated.
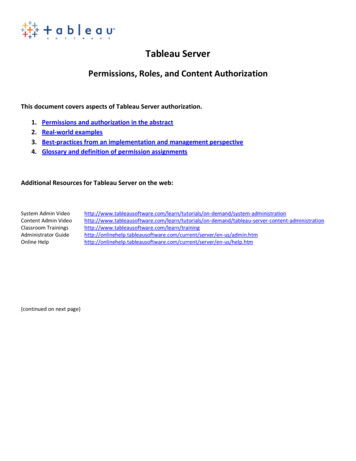
You made a viz! Congratulations, you are part of a smallbut growing group taking advantage of the power ofvisualization. However, going from good visualizations togreat visualizations takes time, patience and attention todetail. Luckily, we have compiled a short but important listof techniques to get you started — happy vizzing!Note: This document does not explain basic steps for buildinga viz, we assume you know how to do that. Rather thisdocument explains tips for making your viz more effective.Good visualizationHome Prices 4,000KPrice 3,000K 2,000K 1,000K 0K0K1K2K3KHome (sq ft)Great visualization 2010 Tableau Software, Incorporated.14K5K
Ask Your Viz A QuestionWhat are you trying to say? The single most important thingyou can do to make a great viz is to know what you’re tryingto say. With the drag-and-drop flexibility of Tableau, anyonecan get lost in a world of scatter plots and geocoding. It isvital that your visualization has a purpose. All of the maps,charts, and cross-tabs you create should work together tofulfill that purpose.How do you know if your viz has a purpose? Well, ask it aquestion to find out. You don’t literally have to interrogateyour screen, but click around and view it for a while. Whatanswers do you find? What other questions does it inspire?What conversations will it start? The point is that yourviewers should be taking something away from their timewith your viz.Here’s how you ask your viz a question:Q: Does profitability at IPO affect stock performance?A: You bet it does!Q: OK fine, but if you remove all of those crazy IPOs fromthe 1990s, does it change?A: Yes, but not as much as you might think. 2010 Tableau Software, Incorporated.2
Perfecting The Big PictureWhether or not your viz tells a story (though especially ifit doesn’t!), you should evaluate whether you’re using thebest kind of visualizations for the analysis that you are doing.Furthermore, you’ll want to avoid bad views. Tableauprovides a good set of defaults that will help you create goodvisualizations, but at the end of the day a human perspectiveis needed to polish a viz to perfection. Here are some thingsto keep in mind:What’s the best view?Although most data can be presented effectively in severaldifferent formats, there are some sets that you will want tovisualize in a certain format most of the time: When you are showing a change over time, you shouldprobably use a time series (a line chart with time on thecolumns shelf) When you are showing where something is, use a map.However, maps are often best used with another chartdetailing what the map displays, like a bar chart sortedfrom greatest to least. When you are showing the highest or lowest value use abar chart. 2010 Tableau Software, Incorporated.3
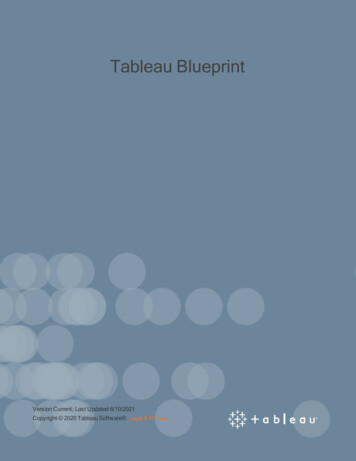
The power of the dashboardA Tableau dashboard is a collection of several relatedvisualizations shown on a single page, usually tied togetherthrough interactivity. (See Make it Interactive below.)Dashboards increase the analytical power of your viz byallowing multiple perspectives on your dataset in the samelocation. They can also be used to combine multiple typesof data into a single location. When designing a dashboardit’s important to structure it properly to ensure it is accessibleto your audience. For example, the dashboard below is anexample of interactive complementary views combined totell a single story.Note: We refer to the entire dashboard a viz and eachindividual pane in the dashboard as a view. For example,“Month over Month” is a view, which is part of the “60 Yearsof Unemployment” viz.60 Years of UnemploymentUnemployment by Decade and YearHighlight 0's2000's6%4%2%0%Month over Month12%J anuary 2009S eptember 1983Unemployment10%8%6%Average 5.6%4%2%Average 116K0%-1,000K-500K0K500K1,000KChange in Employment from Prior Month 2010 Tableau Software, Incorporated.4Source: Bureau ofLabor Statistics
Major Guidelines Place the most important view in the top or top left.Generally, when looking at a dashboard, your eye is firstdrawn to the upper left corner. In this viz the Home Runsand Hits view is used to filter the remaining views, so it’spositioned above everything else. 2010 Tableau Software, Incorporated.5
Group filters and legends (using alayout container) to the right orbottom of your viz. If you havefilters and legends that refer to similar values, formatthe layout container to have a border to increase theconnection between them. For example, the Position,Year, and Games Played filters all refer to individualplayer statistics. The light border around these filtersadds a subtle visual queue that they are related. If your viz has chained interactivity (first view filters thenext view which filters the last view), structure them topto bottom and left to right so that the final view to befiltered is on the bottom, or bottom right. For example,because the Home Runs and Hits view filters the othersit makes sense it would be first. Position legends on the right hand side of the view theydescribe unless circumstances necessitate them beingplaced elsewhere. No matter what, make it clear whichviews your legends apply to. Speaking of color, avoiding using multiple color schemesper dashboard unless there are natural and independentcolor schemes in your data. If you are using multipleschemes, try using the Purple-Gray, Blue-Red and GreenOrange schemes. Generally, keep your dashboards to 2 or 3 views. Whenyou add too many views the big picture can get lost and itbecomes difficult to understand. Remember, you can usemultiple dashboards to tell one story! 2010 Tableau Software, Incorporated.6
Orienting your views intuitivelySometimes, simple changes can go a very long wayto making your visualizations easy to interact with.For example, take a look at the view below:RC/27 Values and 2010 Projections for All NL Position PlayersPosition / Player / Year2008Sandoval,PabloSandoval,PabloHoward, RyanGonzalez,AdrianFielder, PrincePujols, 410.07.38.17.37.56.16.36.56.77.07.38.07.78.0Sum of RC/278.18.48.49.06.05.04.03.02.01.0 2010 Tableau Software, 09200820070.0
Did you find it difficult to read? All of the labels are verticallyoriented, which is generally difficult to read. If you find yourselfwith a view that has long labels that only fit vertically, tryrotating the view. You can quickly swap the fields on theRows and Columns shelves using the Swap toolbar button.The same view is shown below only this time with ahorizontal orientation. The simple change makes thingsa lot easier to read and make comparisons.RC/27 Values and 2010 Projections for All NL Position PlayersPositionPlayerYear1BPujols, 0099.120109.420076.520086.120097.720108.4Howard, Ryan 02.03.04.05.06.07.08.09.0Sum of RC/27 2010 Tableau Software, Incorporated.810.0200811.012.0
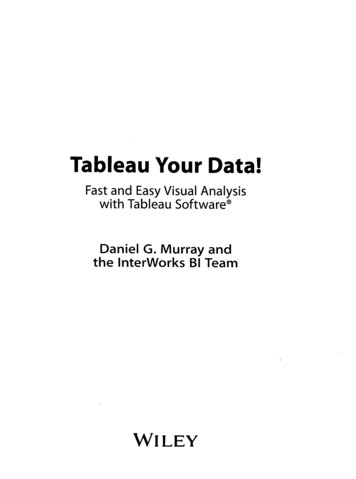
Pie charts —where to and where NOT to use themGenerally AVOID PIE CHARTS, and here’s why: The human eye is not very good at estimating area. You can only compare slices that are right next to eachotherInstead, when trying to make comparisons, try bars. Oureyes are much better at comparing height than area.C an you tell which s lice is larges t?R egionEastAge Group0-1516-2425-4041-6465 This is the same inf ormation represented as bars.C omparis ons are much eas ier.Age Group0-1516-2425-4041-6465 50%Percent of Total Users40%30%20%10%0%That being said, do not be afraid to use pie chartsin the following situations: When the wedges represent a percentbreakdown of a measure When the area of the pie is a measure (so thecircumference is telling the story) When the pie is being used on a map (as here) 2010 Tableau Software, Incorporated.9SouthWest
Sizing: Making sure your viz is visibleBy default, Tableau dashboards automatically resize to fitas much content as you add and as big as you make thewindow. However, when you publish (to the web, blogs,presentations, etc. ) you may find yourself more limited.Make sure that no matter where you are publishing youconstruct the viz at the size you will eventually publishto and use the Range sizing feature to avoid:ScrollbarsWhen you republish a Tableau Public viz at a different sizethan the original you will find you often end up with scrollbars like the ones shown below. If you have alreadyembedded your viz in a website and you changed the size,make sure you re-embed (use new code). In somecircumstances, scroll bars on a particular list view areacceptable. Just try to avoid scroll bars on the overalldashboard as shown below. 2010 Tableau Software, Incorporated.10
Scrunched viewsBe careful that views are not being scrunched so muchthat there’s not enough room to read headers, labels, orunderstand the data. Once you’ve provided enough space,make sure to clear any manual sizing you’ve added unlessit is absolutely necessary. You can clear manual sizing usingthe Clear toolbar button. Clearing the manual sizing willoften also prevent unnecessary scroll bars in your views.ScrunchedH.Enough SpaceHome T ypeD.DuplexMi.MiscSi.SingleTri.Triplex 0K 50,000K 100,000K 0K 50,000KPriceFittingYou can use the Fit options on the toolbar to specify howeach view fits within the window. You can select from thefollowing options: Normal – automatically resizes based on the data in theview and the size of the window. Fit Width – scales the view horizontally to fill the widthof the window. Vertical scroll bars are allowed. Fit Height – scales the view vertically to fill the height ofthe window. Horizontal scroll bars are allowed. Fit Entire View – scales both the width and height to fillthe window. Scroll bars will not be shown; rather alldata will be scaled to fit within the window. 2010 Tableau Software, Incorporated. 100,000KPrice11
Select a fit that matches the data in the view and how itwill be filtered. For example, you may set a simple crosstab that shows a fixed set of data to Fit Entire View so thatit always fills the entire space allotted to it. On the otherhand, a view that is sometimes filtered to a few valuesyou may want to leave as Normal so that the marks aren’tstretched to fill too large of an area.Emphasize the most important dataIn all of your vizes, make sure to have the most importantdata on the row or column shelves. Less important datashould be encoded in color, size, shape, etc. 2010 Tableau Software, Incorporated.12
Make It InteractiveInteractivity can be the difference between a horriblyconfusing viz and an all-star analysis. However, needlessinteractivity can take an all-star analysis and make it useless.This section will teach you how to use interactivity well, butremember this: only use interactive views when you need itto guide the story or if there is too much detail to show allat once.Color LegendHighlightingCall attention tospecific values byselecting a valuein the color legend.Home P rices 4M 3,730K 3,426K 3MPriceQuick FiltersQuickly include andexclude data fromthe view with checkboxes, radio buttons,sliders, and more.These can apply to asingle view or makeit global to apply toall views. 3,350K 2M 1M 0M0K1K2K3K4K5KHome (s q ft)TooltipsThese “pop-ups” are an excellent way forusers to get more details about your dataquickly. They can also be used to instructusers on other interactivity.Dynamic Data LabelsTableau allows you to label your marksin a variety of different ways. If youexpect your consumers to click yourmarks (perhaps for further detail inother sheets), label marks basedSelection or Highlighting may be ideal.If you are using filters, labels on Min/Max could be an effective option. Onstatic views, it can be best to set yourlabels to Always On.Guided Analytics (Actions)Highlighting - highlight related data based on selections in a particular view.Filtering - filter views based on selections in a particular view.Hyperlinks - link to external resources and webpages. 2010 Tableau Software, Incorporated.13
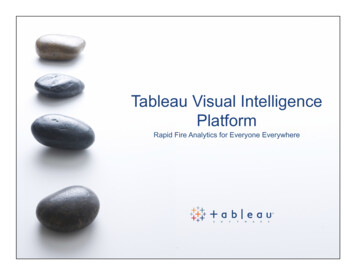
Even the simple visualization below benefits from colorlegend highlighting.60 Years of UnemploymentUnemployment by Decade and YearHighlight 0's2000's6%4%2%0%Month over Month12%J anuary 2009S eptember 1983Unemployment10%8%6%Average 5.6%4%2%Average 116K0%-1,000K-500K0K500K1,000KChange in Employment from Prior Month 2010 Tableau Software, Incorporated.14Source: Bureau ofLabor Statistics
Another thing to note if you take advantage of interactivity isthat the visualization should suggest interactivity. The Legendin this Unemployment viz is named “Highlight Decade”,which informs the viewer that they can interact with it.Whatever interactivity you have built into your viz, makesure the viewer knows they can interact with it andunderstands where to look for the changes their interactionwill bring about. The sub-headings of the views belowinstruct (“Select”) and inform (“to view details”). 2010 Tableau Software, Incorporated.15
Highlighting your best workHighlighting related data across multiple views lets youquickly compare values. Think about your reader: what arethey going to be interested in? What parts of your viz willthey want to click and highlight? Furthermore, would youadd analytical depth to your view by having somethinghighlighted initially (when you publish)?Legend highlightingThe easiest way to highlight is with legend highlighting.Simply click the icon in the top right of any color legend ona viz and you can highlight related data simply by clickingon it anywhere in the viz or legend.HighlightingUse the Highlight optionon the toolbar to select specificdata to highlight across views.Think about what’s most important to highlight. Often thesubject of your viz (Player, Year, etc), will highlight well.Quick Filters: give the wheel to your usersTableau allows you to do some amazing (yes, AMAZING)things with filters. However, filters can also be a very goodway of confusing your audience, so make sure to pay attentionto the following. Quick filters let your viewers dig in andengage with the data. They can use them to narrow thescope of the viz or identify changes and make comparisons.Here are some tips on using quick filters effectively.Global or local filtersQuick filters can apply to a single view in a dashboard (local)or all of the views at once (global). Use the card menu forthe quick filter to switch between global and local filters. 2010 Tableau Software, Incorporated.16
If you are filtering by country and every view has countryas one of its dimensions, then you should probably use aglobal filter. It would be confusing to see one portion of thedashboard filtered down to Australia and New Zealand, buthave everything else still showing the entire world.The great thing about Tableau is that you do not have to havea field in use to filter by it. In other words, I can have a barchart showing the GDP of twenty countries, and then I canadd a filter on Population so I can see only those countrieswith a population over 100M. These “slicing” filters arevery powerful.Not all filters have to be quick filters that are exposed to youraudience. For example, a common way to clean up extraneousdata is to exclude null values. That’s a filter that you probablydon’t want to show as a quick filter.Ordering of valuesMake sure the values in the quick filter are in an order thatmakes sense for the data. For example, instead of listing classesalphabetically, you probably should list them Freshman,Sophomore, Junior, Senior. You can specify the order of aquick filter by setting the default sort order for the field.All and single quick filtersShould users be able to select “All” in your filter? Or justgo to one value? Tableau lets you do both. Figure outwhich makes sense, and set filter settings accordingly.Initial StateWhen you are ready to publish, make sure you have checkedthe initial state of your view. Do your filters make sense? 2010 Tableau Software, Incorporated.17
Actions — Major League filteringActions are nuggets of interactive goodness you can set updirectly within your dashboard (as opposed to in a legendor Quick Filter). They allow you almost unlimited flexibilityin the interactivity of your visualization. Unfortunately, theyare also the most complex and easy to misuse. Actions canbe turned on in any view by clicking the drop down andselecting “Use as Filter” (below), or through the Actionsdialogue box (Edit- Actions).This very special interactivity should be used in thefollowing scenarios: When it would be more intuitive to find the thing thatyou want to filter to in a view rather than a quick filterlist (e.g., a map is better for filtering States than a list) When users will want to filter to values that group togetherin a view (e.g., regions of geographies, outliers, etc.) When you want to create a “details-on-demand” situation,where one view is used to filter a view below it thatcontains detailed information on the selection.- This is often very useful for large datasets that wouldoverwhelm one view- Instead of putting all of the detail in one view, slice thedataset in the first view (maps are often useful), thenhave detailed information and measures in the viewbelow that filters to your selection in the first. 2010 Tableau Software, Incorporated.18
We’ve already covered a few actions you can turn on withone click, including “Use as Filter,” legend highlighting andhighlighting from the menu bar. But there’s oh so muchmore you can do with custom actions.When defining a custom action, you need to specify thefollowing: Source Sheets – what view will you activate th
With the drag-and-drop flexibility of Tableau, anyone can get lost in a world of scatter plots and geocoding. It is vital that your visualization has a purpose. All of the maps, charts, and cross-tabs you create should work together to . fulfill that purpose. How do you know if your viz has a purpose? Well, ask it a question . to find out.