Transcription
ESPOO 2008VTTPB 100002044 VTTTel. 020 722 4520http://www.vtt.fiISBN 978-951-38-7106-2 (URL: http://www.vtt.fi/publications/index.jsp)ISSN 1455-0849 (URL: http://www.vtt.fi/publications/index.jsp)VTTP.O. Box 1000FI-02044 VTT, FinlandPhone internat. 358 20 722 4520http://www.vtt.fiDevelopment of strength grading of timber using combined measurement techniquesVTTPL 100002044 VTTPuh. 020 722 4520http://www.vtt.fiVTT PUBLICATIONS 686This publication documents the results of the second part of"Combigrade"-project. 1000 pieces of both spruce (Picea abies) logs andpine (Pinus sylvestris) logs were sampled and sawn timber produced.Non-destructive measurements of logs and sawn timber were made by 15organisations producing 20 different measured quantities for each testpiece. Finally, test material was loaded to failure in bending, and gradedetermining properties (modulus of elasticity, bending strength anddensity) were measured. Coefficients of determination were calculatedbetween non-destructively measured indicators and grade determiningproperties.VTT PUBLICATIONS 686Antti Hanhijärvi & Alpo Ranta-MaunusDevelopment of strength grading oftimber using combined measurementtechniquesReport of the Combigrade-project – phase 2
VTT PUBLICATIONS 686Development of strength gradingof timber using combinedmeasurement techniquesReport of the Combigrade-project – phase 2Antti Hanhijärvi & Alpo Ranta-Maunus
ISBN 978-951-38-7106-2 (URL: http://www.vtt.fi/publications/index.jsp)ISSN 1455-0849 (URL: http://www.vtt.fi/publications/index.jsp)Copyright VTT 2008JULKAISIJA – UTGIVARE – PUBLISHERVTT, Vuorimiehentie 3, PL 1000, 02044 VTTpuh. vaihde 020 722 111, faksi 020 722 4374VTT, Bergsmansvägen 3, PB 1000, 02044 VTTtel. växel 020 722 111, fax 020 722 4374VTT Technical Research Centre of Finland, Vuorimiehentie 3, P.O. Box 1000, FI-02044 VTT, Finlandphone internat. 358 20 722 111, fax 358 20 722 4374VTT, Kemistintie 3, PL 1000, 02044 VTTpuh. vaihde 020 722 111, faksi 020 722 7007VTT, Kemistvägen 3, PB 1000, 02044 VTTtel. växel 020 722 111, fax 020 722 7007VTT Technical Research Centre of Finland, Kemistintie 3, P.O. Box 1000, FI-02044 VTT, Finlandphone internat. 358 20 722 111, fax 358 20 722 7007Technical editing Maini Manninen
Hanhijärvi, Antti & Ranta-Maunus, Alpo. Development of strength grading of timber usingcombined measurement techniques. Report of the Combigrade-project – phase 2. Espoo 2008.VTT Publications 686. 55 p.Keywordsstrength grading, combined measurement techniques, sawn timber, bendingstrength, non destructive testing, X-ray scanning, frequency measurement,ultrasonic transit time, acoustic-ultrasonic measurement, destructive strength,stiffness, densityAbstractMore than 1000 pieces of spruce (Picea abies) logs and 1000 pieces of pine(Pinus sylvestris) logs were sampled mostly from Finland but also from NorthWestern Russia. Non-destructive measurements were first made on the logs andsawn timber of five different cross-section sizes were produced by sawing andkiln drying. Next, the sawn timber boards and planks went through several nondestructive measurements. NDT-measurements were made by 7 organisationsproducing some 50 different measured quantities of both logs and of each testpiece. Finally, after all the non-destructive measurements, the test material wasloaded to failure in bending, and grade determining properties (modulus ofelasticity, bending strength and density) were measured. Degrees of determinationwere calculated between the non-destructively measured indicators and gradedetermining properties.It could be concluded that the coefficients of determination – the r2 values –between strength and most non-destructive indicators were remarkably higherfor pine than for spruce. Especially, knot size and density are better gradingparameters for pine than for spruce. This does not, however, indicate that yieldto high grades would be in general better with pine than spruce, but it indicatesthat pine has larger variability of knot sizes and density, and consequently highervariability of strength. Log scanning can also produce strength indicators whichare on the same level as some existing grading methods.In parallel to this project another project that dealt primarily with grading ofspruce based on tension strength was carried out and some results of that projectare also reported.3
PrefaceThis research has been carried out as the second part of “Combigrade” project.The objective of the work has been to experimentally compare existing andpotential strength grading methods of sawn timber. The experimental work hasbeen done during 2006.The project was financed by Tekes – Finnish Funding Agency for Technologyand Innovation, Wood Focus Finland and VTT. In addition, collaboratingorganisations have made important parts of the work on their own expense,which is briefly summarized as follows:Logs were sampled with the help of Stora Enso Timber (Kitee Sawmill), UPMKymmene (Kaukas Sawmill, Kajaani Sawmill) and Metsäliitto Co-operative(Soinlahti Sawmill, Kyröskoski Sawmill, Merikarvia Sawmill).1. Bintec Oy made X-ray scanning of the logs.2. Fibregen Instruments Limited made natural frequency measurements of the logs.3. FinScan Oy made optical scanning of sawn boards.4. CBS-CBT/Triomatic made ultrasonic measurements of boards in a glulam factory.5. Microtec made X-ray and natural frequency measurements of boards in theirlaboratory.6. Raute Timgrader Users Group made Raute Timgrader measurements at Sepa Oyin Keitele.7. Brookhuis Micro Electronics / TNO Building and Construction Research madenatural frequency measurements at a sawmill.8. METLA (Finnish Foreset Research Institute) made the log selection and logmanual measurements and helped in sawing the logs. It also made manualknot and other measurements of the boards in co-operation with VTT.9. Beijing University of Forestry made the manual knot measurements and othermeasurements of the boards in co-operation with VTT and METLA.Contribution of these organisations is gratefully acknowledged.4
Project has been lead by a management team under the chairmanship of VesaPölhö (Stora Enso Timber). Other members of management team have beenJouko Silen (Stora Enso Timber), Ismo Heinonen (Vapo Timber), RistoLaaksonen and Jaakko Lehto (UPM-Kymmene), Aarni Metsä and MarkkuLehtonen (Wood Focus), Timo Pöljö (Finnforest), Jaakko Riihinen (Fin Scan),Juha Vaajoensuu (Tekes), Laura Apilo, Heikki Kukko, Alpo Ranta-Maunus andAntti Hanhijärvi as secretary (VTT).In parallel to Combigrade, a project that dealt with grading of spruce based ontension properties (“Combi-T”-project) was carried out co-operatively byHelsinki University of Technology (TKK) and VTT. The Combi-T-projectobtained its test material from the same sampling procedure as this project andits results are mainly reported in (Poussa et al. 2007), but partly (correlations toNDT-parameters) included in this report.Bending and tension strength values of Combigrade material are also separatelyand more comprehensively analysed and published as part of a summary reportof strength of Finnish grown timber (Ranta-Maunus 2007).5
ContentsAbstract. 3Preface . 4List of symbols. 81. Introduction. 91.1 Strength grading as part of the production process of sawn timber. 91.2 Purpose of strength grading. 91.3 Strength grading practices . 121.4 Motivation and purpose of this project. 131.5 Contents of the project. 141.6 Regression analysis as a source of prediction model. 142. Material. 162.1 Selection of test material (logs) . 162.2 Sawing and drying of test material . 203. Methods . 233.1 Basic method of study . 233.2 NDT-measurement techniques . 243.2.1 X-ray scanning of logs . 253.2.2 Frequency measurement of logs. 253.2.3 Ultrasonic transit time of logs . 253.2.4 Visual scan of board sides. 263.2.5 Natural frequency measurement of boards (2) . 263.2.6 X-ray scanning of boards . 263.2.7 Acoustic-ultrasonic measurement of boards . 273.2.8 Density measurement by scale . 273.2.9 Flatwise bending stiffness (Raute Timgrader) . 273.2.10 Manual knot measurements. 273.3 Destructive tests. 284. Results and analysis. 294.1 Destructive strength, stiffness and density test results and theircorrelations . 296
4.24.3Correlations between strength, stiffness and density. 31Correlations between destructive results and individual NDT-results.345. Discussion and conclusions . 435.1 Sampling. 435.2 Correlations of single parameters . 435.2.1 Destructively determined parameters. 435.2.2 Stiffness parameters (boards) . 445.2.3 Density parameters (boards) . 455.2.4 Knot parameters (boards) . 455.2.5 Combination of stiffness and density parameter (boards). 465.2.6 X-ray parameters together (boards). 465.2.7 Log measurements . 465.3 Conclusion about correlations . 476. Summary. 496.1 General . 496.2 Evaluation of different methods . 50Acknowledgements. 52References. 537
List of symbolsC.o.V.Coefficient of variationEdynDynamic modulus of elasticity dynamic MOEEdyn(Freq.)Dynamic modulus of elasticity calculated based on naturalfrequency measurement and default densityEdyn(Freq.&Dens.)Dynamic modulus of elasticity calculated based on naturalfrequency measurement and density measurementEdyn(US)Dynamic modulus of elasticity calculated based on velocityof ultrasoundEstatStatic modulus of elasticity in NDT-measurementI.P.Indicating propertyTKARTotal Knot Area RatioMOEModulus of elasticityMORModulus of rupture Longitudinal bending strengthNDTNon-destructive testingrCorrelation coefficient in linear regression analysisr2Coefficient of determination in linear regression analysisU.S.Ultrasonic, UltrasoundVCoefficient of variation of measurement error8
1. Introduction1.1 Strength grading as part of the production processof sawn timberGrading is an inseparable and important step in the modern production processof sawn timber. Through grading added value can be obtained for the timberproducts. Grading can be seen as the step in the production, in which theproperties and the quality of the product are set, and these of course areimportant factors in determining its value on the market.According to the purpose, grading of sawn timber can be categorized to either(1) appearance or (2) strength grading. Appearance grading is made to classifytimber according to its aesthetic properties, so that aesthetically different piecescan be used in a place where they give most value. Strength grading – on theother hand – produces classified timber according to its mechanical properties,first and foremost strength.Appearance grading has been – as measured by production volume – clearlymore important than strength grading. This is natural, because most timber endsup either in a use where the outlook is important and mechanical strength haspractically no relevance – or even if the strength is important, other factorsdetermine the size to be so large that even a low strength is sufficient. Thissituation has caused the consequence that development of strength grading hasnot been very intensive in the past.1.2 Purpose of strength gradingAs opposite to appearance grading, strength grading has implications to the useof timber as load bearing structures in building construction. Therefore it alsohas implications to structural safety and it is regulated by the authorities. Thepurpose is to ensure that a particular piece of timber to be placed as a particularstructural member in a building will have the capacity to carry (including safetymargins) the load that is can be assumed to experience during the use (designload). To achieve a link between the properties of timber and the strength value9
that the designer can use in calculations, systems of strength classes have beenadopted. In Europe, the requirements ( minimum properties) of twelve strengthclasses of sawn softwood timber have been defined, they are denoted as: C14,C16, C18, C20, C22, C24, C27, C30, C35, C40, C45 and C50, where thecharacter “C” refers to coniferous species and the number after it refers to thecharacteristic value of bending strength (in MPa) of timber pieces graded to thatparticular class (Table 1, see also ref. Glos 1995). The characteristic value(denoted with subscript k) means that 5% of the pieces graded in the class mayhave a lower strength value than indicated by the strength class characteristicvalue and at least 95% exceed it. To ensure that even the few pieces withstrength below the characteristic value will not fail during service, an additionalmaterial safety factor is used, which is often 1.3 for structural timber, anothersafety factor is used to account for the uncertainty of loads. In addition to therequirement for the (1) bending strength, the European system of strengthclasses (EN 338, CEN 2003a) sets requirements for two other properties: (2)density (characteristic value) and (3) bending stiffness (mean value of modulusof elasticity [MOE]). The three properties of timber can be named as the gradedetermining properties. All other properties given in Table 1 are assumed tofollow, if the three grade determining properties are shown to be satisfied by thegraded timber.10
Table 1. Strength classes and characteristic values according to EN338, coniferous 370450380460400480420500440520460550in MPaBendingTension parallelTension perpCompressionCompr. 192,32,222130,5202,42,4in GPa11Mean MOE5% MOEMean MOE perpMean shear ,596,00,300,569,56,40,320,59106,70,330,63in kg/m3DensityMean : The tabulated properties are compatible with timber at a moisture content consistent with the temperature of 200C and relativehumidity of 65%. Bending and tension parallel to grain strengths are given for timber width 150 mm, tension strength perpendicular tograin for reference volume 0,01 m3.
1.3 Strength grading practicesTo correctly determine the strength of a particular piece of timber, one has tobreak it, so it is no more useable as a load carrying component – true strengthcan only be determined in a destructive test. For strength grading purposes, itwould actually not be necessary to test load the pieces to failure but only to therequired value. Such a loading would knock off too weak pieces with 100%certainty, and such a method has been used in special cases.In practice, almost all strength grading is based on indirect methods, wheremeasurements or observations of other properties of timber pieces are used topredict the strength. The measurements are made by some suitable nondestructive testing (NDT) methods. Inevitably, indirect methods of predictingstrength of individual pieces include uncertainty, since the capability of themethod can never be perfect but contains measurement errors. The uncertaintyhas been dealt with in the strength grading system by setting requirements to thestatistical distribution of the grade determining properties of timber pieces thatfall into a certain strength class (EN 14081). The requirements for the statisticaldistribution of properties include minimum values for the characteristic value(bending strength, density) and mean value (bending MOE). Simply said, thewhole development of strength grading system by the European system requiresthe demonstration that the required statistical properties can be met withsufficient confidence level by the method to be adopted.The properties that are obtained by NDT-methods and used as predictors ofgrade determining properties are called grade indicating properties (I.P.’s). Theeffectiveness of a system depends on the prediction capability of the gradeindicating properties and the accuracy by which they can be measured. Thus, theproblem with stress grading focuses on these two key questions: (1) how topredict the strength of timber pieces by measuring other properties with the bestpossible reliability and (2) how to measure the predictor parameters with the bestpossible accuracy.The challenges that are encountered in prediction of the strength of timber due tothe variability of timber and the current state-of-the-art were extensively coveredin the report of Phase 1 of this project (Hanhijärvi et al. 2005) and these will notbe repeated here.12
1.4 Motivation and purpose of this projectThe Combigrade-project originated from the anticipation that the importance ofstrength grading of sawn timber will increase in the future. In Europe, thegradual application of the CE-marking of sawn timber for structural purposesrequires that an increasing amount of timber will go through strength grading.On the other hand, much of the potential of Nordic timber is nowadays unused inwhat comes to strength. A large portion of the timber reaches much higherstrength level than its present design strength value. With more accurate strengthgrading systems, this potential could be exploited.The first goal of this project has been to examine different NDT-measurementsand their combinations to find out which methods and which combinations ofmethods are the most effective in predicting strength and the other gradedetermining properties. When speaking of the “most effective” methods in thiscontext, one should consider it from the economic point of view – not fromstrictly scientifically determined prediction accuracy. The economic effectivenessof a method is tied to the production: which method can give the best financialoutcome for the company that uses it. And, that may be very different fordifferent situations depending on the company and its operational environment,e.g. the product assortment, production volumes, raw material supply, markets,and so on – and of course the investment costs of the strength grading systemitself.The second goal has been to produce measurement data for the actual developmentof new machine strength grading methods to be adopted in practise. The developmentof strength grading machines is expensive, and one of the most expensive tasksis the destructive testing of sufficiently high number of pieces in order todetermine settings for the method and to show that the statistical requirementsthe distribution of grade determining properties are met by the method. EN14081 requires the testing of at least 900 specimens for the acceptance of a newstrength grading machine by the so called machine control method.To facilitate the development of new strength grading methods and machinesand their adoption in the real life, the philosophy adopted in the Combigradeproject was that, if the same (expensive) destructive data can be used for thedevelopment of several method by many users, it will be less expensive per13
machine and then make easier the development of new machines. Following thisidea, the project work was arranged so that grading machine producers wereinvited to participate in the project as partners and make their own NDTmeasurements at their own cost and hand the results over for the project to use inscientific work. On return, the partners could receive the destructive resultsproduced by the project for use in their own product development work.In parallel to Combigrade, a project called “Combi-T” (T standing for tension)was carried out co-operatively by Helsinki University of Technology (TKK) andVTT to study the strength grading of timber based on tension properties (tensionstrength and tension MOE). The Combi-T-project obtained its test material fromthe same sampling procedure as this project and its results are mainly reported in(Poussa et al. 2007), but some results – in particular, correlations to NDTparameters – included in this report.1.5 Contents of the projectThe project was carried out in two phases:Phase 1 was a feasibility study, in which a small sample was used – appr.100 spruce specimens and appr. 100 pine specimens. Phase 1 and its resultshave been reported in (Hanhijärvi et al. 2005).Phase 2 was a large study with a very large sample size – more than 1000spruce specimens and more than 1000 pine specimens. Phase 2 is thesubject matter of this report.1.6 Regression analysis as a source of prediction modelThe strength of timber can be predicted by the measurement or quantification ofproperties that have a clear effect on strength, or, on those measurable propertiesthat do not directly affect strength but are good indicators of it. For example,knots are known to be one of the key factors that define strength. Stiffness(modulus of elasticity, MOE), on the other hand, is not a direct factor to definestrength, but because it is dependent on the same factors that define strength, is a14
good indicator of strength. Both types of properties can be considered aspredictors of strength. In strength grading of structural timber the greatestemphasis should naturally be put on those non-destructively measurableparameters (predictors) that have the greatest ability to predict strength.The basis of strength grading with non-destructive measurements is the existenceof a relation between the strength and one or more predictor parameters. Therelation must be described mathematically. The exact (deterministic) relationcannot be formulated due to its complexity, but it can be established fromempirical observations (results of experiments) using mathematical statisticalmethods, usually regression analysis. It should be noted that statistical methodsare not the only possible way to develop a strength grading system: basically anymethod that can be shown to produce a sample whose characteristic value isabove the required value is sufficient.In the analyses of this work, different NDT-methods are evaluated by regression,and, in all cases only simple linear regression analysis is adopted. The regressionanalysis yields among other results the so called ‘coefficient of correlation’, r.Its square is called ‘coefficient of determination’, r2. The value of r2 indicates theportion of the total variation of the predicted variable which is explained by thepredictor. E.g., if r2 1, the predictor can explain the variation perfectly, if r2 0.5it can explain half of it, if r2 0, it cannot explain anything about the variation.In this work, the coefficient of determination is used solely as a measure of theability of a method to predict the grade determining properties.It is not possible to go into details about the regression analysis procedure itself,but it should be noted that there are two important things that should be takeninto account when using it:– If the variation of the predictor properties (indicating parameters) in theexperimental data is small, it is meaningless to carry out a regression analysis.– The result of a regression analysis should not be used for prediction withvalues of the indicating parameter that are outside the variation range of it inthe experimental data set, on which the regression analysis was based. Inother words, one has to be very careful with extrapolation.15
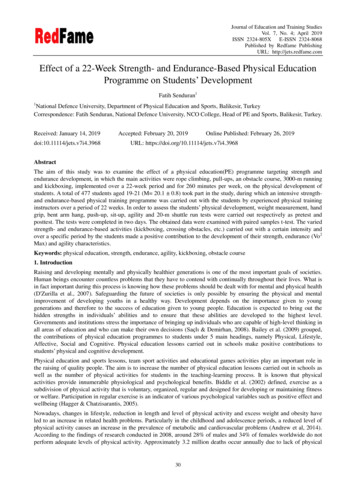
2. Material2.1 Selection of test material (logs)Five different sampling regions were chosen – three in Finland and two inNorth-Western Russia. The three areas in Finland were: Western Finland,Eastern Finland and Kainuu. The two in Russia were East Karelia and Vologdafor spruce and Novgorod and Vologda for pine. All logs were gathered duringwinter 2005–2006 from six sawmills in Finland – also including the logs fromthe Russian sampling areas. The Russian logs were chosen from railway carloads or truck loads, whose origin was known with the accuracy of the province(“oblast”), which was enough for the purposes of this study. However, samplingin “East Karelia” does not correspond to an administrative area but rather to anarea around Lake Ladoga. The sawmills and sampling areas are listed in Table 2and also illustrated in Figure 1 and Figure 2. The logs were taken from the logsupply of the sawmills so that not more than 5 logs were allowed from the sametruck or the same railway car. In fact, the majority of the logs were gathered sothat with high probability just one log was obtained from the same growthlocation (logging area). Logs were taken completely randomly: no qualityassessment of logs was done at selection.The sizes of the logs were chosen so that they corresponded to the normalsawing practise in the Nordic countries, which means that the log sizes used inthis study for production of different sized sawn timber cross-sections were thesame as are used in normal production of the same sizes. The log dimensionswere measured by METLA and the average, minimum and maximum topdiameter dimensions of logs in each area are given in Table 4 and Table 5. Thenumber of selected logs per each dimension and per sampling area was 44,which was chosen so that a 10% surplus was taken compared to the targetedsample size 1000. Table 3 shows the log sizes and selected number of logs. Thesurplus was intended as a buffer against losses in transportation, etc.16
Figure 1. Sampling areas in Finland. (Also KE and ME overlap.)17
Figure 2. Sampling areas in Russia. Note that “East Karelia” shown here doesnot correspond to any administrative area.Table 2. Sampling areas of logs. (*) Logs from coastal areas were not included.“East Karelia” does not correspond to any administrative area.SPRUCE (Label K)Log labelsRegionSawmillDistrictsKLWestern FinlandKyröskoski SawmillTampere, Seinäjoki, Rauma(*KEEastern FinlandKitee SawmillKiteeKPKainuuSoinlahti SawmillKajaaniKK“East Karelia”Kitee SawmillKVVologdaKitee SawmillPINE (Label M)Log labelsAreaSawmillDistrictsMLWestern FinlandMerikarvia SawmillTampere, Seinäjoki, Rauma(*MEEastern FinlandKaukas SawmillLappeenranta, MikkeliMPKainuuKajaani SawmillKajaaniMNNovgorodKaukas SawmillMVVologdaKaukas Sawmill18
Table 3. Log numbering system and sawing pattern.LOGSERIESSawn dimensionLognumbersTarget number of logsper area per speciesSawingpattern0-series38 mm x 100 mm1–44442 ex log100-series50 mm x 100 mm101–144442 ex log200-series50 mm x 150 mm201–244442 ex log400-series44 mm x 200 mm401–444444 ex log300-series63 mm x 200 mm301–344442 ex logTable 4. Measured top diameters in (mm) of collected spruce 00 seriesKEKKKLKPKV300 seriesKEKKKLKPKV400 5
Table 5. Measured top diameters in (mm) of collected pine 99225209222227227240288275290295288292
combined measurement techniques. Report of the Combigrade-project Πphase 2. Espoo 2008. VTT Publications 686. 55 p. Keywords strength grading, combined measurement techniques, sawn timber, bending strength, non destructive testing, X-ray scanning, frequency measurement, ultrasonic trans