Transcription
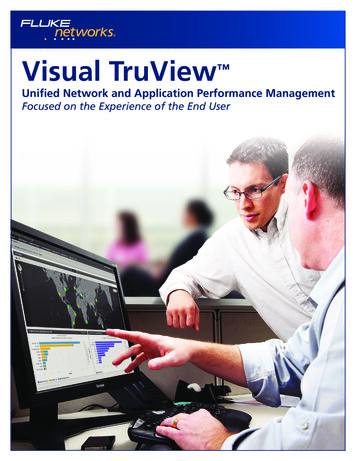
Visual TruView Unified Network and Application Performance ManagementFocused on the Experience of the End User
BUSINESS CHALLENGEProblems can occur anywhere from the physical layer towireless, across the WAN, through the core and into thedata center. The application delivery infrastructure is ahighly interdependent eco-system and with no visibilityinto how this entire system is performing as a single entity,resulting in organizations being faced with high costs inDowntime Costs* Frustration High**Average cost of data centerdowntime per minute: 5,600Average reported downtime:90minutesnetwork downtime, lost revenues and poor performance interms of fast problem identification.IT support teams are typically siloed using their tool ofAverage reported cost per incident: 505,000Percent without tools they need forquick, accurate problem resolution:55%Percent who say non-collaborativeresults and finger pointingslow troubleshooting:70%choice but this presents a challenge in that these disparate toolsets provide no correlated view into performanceissues that may be present within any component acrossthe application delivery infrastructure. Without the abilityto understand how one component may be affect anotherat a specific point in time it becomes difficult if not impossible to quickly understand how well the infrastructure istransporting applications, how well those applications areperforming, and where the problem truly lies.*Ponemon Institute. 2011,**Fluke Networks Market Research
Visual TruView Unified Network and Application Performance ManagementFocused on the experience of the end user. Simple workflows allowyou to quickly andeasily understand problemdomain and pinpointroot causeManagement. TruView embeds theAutomated applicationdiscovery speeds setupand ongoing managementa time correlated single dashboardINTELLIGENT Self-learning baselineshelp you understandwhat’s normal even atremote sitesSee how well yournetwork, applications anddevices are performingthrough time correlatedviewsCOMPLETE Single appliance embedsand correlates all elementsof the most importantdata sources such aspacket, flow, SNMP andAPI dataMonitor and troubleshooting everything from VoIPto Citrix to NTier transactions all through a singlepane of glassand SNMP and presents analytics inMonitorinVoIP Performancepacket, transaction, NetFlow/IPFIX,VoIP Qualityof ExperienceResponseTimeRetrospectivePacket Analysisview. These correlated views willhelp you to quickly see how well theg– Racked to Reporting inunder 30 minutes.most important data sources such asginfrastructure is transporting applications and how well those applications areDevicePerformanceMonitoringNetwork TrafficAnalysiserwork P formanceMNetonitorin Application-aware Network PerformanceApplicationPerformancgrinitoonMTruView is a unified solution foreFASTperforming in context of the end user’sexperience. And, TruView’s integrated 10 Gbps full line rate stream-to-diskpacket capture ensures you’ll never miss an important event again, as verifiedby the Tolly Group independent performance test.TruView can be deployed as an individual appliance or as part of a distributedconfiguration for larger environments. TruView appliances offer a new level offunctional flexibility, allowing them to be deployed in optimized configurationsfor packet monitoring, flow collection, or both.TruView Recognized by Leading Analyst FirmsRanked as a leader in Gartner’s NPMD Magic Quadrant and Best Hybrid ANPMSolution in Enterprise Management Associate’s Radar Report, Visual TruViewis leading the way in a new, emerging method of monitoring, troubleshooting,and analyzing both network and application systems commonly referred to asApplication Aware Network Performance Management (AANPM). AANPM takesdata from both APM and NPM to create cross-platform visibility that enablesall branches of IT to ensure high performance delivery of critical businessapplications.Fluke Networks nameda leader in the GartnerNPMD Magic Quadrant
USER FAVORITESAUTOMATED NETWORKDISCOVERY & PATH ANALYSISTruView users gain the ability to track the path betweenend user and server as well as the health of devicesalong that path. When TruView identifies a networkresponse time issue, path analysis is leveraged toidentify the Layer 2 and Layer 3 path taken by endusers, with visibility into the utilization, errors anddiscards along that path.END USER EXPERIENCETruView tracks the performance of individual users.It’s as simple as typing in their username, be it ActiveDirectory, DNS, NetBIOS name IP Address or VoIPendpoint or phone numer, and TruView will provideusage, performance and event information focused onthat single user as compared to others at the same site.CAPACITY PLANNINGWAN utilization and traffic profiling has never beeneasier than with TruView’s automated Capacity Planningreporting engine. Just filter on the network interfacesof interest and TruView provides you with easy to understand views of how long, or not, any given interface hasbeen over or under-utilized. The utilization informationis based upon 60 second granularity across an entireyear assuring you of an accurate depiction of networkutilization, leading to more informed infrastructureinvestments.
ADVANCED TRANSACTIONANALYSISBuilt-in application transaction analyzers provides outof the box support for Web, Citrix, SQL, Oracle, CIFS,XML and more with no additional modules to buy.TruView provides the most granular view of performanceallowing you to visualize every transaction and theirN-Tier dependencies to help you understand what tier isaffecting application performance.UNIFIED COMMUNICATIONSGain one of a kind visibility into VoIP quality ofexperience with an easy to understand graphicaldepiction of the call, with drill down to understandthe underlying degradation factors. TruView quicklyidentifies degradation factors such as Jitter, packetloss, latency, etc.SINGLE UIWhether you leverage TruView as a single appliance thatembeds five tools in one or deploy as a highly scalabledistributed system, time correlated analytics across datasources displays in a standardized UI. Highly customizable dashboard views provide self-guided workflows patterned after a logical troubleshooting process makingproblem domain isolation and root cause identificationpossible in just 3 clicks!
DELIVERING BUSINESS VALUECost Savings 100% investment protection with flexible platform thatcan change function as your needs change Tools consolidation through single appliance that embedsfive tools in one saves on initial investment and multiplemaintenance contracts Web services API with easy access event and performanceinformation sharing with any 3rd party event managementsystem such as IBM Tivoli, HP NNMi, ServiceNow, and othersImproved Staff Efficiency In-depth reporting provides performance metrics applicableacross IT and business functions building a common view toalign teams and reduce finger pointing Multi-tenant architecture and role based access providesusers with just the data needed to understand if theproblem is network or application related and logicalworkflows that drive to resolution 3-click workflows support logical troubleshooting processesenabling all IT functions including front line support thepower to identify problem domain and route an issuecorrectly or simple solve itMitigate Risk and Ensure the Performanceof Business Critical Applications Self-learning baselines and event alarms help manageSLAs for end user experience Quickly identify problem domain to application, networkor server with a single click Automatic discovery and path analysis pinpoints the device,interface, transaction, or packets associated with anyperformance event
SPECIFICATIONSSingle ew-4800TruView-5200TruView-6200Input2 X 1 Gbps4 X 1 Gbps4 X 1 Gbps2 X 10 Gbps2 X 10 GbpsStorage2 TB4 TB8-296 TB8-296 TB24-216 TBDistributed System ComponentsTruView Flow 0KFlows perSecond50,000100,000300,000Storage4 TB8 TB12 TBTruView Packet 800TruView-P5200TruView-P6200Input2 X 1 Gbps4 X 1 Gbps4 X 1 Gbps2 X 10 Gbps2 X 10 GbpsStorage2 TB4 TB8-296 TB8-296 TB24-216 TBTruView CentralSpecsTruView Central - ProTruView Central - EnterpriseMemory16 GB64 GBStorage4 TB26 TB
GOLD SUPPORTThe Gold membership program is Fluke Networks’ premium support andmaintenance service. Fluke Networks’ Gold Membership helps you fullyleverage your investment in Fluke Networks products and keep it currentwith regular software upgrades and comprehensive technical assistance.With support centers and service centers located across the worldand with access to the MyAccount online portal, customers with Goldmembership get 24x7 availability to answers and easy access to alerts,patches and product upgrades to help you get the most out of yourFluke Networks products that are deployed. Other key benefits of Goldmembership include:About Fluke NetworksFluke Networks is the world-leading provider of network test andmonitoring solutions to speed thedeployment and improve the perfor-Around-the-clock access to award-winning technical support fromhighly trained Fluke Networks support engineersmance of networks and applications.Next business day on-site repair or parts replacement for appliancefailuresviders trust Fluke Networks’ products Expedited NIC replacement shipment in case of NIC failurestoughest issues and emerging chal- Access to software and firmware updates for covered products PRO SERVICESFluke Networks Professional Services offer end-to-end consultingservices for IT professionals responsible for delivering critical businessservices. These services help to enable a faster deployment, management and optimization of the end-to-end user experience ofenterprise-wide applications, WLAN, WAN or LAN networks andVoIP performance.Leading enterprises and service proand expertise to help solve today’slenges in WLAN security, mobility,unified communications and datacenters. Based in Everett, Wash.,the company distributes productsin more than 50 countries.Fluke Networks is part of Danaher,a Fortune 200, NYSE-listed (DHR),science and technology leader thatdesigns, manufactures and marketsOur service offerings are based on in-depth product expertise, provenbest practices, and repeatable delivery methodologies to help customersrealize the full value of our products faster, and with less risk.innovative products and services toBased on best practices from working with thousands of customers andusing reliable, repeatable methodologies, our services are designed tohelp you: assess your current environments, plan and design solutionsthat meet your desired business objectives and build and implementsolutions that are easy to manage.for the full year 2013 were 2.7professional, medical, industrial andcommercial customers. Net earningbillion.Fluke Networks operates in more than50 countries worldwide.Tolly ReportTo find your local office contact details,go to www.flukenetworks.com/contact.Gartner ResourcesEnterprise Management Associates Resources 2014 Fluke Corporation. All rights reserved.Printed in U.S.A. 1/2015 6002359BFor more information visit: www.flukenetworks.com/TruView
Ranked as a leader in Gartner’s NPMD Magic Quadrant and Best Hybrid ANPM Solution in Enterprise Management Associate’s Radar Report, Visual TruView is leading the way in a new, emerging method of monitoring, troubleshooting, and analyzing both network and







![[digital] Visual Effects and Compositing](/img/1/9780321984388.jpg)
