Transcription
Weatherization And Intergovernmental Programs OfficeBenchmarking Energy Data AnalysisSeptember 27, 20161Crystal McDonaldShankar Earni
Technical Assistance to State and Local ncenteror Email Us:2stateandlocal@ee.doe.gov
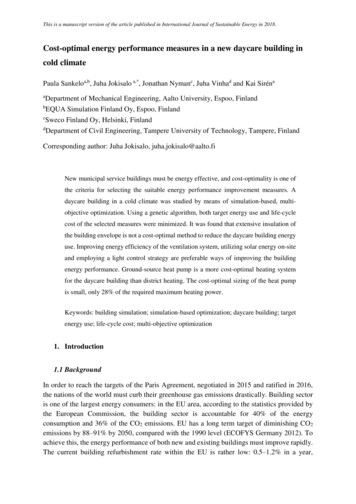
State and Local Resources for a Clean Energy FutureWhat you will find: Targeted opportunities for impact inyour jurisdiction Key resources from each of the fouraction areas Information on initiatives andresources in renewable power,sustainable transportation, andenergy-saving homes, buildings, andmanufacturing from across EERE3
Outline Benchmarking - Introduction, Benefits and Process Data Analysis - Motivation Benchmarking Data Analysis– Building Portfolio Analysis GSF Analysis Building Type Distribution– Building Portfolio Energy Analysis Energy Star Energy Use Intensity– Building Level Analysis Monthly Data High Frequency Data 4Summary
Course ObjectivesIntended AudienceCities, communities, and states that have implemented or areconsidering implementing an internal or community-widebenchmarking and/or disclosure program or policy and arepreparing their building energy data for analysis.Learning Objectives:Training modules are intended to help public sectororganizations: Analyze benchmarking data to identify facilities that areunderperforming Help create a targeted approach to improve their energyperformance5
Introduction to Benchmarking Benchmarking compares the measured performance of afacility to itself, its peers, or established norms Benchmarking provides an empirical foundation for anorganization's energy management strategy Benchmarking helps manage buildings effectively. You can'tmanage what you don't measure Benchmarking facilitates energy accounting. It assists inidentifying opportunities for improvement. It can also helpquantify/verify energy savings.6
Benefits of Benchmarking 7Manage energy use proactivelyAssess and compare building’s energy performanceIdentify billing errors and other anomaliesVerify pre- and post-project energy use, greenhouse gasemissions, and energy costsAssess effectiveness of current operations, policies, andpracticesAssist in planning: set goals, targets, and timelinesCommunicate results in meaningful termsParticipate in energy challenges or benchmarking programs
Building Benchmarking Process1. Developing aBenchmarking Plan2. Benchmarking ToolsGetting StartedData Collection, Tracking3. Outreach4. Data Collection5. QualityAssurance/ControlData Cleansing & Analysis6. Analyzing &Interpreting Results7. CommunicatingResultsSource: nchmarking8
Benchmarking DataENERGY STAR Portfolio Manager Data FieldsCollectsReportsProperty Information Primary function Location VintageAbsolute Performance Total energy (kBtu) Site and source EUI (kBtu/ft2/year) Total GHG emissions(MtCO2e/year)Property Type Data Gross floor area Property use details (e.g., numberof computers, number ofoccupants, operating hours)Energy Consumption Data Energy data for all fuel usage9Comparative Performance National median site and sourceEUI % difference from national mediansource EUI ENERGY STAR score
Data Cleansing Summary Data sets are dirty until scrubbed clean– Accurate data will strengthen confidence in final results Promote the use of standardized data dictionary to reduce theeffort related to mapping Identify missing or suspicious values– If individual data fields seem suspect it may not be necessary to throwout the whole building record– Very similar energy uses for different building types in differentlocations can be an indication of default values Use typical ranges to identify data anomalies– Data cleansing may require learning about building performancecharacteristics to make judgments on reasonable values– Identify maximum and minimum gross floor areas for each of thebuilding types from various other sources– Ranges of EUI can be obtained from public sources (CBECS, BPD)10
Data Analysis-Drivers What type of buildings consume a big portion of the energy? What specific buildings have a higher energy use intensitycompared to their peers? How many of my buildings are improving their energyperformance year over year? How do I identify buildings that have performance issues thatneed attention? How do I identify energy conservation measures for lowperforming buildings? What data is needed to help with thisprocess?11
Data Analysis ProcessBuildingPortfolioAnalysis Building TypeDistribution Gross SquareFootage12BuildingPortfolioEnergy Analysis Energy StarScore Energy UseIntensityBuilding LevelAnalysis Monthly Data High FrequencyData
Data Analysis on Sample Datasets Data fields: Cleansed dataset includesbenchmarking data for 2,100– Facility IDbuildings over 4 years– City Dataset obtained fromFEMP’s Compliance TrackingSystem (CTS)Additional sample dataset used: City of Philadelphia data set13–––––––––Zip codeBuilding typeActivity yearBenchmarked floor areaAnnual building energy useSite EUI & source EUIWeather normalized site EUIWeather normalized source EUIENERGY STAR rating
Number of Buildings by TypeWhy? Understand distribution of buildingtypes Same types of buildings might havesimilar systems and might needsimilar energy conservation measuresResults Highlights Total buildings 1539 with 625 (42%)classified as “Other” (do not qualifyfor Energy Star Score) Building portfolio dominated byoffice buildings Hospitals, warehouses, andcourthouses are additional largecategories by building number14Building PortfolioAnalysisTotal number of buildings 1539Total number of buildings - others 914
Floor Area by Building TypeWhy? Understand distribution of floorareas among building types Develop targeted approach toaddress underperforming buildingsby sizes, e.g., buildings less thancertain size might qualify for certainprograms.Building PortfolioAnalysisTotal Floor Area 500 Million Square feetResults Highlights Total floor area 500 mil sq ft Building area is dominated by office buildings, followed by hospitals, and courthouses,Non-refrigerated warehouses “Other” floor area 96 mil sq ftInsights “Other” represents 42% of buildings by number but occupies less than 15% of the area,making this a smaller opportunity than analysis by number indicates alone; While hospitals represent 7% of buildings by number, they account for nearly 17% of thearea, increasing their importance relative to the overall portfolio15
Number of buildings & Energy Consumption by SizeWhy? Pareto principle (80-20 rule)Larger buildings ( 250K GSF) tend to have very differentmechanical system types (e.g., a centralized heat orchiller plant) than smaller buildings (e.g., packagedrooftop or window units)Large buildings typically have a greater impact potentialon energy consumption than small buildings, on a perbuilding basisResults Highlights More than 3/4 of the buildings are small ( 250K GSF)Large buildings ( 250K GSF) make up 26% of allbuildings but consume a more significant portion of theenergy ( 83%)Insights 16Design a tailored strategy to address the differentbuilding sizes to improve their performance. Forexample large buildings might be good candidates forESPC projects.NumberBuilding PortfolioAnalysisEnergy
Small and Large Building Types by NumberWhy?Large Buildings (796) Identify buildings that can take of advantage ofspecific programs geared towards a specific buildingtype (e.g., Data Center Challenge) Larger buildings typically have a greater impactpotential on energy consumption Identifying types of large buildings will help us designa targeted approach to improve their performanceResults Large buildings ( 250k SF) are dominated by offices,hospitals, courthouses, “Other” and non refrigeratedwarehousesSmall Buildings (2306) Small buildings are dominated by “Other” andoffices, followed by non refrigerated warehouses,residence halls and K-12 schools.Insights Offices represent a significant fraction of largebuildings, therefore can provide an attractiveopportunity for improvement Small buildings represent a more diverse populationbecause of the larger “other” component.17Building PortfolioAnalysis
Distribution of Building Sizes by TypeWhy? Helps to identify the distribution of buildingsizes individually by type Separating the buildings by their type and areawill help develop targeted approaches toaddress performance issues For example offices below a certain size mightbe eligible for some special utility programsResults Office buildings occur in all sizes K-12 schools, dormitories, retail and servicebuildings are smaller than 250K SF Courthouses and hospitals are typically largerthan 250K SFInsights Addressing inefficient courthouses, hospitalsand office buildings might be a good strategyto get the most savings with less resources.18Building PortfolioAnalysis
Total Energy Use by Building TypeWhy? Understand distribution of energy usage bybuilding types Help focus on buildings types thatconsume the most energy Certain buildings are more energy intensivethan others – hospitals, data centers, etc.Results Total energy use is dominated by hospitalsand office buildings. Courthousesrepresent a smaller opportunity, using lessthan 6% of total energyInsights Even though office buildings are greater innumber and occupy more area, hospitalsconsume more energy19Site Energy UseBuilding PortfolioEnergy Analysis
Energy Star Score AnalysisWhy Understand distribution of energy starscores (ESS) for the full building portfolioLow performing buildings (ESS 50) shouldbe targeted for improvement and willgenerally have the best rate of return oninvestmentResults There are 224 buildings with an ESS of 50or less whose performance needs to beimprovedThere are about 282 buildings with an ESSof 75 or betterInsights 20Low performance buildings (ESS 50) needto be analyzed in more detail tounderstand and design a more targetedapproach to improve their performanceSource: EPABuilding PortfolioEnergy Analysis
ESS Analysis by Building TypesBuilding PortfolioEnergy AnalysisWhy Understand distribution of energy starscores by building typeIdentify low performing buildings andtheir types (ESS 50)Results There are 166 office and 32 hospitalbuildings with energy star scores of 50or lessInsights 21There is a wide distribution of scores foroffices, hospitals and non-refrigeratedwarehouses, whereas most schools arehigh performersCourthouses, which occupy 10% of thetotal area and 5% of the energyconsumptions and costs are performingwell relative to other building typesEnergy Star Score
Distribution of ESS by Building TypesInsights The median ESS for eachbuilding type is above 50,however some buildingtypes have very widedistributions, with manybuildings scoring below 50.This is particularly the casefor hospitals and offices Courthouses and schoolsare relatively highperforming buildings with ahigh median ESS and verytight spread among thebuildings Identify and focus onunderperforming office andhospital buildings withESS 50 for biggest impact22Building PortfolioEnergy Analysis
Energy Star Score by Building SizeResults The median energy starscores for all buildings 200KSF is around 50 with lot ofvariation The median ESS for allbuildings 200K SF is greaterthan 70. Buildings 800K SF are highperforming buildings with ahigh median ESS and verytight spread among thebuildingsInsights Identify and focus onunderperforming buildingswith GSF 600K SF withESS 50 for highest impactGSF (in 1000s Sq. Ft)23BuildingPortfolioPortfolioEnergy AnalysisAnalysis
Energy Use Intensity (EUI) AnalysisWhat? A good number of buildings in the datado not have an ESS – either thebuildings are not eligible or some of therequired key variables are not enteredin Portfolio Manager Understand distribution of Site EUI forbuilding stock with no ESS Helps identify low performing buildings– Compute the mean and standarddeviation for Site EUI for entirepopulation of buildingsOutliers– Site EUI Mean 3 Standard DeviationInsights There are 68 buildings that have a SiteEUI 375 whose performance needs tobe investigated24Building PortfolioEnergy AnalysisEUI 375
Distribution of Site EUI by AreaBuilding PortfolioEnergy AnalysisWhy? For buildings that do not have an ESS, Site EUI can help us understand the building’sabsolute energy performance and conduct comparisons Understand the relationship between Site EUI and building areaInsights A significant number of underperforming buildings are small that are less than 200KGSF However, addressing low performing large buildings may result in more per capitaenergy savingsEUI 37525In 1000s S. Ft
Building PortfolioEnergy AnalysisBuilding Type Site EUI relative to CBECSWhat? Site EUI is an indicator of theabsolute performance of thebuilding For buildings with no ESS, therelative performance of thebuilding can be compared toestablished benchmarks (CBECS)Insights Offices, Non-refrigeratedwarehouses, and K-12 schoolsare underperforming relative tomedian CBECS (2003) The median EUI of courthousesand residence halls are lowerthan the CBECS median Hospitals are performing at parwith CBECS peers.26250CBECS MedianSite EUI (KBtu/SF)197200Sample Median19615093100797467504029071625844
Site EUI by Building Types 27Mean and Standard Deviation (Site EUI)250200MeanStandard %00%Coefficient of VariationKnowledge of the variability will help toidentify the lowest performingbuildings. Standard Deviation andCoefficient of Variation are indicators ofthe variabilityResults Site EUIs for Office, Non refrigeratedwarehouses, hospitals and K-12 schoolsbuildings have considerable variationsamongst themselves (Cv 50%) The Site EUI for courthouses andresidence halls not only have bettermedian than CBECS but also theirvariations is comparatively low.Insights Focus on buildings with high Cv ( 50%)and high mean and median - Office, K12 Schools, non-refrigeratedwarehousesBuilding PortfolioEnergy Analysis
Site EUI Distribution for Office BuildingsBuilding PortfolioEnergy Analysis300Median (CBECS)67.3 kBtu/ft2Median (Sample)78.7 kBtu/ft2Number of Buildings250200InsightsThe median Site EUI for CBECS is lower thanthe sample median, indicatingthat the overall portfolio of office buildingsmay be less efficient than CBECSA third of the office buildings areunderperforming compared to the median.1501005002028406080100120140160180200220 240
Site EUI Distribution for Warehouses4035Number of Buildings30252015105029Median SiteEUI (CBECS)28.5 kBtu/ft2Building PortfolioEnergy AnalysisInsights Around 20 warehouses report a site EUI ofgreater than 100 kBtu/sft. The high EUI numbers may be due toclassifying the warehouses as nonrefrigerated when they should be classifiedas refrigeratedMedian SiteEUI (Sample)34 kBtu/ft2
Building PortfolioEnergy AnalysisSite EUI for Courthouse Buildings70Median (Sample) 61.5 kBtu/ft259Number of Buildings6050Median (CBECS) 93.2 kBtu/ft2464030201815There are 19 buildingswith Site EUI greaterthan the CBECSMedian Site EUI of93.2. There are 2buildings with Site EUIof 30 or less.121005015223045607590Site EUI (Kbtu/sft)301051201350More
Building PortfolioEnergy AnalysisSite EUI for HospitalsMedian (CBECS)196.9 kBtu/ft2Median (Sample)201.1 kBtu/ft2 Median Site EUI (CBCES) Median SiteEUI (Sample), indicating very similardistribution profiles 5 buildings with Site EUI 400 (3σ)31
Benchmarking Data Analysis Summary A significant number of buildings are classified as “Other” which can be acombination of different kinds of buildings The building portfolio is dominated by offices both by number and area.Hospitals however, are the largest consumers. There is a wide distribution of Energy Star scores for offices, hospitals and nonrefrigerated warehouses, indicating a range of performance. Focus on theunderperforming buildings (with low scores) to prioritize resources. Large buildings ( 250K) make up only 26% of all buildings yet consume asignificant portion of the energy ( 83%) A significant number of underperforming buildings are smaller than 250K SF inarea Offices, Non-refrigerated warehouses, courthouses and K-12 schools areunderperforming relative to median CBECS (2003) Focus on Offices, Non-refrigerated warehouses, courthouses and K-12 schoolsthat are smaller than 250K in GSF with ESS 50 and Site EUI 375 kbtu/sft32
Building Level AnalysisBuilding LevelAnalysis Energy consumption for most buildings can be described by modelsthat relate energy consumption to independent variables Change point models are used for predicting energy consumptionas a function of outside air temperature Models can detect statistically significant changes in buildingperformance over time - changes in building /equipment use orload, performance degradation due to improper operations Helps to identify energy conservation opportunities Monthly utility data analysis for some buildings can establishbenchmarks for weather and non weather related consumption High frequency utility data analysis (15 min) can help establish adaily profile that can be used for comparisons and identifyinganomalies in operation33
Monthly Energy use as a function of outside temperatureChange-Point ModelsEnergy use vs. outside temperature3 Parameter-Cooling Change-Point Model:β1 β2( X1 – β3)3 Parameter-Heating Change-Point Model:β1 β2( X1 – β3)where: β1 – intercept indicates energyconsumption that’s non weather dependentΒ2 - parameter defining temperaturedependency (slope)Β3 - the change-pointX1- outside air temperature34Building LevelAnalysis
Model Predictions using high frequency dataBuilding LevelAnalysisData needed: 15 minute interval time series electric data, outside air temperatureEnergy consumption predictions (red) using the 15 minute data as a function oftemperature and time of week compared to actual reported numbers (black)Insights This model can help to quickly identify any future anomalies in theperformance of the building- high weekend load, equipment being left onduring unoccupied hours3535
High Frequency Utility Data AnalysisBuilding LevelAnalysis Plot above shows the energyload in 15 minute intervals forSeptember 2008 Load NOT being turned offduring nights and weekendsdue to lack of controls asevidenced by high base-loadof 60-90 kW shown in green. Plot below shows the energyload in 15 minute intervals forSeptember 2009 Effective controls to turn offunnecessary loads duringnights and weekends asevidenced by very low baseload of 0-30 kW shown inpurple.3636
High Frequency Utility Data AnalysisBuilding LevelAnalysis Baseline operating monthly profile (June) established using themodel (No issues). Comparing this model with the operation in the months of July andAugust, this building fails to shut down at night (shaded periods).37
Building LevelAnalysisEnergy Conservation Opportunities High building resting load Occupancy hours need adjustment Setback points not enabled Continuously running equipment High loads during occupancy Set points can be tweaked Plot shows the baseline gas consumption data (blue) where theheating is triggered when the OAT 68 F Plot shows the post retrofit gas consumption data (red) after thecontrols are adjusted to trigger the heat when the OAT 60 F Building envelope needs sealing AHU economizing not enabled Simultaneous heating and cooling3838
Summary Benchmarking a portfolio of buildings results in large amount of data,that can provide valuable insights to:– Understand building stock by building types their number, size and energy usage– Identify underperforming buildings with each size and size category Focus on the underperforming buildings (80/20 rule) that will attain thebiggest return on investment––––High energy consuming building typesHighest Site/Source EUI compared to its peersLowest energy star scoresBiggest drop in performance year over year Building level analysis– Monthly utility data analysis High HVAC energy consumption– High frequency data analysis Understand issues with day to day operation (lack of night setback, equipmentbeing left during unoccupied hours, etc.)39
Resources ENERGY STAR Portfolio Manager– http://www.energystar.gov/buildings Standard Energy Efficiency Data Platform (SEED)– fficiency-data-platform Building Energy Data Exchange Specification (BEDES)– ata-exchange-specificationbedes Benchmarking Data Cleansing: A Rite of Passage along the BenchmarkingJourney, April 2015 rney40
QuestionsContact:Shankar Earni, Ph.D.Lawrence Berkeley National Laboratorysearni@lbl.govOffice: 510-486-712641
Benefits of Benchmarking Manage energy use proactively Assess and compare building's energy performance . Data Center Challenge) Larger buildings typically have a greater impact potential on energy consumption Identifying types of large buildings will help us design a targeted approach to improve their performance .