Transcription
The analysis presented in this report was completed prior to the COVID-19 outbreakin the United States and therefore the forecast estimates do not take into accountthe economic and housing market impacts of the actions taken to limit contagionof the virus. At this time, the duration and depth of the economic disruption areunclear, as are the extent and effectiveness of countermeasures. HUD will continueto monitor market conditions in the HMA and provide an updated report/addendumin the future.COMPREHENSIVE HOUSING MARKET ANALYSISKansas City,Missouri-KansasU.S. Department of Housing and Urban Development,Office of Policy Development and ResearchAs of January 1, 2020Share on:
Executive Summary 2Kansas City, Missouri-Kansas Comprehensive Housing Market Analysis as of January 1, 2020Executive SummaryHousing Market Area DescriptionThe Kansas City Housing Market Area (HMA), coterminouswith the Kansas City, MO-KS Metropolitan Statistical Area(MSA), encompasses 14 counties along the border betweenMissouri and Kansas. For this analysis, the HMA is divided intotwo submarkets: (1) the Missouri submarket, which consistsof Bates, Caldwell, Cass, Clay, Clinton, Jackson, Lafayette,Platte, and Ray Counties; and (2) the Kansas submarket,which consists of Johnson, Linn, Miami, Leavenworth, andWyandotte Counties. The city of Kansas City is known forits style of jazz. In 2018, the United Nations Educational,Scientific, and Cultural Organization designated Kansas Cityas a “City of Music,” the only such city in the United States.Tools and ResourcesFind interim updates for this metropolitan area, and select geographies nationally,at PD&R’s Market-at-a-Glance tool.Additional data for the HMA can be found in this report’s supplemental tables.For information on HUD-supported activity in this area, see the Community Assessment Reporting Tool.Comprehensive Housing Market Analysis Kansas City, Missouri-KansasU.S. Department of Housing and Urban Development, Office of Policy Development and Research
Executive Summary 3Kansas City, Missouri-Kansas Comprehensive Housing Market Analysis as of January 1, 2020Market QualifiersEconomySales MarketRental MarketSince 2011, nonfarm payroll jobs have increasedby an average of 16,200, or 1.6 percent, annually.The unemployment rate had dropped from a peakof 8.7 percent in 2009 and 2010 to 3.2 percent in2019. During 2019, job gains occurred in 8 of the11 employment sectors, with the education andhealth services sector having the largest increase,up by 7,000 jobs, or 4.5 percent. During the 3-yearforecast period, nonfarm payrolls are expected toincrease an average of 0.9 percent annually.The home sales market in the Kansas City HMA isslightly tight, with an estimated vacancy rate of1.3 percent, down from 2.7 percent in 2010. Thenumber of home sales in the Kansas City HMAdeclined nearly 5 percent during 2019 from anall-time high in 2018, as a lack of inventory for saleconstrained the market (Metrostudy, A Hanley WoodCompany). During December 2019, there were2.0 months of inventory on the market, downfrom 2.4 months in December 2018 (Kansas CityAssociation of Realtors ). During the 3-yearforecast period, demand is estimated for 17,875new homes. The 1,480 homes under constructionwill satisfy a portion of the demand during thefirst year.The overall rental market is currently balanced withan estimated 6.4-percent vacancy rate, down from11.7 percent in 2010, when conditions were soft.Similar conditions exist in both submarkets wherethe overall vacancy rates have declined significantlysince 2010. The apartment market in the HMA isslightly tight, with a vacancy rate of 4.5 percent during2019, down from 4.9 percent in 2018 (Reis, Inc.). Theapartment market improved significantly in the firsthalf of the decade from soft conditions in 2010. By2015, the apartment market conditions became tight.Increased rental production since then has helped tomeet the increased demand and alleviate the tightconditions that existed in 2015. During the 3-yearforecast period, demand is estimated for 13,425 newrental units. The 10,100 units under construction willsatisfy a significant portion of the demand.Increasing: During 2019, nonfarmpayrolls increased by 15,100, or1.4 percent, which was the ninthconsecutive year of growth.Slightly Tight: The average newand existing home sales priceincreased by 3 percent during 2019.TABLE OF CONTENTSEconomic Conditions 4Population and Households 10Home Sales Market 14Rental Market 23Terminology Definitions and Notes 30Balanced: The average rent foran apartment increased 3 percentduring 2019, which is the lowestannual rent growth since 2013.3-Year Housing Demand ForecastTotal DemandUnder ConstructionKansas CityHMA Total17,8751,480Sales UnitsMissouriKansas10,3508007,525680Kansas CityHMA Total13,42510,100Rental UnitsMissouriKansas8,3755,5005,0504,600Notes: Total demand represents the estimated production necessary to achieve a balanced market at the end of the forecast period. Units under constructionas of January 1, 2020. The forecast period is from the current date (January 1, 2020), to January 1, 2023.Source: Estimates by the analystComprehensive Housing Market Analysis Kansas City, Missouri-KansasU.S. Department of Housing and Urban Development, Office of Policy Development and Research
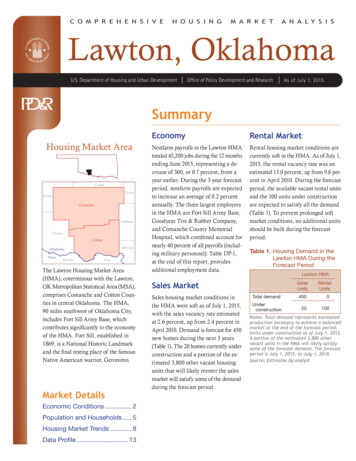
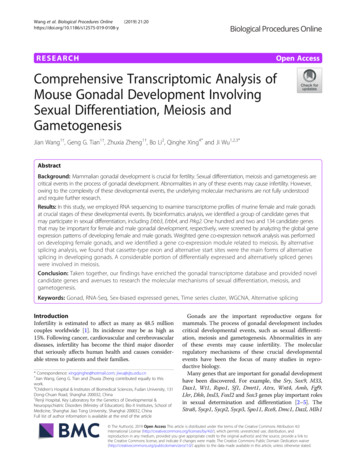
Economic Conditions 4Kansas City, Missouri-Kansas Comprehensive Housing Market Analysis as of January 1, 2020Economic ConditionsTable 1. 12-Month Average Nonfarm Payroll Jobs (1,000s)in the Kansas City HMA, by Sector12 MonthsEndingDecember2018Largest Sector: Professional and Business ServicesEconomic conditions remain strong as nonfarm payrolls haveincreased in the Kansas City HMA for 9 consecutive years.Primary Local Economic FactorsThe city of Kansas City originated as a river port on the Missouri River and laterbecame a major rail hub. Today, the HMA, which is near the geographic centerof the continental United States, continues to serve as a hub for shipping anddistribution for a large area of the country. As a transportation hub, one of themost recent developments in the HMA is Logistics Park Kansas City, a 1,700acre planned development with a capacity of 17 million square feet of industrialspace. The HMA is home to the Kansas City Southern railway, which ranks at816 on the Fortune 1,000 list. The city of Kansas City also has a large federalgovernment presence, which includes one of the five Internal Revenue Service(IRS) processing centers. With the IRS having a large presence in the city ofKansas City, the HMA is also home to H&R Block, Inc.AbsoluteChangePercentageChangeTotal Nonfarm Payroll Jobs1,096.51,111.615.11.4Goods-Producing Sectors126.5128.72.21.7Mining, Logging, & 0.4Service-Providing Sectors970.0982.912.91.3Wholesale & Retail Trade162.7160.8-1.9-1.2Transportation & Financial Activities80.078.3-1.7-2.1Professional & Business Services194.3198.03.71.9Education & Health Services155.5162.57.04.5Leisure & Hospitality110.0111.11.11.0Other tes: Based on 12-month averages through December 2018 and December 2019. Numbers may notadd to totals due to rounding. Data are in thousands.Source: U.S. Bureau of Labor StatisticsFigure 1. Sector Growth in the Kansas City HMA, 2001 to CurrentCurrent Conditions—Nonfarm PayrollsDuring 2019, nonfarm payrolls totaled more than 1.1 million, an increaseof 15,100 jobs, or 1.4 percent from 2018 when nonfarm payrolls increasedby 11,800, or 1.1 percent (Table 1). Nonfarm payrolls expanded in 8 of the 11employment sectors, with job growth being led by the education and healthservices sector, which increased by 7,000 jobs, or 4.5 percent, to 162,500 jobs.Contributing to job growth in this sector was the opening of several new microhospitals and expansions of existing hospitals throughout the HMA, includingthe 100 million expansion at The University of Kansas Hospital Indian CreekCampus and a 100 million expansion of the Olathe Medical Center in Olathe,Kansas. From 2001 to current, the education and health services sector hasbeen the fastest growing sector in the HMA, increasing by an average of 3,300jobs, or 2.6 percent, annually (Figure 1).12 MonthsEndingDecember2019 -80-60-40-20020 40Change in Jobs (%)60Total Nonfarm Payroll JobsGoods-Producing SectorsMining, Logging, & ConstructionManufacturingService-Providing SectorsWholesale & Retail TradeTransportation & UtilitiesInformationFinancial ActivitiesProfessional & Business ServicesEducation & Health ServicesLeisure & HospitalityOther ServicesGovernment80Note: The current date is January 1, 2020.Source: U.S. Bureau of Labor StatisticsComprehensive Housing Market Analysis Kansas City, Missouri-KansasU.S. Department of Housing and Urban Development, Office of Policy Development and Research
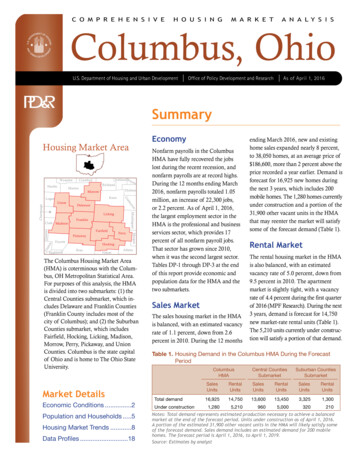
Economic Conditions 5Kansas City, Missouri-Kansas Comprehensive Housing Market Analysis as of January 1, 2020The government sector added the second greatest number of jobs, increasingby 5,700, or 3.7 percent, during 2019. Job growth accelerated in this sector dueto increased employment in the federal government subsector, which increasedby 1,400 jobs, or 5 percent, during 2019. Increased hiring of temporarycensus workers and the relocation of U.S. Department of Agriculture (USDA)employees from Washington, D.C., to a downtown Kansas City, Missouri locationcontributed to growth. More than 500 jobs in the USDA Economic ResearchService and National Institute of Food and Agriculture moved to the HMA. Thelocal government subsector increased by 4,300, or 3.9 percent, during 2019,which was mostly the result of hiring new schoolteachers, especially in theKansas submarket, where local government hiring remained flat from 2014through 2017. The federal government is the largest employer in the HMA, withmore than 20,800 employees at various agencies and an additional 7,500 atFort Leavenworth. Table 2 shows the list of the 10 largest employers in theKansas City HMA.Table 2. Major Employers in the Kansas City HMANumber ofEmployeesName of EmployerNonfarm Payroll SectorFederal GovernmentGovernment20,846Cerner CorporationProfessional & Business Services14,178The University of Kansas Health SystemEducation & Health Services10,229HCA Midwest HealthEducation & Health Services9,963Saint Luke’s Health SystemEducation & Health Services9,029Fort LeavenworthGovernment8,937Children’s Mercy HospitalEducation & Health Services8,614Ford Motor CompanyManufacturing6,640Hallmark Cards, Inc.Wholesale & Retail Trade6,085Sprint CorporationInformation6,000Notes: Excludes local school districts. Employment figures for Fort Leavenworth include federal governmentemployees and private contractors who work on base and military personal, who are not counted innonfarm payroll data.Source: ThinkKC.comThe largest employment sector in the Kansas City HMA is the professional andbusiness services sector with 198,000 jobs, accounting for nearly 18 percentof all nonfarm payroll jobs (Figure 2). The sector was the third largest growthsector in 2019, gaining 3,700 jobs, or 1.9 percent. This sector has been thesecond fastest growing sector in the HMA from 2001 to current, increasing byan average of 3,200 jobs, or 2.0 percent, annually. Since 2011, job creation inthis sector has increased by an average of 5,100 jobs, or 3.0 percent, annually,the fastest pace among all sectors since 2011. Contributing to the largeincrease of jobs in this sector are several expansions at Cerner Corporation—a healthcare information technology company. Work is still ongoing at theCerner Corporation Innovations Campus as construction is wrapping up onthe third and fourth phases of this project. Since this project started in 2016,the company has added more than 4,000 full-time employees with continuedgrowth expected over the next several years.Figure 2. Share of Nonfarm Payroll Jobs in the Kansas City HMA, by SectorMining, Logging, & Construction 5%Government 14%Manufacturing 7%Other Services 4%Trade 14%Leisure &Hospitality 10%Total1,111.6Transportation &Utilities 5%Information 1%Education &Health Services 15%Financial Activities 7%Professional & Business Services 18%Notes: Total nonfarm payroll is in thousands. Percentages may not add to 100 percent due to rounding.Based on 12-month averages through December 2019.Source: U.S. Bureau of Labor StatisticsComprehensive Housing Market Analysis Kansas City, Missouri-KansasU.S. Department of Housing and Urban Development, Office of Policy Development and Research
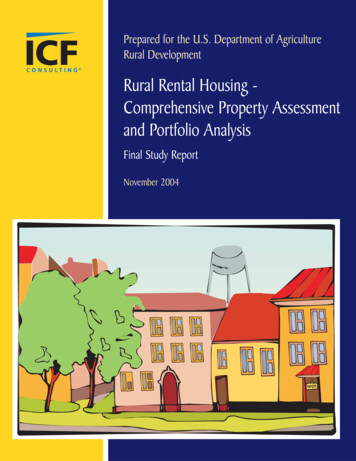
Economic Conditions 6Kansas City, Missouri-Kansas Comprehensive Housing Market Analysis as of January 1, 2020The unemployment rate in the Kansas City HMA during 2019 averaged3.2 percent, down from 3.4 percent in 2018. The 2019 unemployment rate isthe lowest rate recorded since 1999, when the unemployment rate averaged3.1 percent. The unemployment rate in the HMA is below the national rate of3.5 percent and has been below the national average since 2009. Figure 3shows the 12-month average unemployment rate for the HMA and the nation.Figure 3. 12-Month Average Unemployment Ratein the Kansas City HMA and the NationKansas City HMANationUnemployment Rate (%)10.08.06.04.0DecDe 00cDe 01c-0De 2cDe 03cDe 04c-0De 5cDe 06cDe 07c-0De 8cDe 09cDe 10cDe 11cDe 12cDe 13c-1De 4cDe 15cDe 16cDe 17cDe 18c-192.0Note: Based on the 12-month moving average.Source: U.S. Bureau of Labor Statistics2000 through 2003During the 2000s, the Kansas City HMA economy grew slowly compared withthe most recent trends, with nonfarm payroll jobs increasing by an average of200, or less than 0.1 percent, annually. Figure 4 shows the 12-month averageof nonfarm payrolls in the HMA. From 2001 through 2003, nonfarm payrollsdeclined by 7,200 jobs, or 0.7 percent, annually, to 951,400 jobs as a result ofthe 2001 national recession. Most of the job losses were in the professional andbusiness services, manufacturing, and information sectors, which declined byan average of 4,100, 3,700, and 2,800 jobs, or 3.1, 4.2, and 5.3 percent, a year,respectively. During this time, Sprint Corporation, which is headquartered inOverland Park, Kansas, laid off 1,700 workers. In addition, Ford Motor Companylaid off 35,000 people worldwide in 2002, with a significant number of the cutsoccurring in the HMA.Figure 4. 12-Month Average Nonfarm Payrolls in the Kansas City HMANational RecessionNonfarm Payrolls1,1501,1001,0501,000950900DecDe 00cDe 01c-0De 2cDe 03cDe 04c-0De 5cDe 06cDe 07c-0De 8cDe 09cDe 10cDe 11cDe 12cDe 13cDe 14cDe 15cDe 16cDe 17c-1De 8c-19Current Conditions—UnemploymentEconomic Periods of SignificanceNonfarm Payrolls (in Thousands)A sharp increase in employment in the mining, logging, and construction sector,which increased by 2,000 jobs or 4.0 percent in 2019, was another factor inthe increased rate of job growth in the HMA after the number of jobs in thissector remained flat during 2018. Along with the recent expansions at localhospitals, the Cerner Corporation, and ongoing expansions at the Logistics ParkKansas City, a 1.5 billion expansion of the Kansas City Airport began in April2019. Another major project ongoing in Kansas City is the redevelopment ofthe former Kansas City Star newspaper headquarters building. The 95 millionmixed-use development will convert the former headquarters building intooffice, retail, and dining locations.Note: 12-month moving average.Sources: U.S. Bureau of Labor Statistics; National Bureau of Economic ResearchComprehensive Housing Market Analysis Kansas City, Missouri-KansasU.S. Department of Housing and Urban Development, Office of Policy Development and Research
Economic Conditions 7Kansas City, Missouri-Kansas Comprehensive Housing Market Analysis as of January 1, 20202004 through 2008From 2004 through 2008, nonfarm payrolls in the HMA increased by anaverage of 11,900, or 1.2 percent, annually to 1.01 million jobs. The professionaland business services sector and the education and health services sector ledjob growth during this period, increasing by 6,100 and 3,200 jobs, or 4.5 and2.9 percent, respectively. H&R Block, Inc. opened its downtown Kansas CityCampus in 2006, which added more than 1,000 jobs in the professional andbusiness services sector. The education and health services sector benefitedfrom the completion of the Midwest Centerpoint Medical Center in 2007, whichcost 250 million and created more than 300 new jobs.2009 through 2010During 2009 and 2010, the HMA lost a significant number of jobs. Nonfarmpayrolls declined by an average of 22,600 jobs, or 2.3 percent, annually as aresult of the Great Recession, compared with jobs nationally declining by 2.5percent annually during the same time period. The information sector had thelargest percentage decline in jobs, falling by an average of 16.0 percent, or5,700 jobs, annually during the period. In 2009, Sprint Corporation eliminated8,000 jobs, or 14 percent of its workforce worldwide, with a significant portionof those cuts at its headquarters in the HMA. The economic downturn during2009 and 2010 also caused a slowdown in home construction, resulting in joblosses in the mining, logging, and construction sector. The mining, logging,and construction sector had the largest decline in jobs in the HMA, losing anaverage of 5,800 jobs, or 12.3 percent, annually. The manufacturing sectoralso had significant job losses during the downturn, declining by an averageof 3,900 jobs, or 5.1 percent, annually. During this period, every employmentsector declined except for the education and health services sector, whichcontinued to add jobs as demand for healthcare services by an agingpopulation helped this sector to continue to expand. During these years, theeducation and health services sector increased by an average of 3,200, or2.5 percent, annually.2011 through 2013The economy of the Kansas City HMA began to recover from the GreatRecession in 2011 and entered a prolonged period of growth. From 2011 through2013, nonfarm payrolls increased by an average of 11,700, or 1.2 percent,annually. Job growth was led by the professional and business services sector,which increased by an average of 6,300 jobs, or 4.0 percent, annually. Duringthese years, 7 of the 11 employment sectors grew. The education and healthservices sector and the leisure and hospitality sector also had strong job growthduring these years, increasing by an average of 2,700 and 2,200 jobs, or 2.0and 2.4 percent, annually, respectively. In percentage terms, the largest declineoccurred in the information sector, which decreased an average of 3.8 percent,or 1,000 jobs, annually. Job losses continued in the manufacturing sector, whichdeclined by 400 jobs, or 0.5 percent, annually.2014 through 2016The period from 2014 through 2016 was the strongest period of job growth inthe HMA since the 1990s. Nonfarm payrolls increased by an average of 22,100,or 2.2 percent, annually. Job growth occurred in 10 of the 11 employmentsectors, with the information sector being the only sector to decline. Duringthis period, the manufacturing sector also started to add jobs, increasing by anaverage of 2,700, or 3.8 percent, annually. Most of the job growth was in theautomotive parts manufacturing industry because Ford Motor Company andGeneral Motors Company both have a significant presence in the HMA. TheFord Motor Company Claycomo plant in northern Kansas City, which producesF-150 trucks and is producing the new Ford Transit, is one of the largestautomotive plants in the world. Ford Motor Company announced a 1.1 billioncapital investment in its facilities in 2013 to increase production. In addition tomaking this capital investment, Ford Motor Company hired 1,200 workers toproduce the new Transit line in mid-2014 and 900 additional workers in early2015 to accommodate increased production of the F-150. The professionaland business services sector led job gains during the
Notes: Total demand represents the estimated production necessary to achieve a balanced market at the end of the forecast period. Units under construction as of January 1, 2020. The forecast period is fro