Transcription
C O M P R E H E N S I V EH O U S I N GM A R K E TA N A L Y S I SColumbus, OhioU.S. Department of Housing and Urban DevelopmentOffice of Policy Development and ResearchAs of April 1, 2016SummaryEconomyHousing Market owDelawaren RossVintonPerryMorgannto GreenenClark MadisonFranklinAthensThe Columbus Housing Market Area(HMA) is coterminous with the Columbus, OH Metropolitan Statistical Area.For purposes of this analysis, the HMAis divided into two submarkets: (1) theCentral Counties submarket, which includes Delaware and Franklin Counties(Franklin County includes most of thecity of Columbus); and (2) the SuburbanCounties submarket, which includesFairfield, Hocking, Licking, Madison,Morrow, Perry, Pickaway, and UnionCounties. Columbus is the state capitalof Ohio and is home to The Ohio StateUniversity.Market DetailsEconomic Conditions.2Population and Households.5Housing Market Trends.8Data Profiles.18Nonfarm payrolls in the ColumbusHMA have fully recovered the jobslost during the recent recession, andnonfarm payrolls are at record highs.During the 12 months ending March2016, nonfarm payrolls totaled 1.05million, an increase of 22,300 jobs,or 2.2 percent. As of April 1, 2016,the largest employment sector in theHMA is the professional and businessservices sector, which provides 17percent of all nonfarm payroll jobs.That sector has grown since 2010,when it was the second largest sector.Tables DP-1 through DP-3 at the endof this report provide economic andpopulation data for the HMA and thetwo submarkets.Sales MarketThe sales housing market in the HMAis balanced, with an estimated vacancyrate of 1.1 percent, down from 2.6percent in 2010. During the 12 monthsending March 2016, new and existinghome sales expanded nearly 8 percent,to 38,050 homes, at an average price of 186,600, more than 2 percent above theprice recorded a year earlier. Demand isforecast for 16,925 new homes duringthe next 3 years, which includes 200mobile homes. The 1,280 homes currentlyunder construction and a portion of the31,900 other vacant units in the HMAthat may reenter the market will satisfysome of the forecast demand (Table 1).Rental MarketThe rental housing market in the HMAis also balanced, with an estimatedva cancy rate of 5.0 percent, down from9.5 percent in 2010. The apartmentmarket is slightly tight, with a vacancyrate of 4.4 percent during the first quarterof 2016 (MPF Research). During the next3 years, demand is forecast for 14,750new market-rate rental units (Table 1).The 5,210 units currently under construction will satisfy a portion of that demand.Table 1. Housing Demand in the Columbus HMA During the ForecastPeriodColumbusHMATotal demandUnder constructionCentral CountiesSubmarketSuburban ,4503,3251,3001,2805,2109605,000320210Notes: Total demand represents estimated production necessary to achieve a balancedmarket at the end of the forecast period. Units under construction as of April 1, 2016.A portion of the estimated 31,900 other vacant units in the HMA will likely satisfy someof the forecast demand. Sales demand includes an estimated demand for 200 mobilehomes. The forecast period is April 1, 2016, to April 1, 2019.Source: Estimates by analyst
2Economic ConditionsC o l u m b u s , O H C O M P R E H E N S I V E H O U S I N G M A R K E T A N A LY S I SThe economy in the ColumbusHMA, which is in its sixthconsecutive year of growth, expandedby 22,300 jobs, or 2.2 percent, duringthe 12 months ending March 2016(Table 2). The jobs lost during therecent period of economic weakness,which ended in the Columbus HMAduring late 2010, were recovered during 2012, when the HMA averaged968,000 jobs, more than the previouspeak of 960,800 jobs averaged during2007. From 2001 through 2007 theeconomy of the HMA recorded modestexpansion, including a slight downturnduring 2002 and 2003, until the nationalrecession affected the local economyin late 2007. During that 7-year period,the economy in the HMA expandedby 3,900 jobs annually, or 0.4 percent,compared with 0.6 percent annualgrowth nationally and a net dropstatewide in nonfarm payrolls of 0.5percent annually. Nonfarm payrollgrowth in the Columbus HMA from2001 through 2007 was not evenly distributed, however, because manufacturing payrolls fell by 3,600 annually,or 3.9 percent, and contributed almost90 percent of the average 4,200 lossannually of goods-producing jobs.Table 2. 12-Month Average Nonfarm Payroll Jobs in the ColumbusHMA, by Sector12 Months EndingAbsolute PercentMarch 2015 March 2016 Change ChangeTotal nonfarm payroll jobs1,023,4001,045,70022,3002.2Goods-producing sectors105,100108,7003,6003.4Mining, logging, & 071,9001,5002.1Service-providing sectors918,300936,90018,6002.0Wholesale & retail trade144,700145,1004000.3Transportation & 00– 400– 2.3Financial activities77,30080,2002,9003.8Professional & business services176,300178,1001,8001.0Education & health services147,600152,2004,6003.1Leisure & hospitality100,700103,4002,7002.7Other 001,8001.1Notes: Numbers may not add to totals because of rounding. Based on 12-monthaverages through March 2015 and March 2016.Source: U.S. Bureau of Labor StatisticsWorker Adjustment Retraining andNotification (WARN) Act reports bythe State of Ohio indicate that layoffsin the manufacturing sector wereconcentrated in steel, electronics, andautomotive parts manufacturing from2000 through 2007.Service-providing jobs expanded during that 7-year span, by 8,000 jobs ayear, or 1.0 percent. During that time,job growth was led by the educationand health services, professional andbusiness services, and transportationand utilities sectors, which registeredgains of 3,300, 2,900, and 2,200 jobsannually, or 3.3, 2.1, and 5.3 percent,respectively. Those gains more thanoffset losses of 2,900 jobs annually,or 1.9 percent, in the wholesale andretail trade sector and of 600 and 400jobs annually, or 2.7 and 0.5 percent,in the information and financialactivities sectors, respectively. Whenthe economy in the Columbus HMAbegan to contract because of thenational recession, nonfarm payrollsfell by 13,500 annually from 2008through 2010, an average annual lossof 1.4 percent. The job loss in theHMA was smaller than in the nationand the state of Ohio, which recordedaverage annual declines of 1.9 and2.5 percent, respectively. From 2008through 2010, all nonfarm payrollsectors in the HMA contracted exceptthe education and health services sector, which gained an annual averageof 4,800 jobs, or 4.1 percent, and thegovernment sector, which remainedstable during the 3-year period.From 2011 to the current date, nonfarmpayroll growth in the Columbus HMAhas averaged 2.5 percent annually,compared with annual growth ratesof 1.5 percent for the state of Ohioand 1.7 percent nationally. Since 2011,
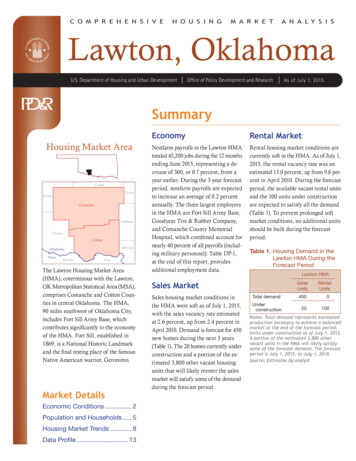
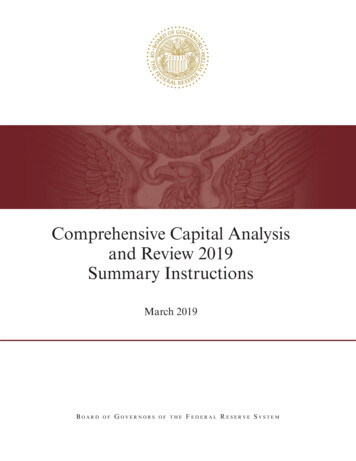
job growth in the HMA has beenled by the professional and businessservices, education and health services,and leisure and hospitality sectors,which expanded by 6,000, 4,800, and3,100 jobs annually, or 3.8, 3.6, and3.3 percent, respectively. The unem ployment rate in the HMA was 4.1percent during the 12 months endingMarch 2016, down from 4.6 percentduring the previous year. The unem ployment rate averaged 4.8 percentannually from 2000 through 2007,then it increased to average 7.8 percentfrom 2008 through 2010, when it peakedat 9.0 percent. Figure 1 shows trendsin the labor force, resident employment,and the unemployment rate from 2000through 2015.During the past 12 months, economicgrowth in the Columbus HMA was ledby the education and health servicesFigure 1. T rends in Labor Force, Resident Employment, and Unemployment Rate in the Columbus HMA, 2000 Through 002.0835,000Unemployment rate10.01,135,000Labor force andresident 02004052003Labor force20022001202000785,00020C o l u m b u s , O H C O M P R E H E N S I V E H O U S I N G M A R K E T A N A LY S I S3Economic Conditions ContinuedResident employmentUnemployment rateSource: U.S. Bureau of Labor StatisticsTable 3. Major Employers in the Columbus HMAName of EmployerThe Ohio State UniversityState of OhioOhioHealth Corp.JPMorgan Chase & Co.Nationwide Mutual Insurance CompanyThe Kroger Co.Mount Carmel Health SystemCity of ColumbusNationwide Children’s HospitalHonda of America Manufacturing, Inc.Note: Excludes local school districts.Source: Columbus Business FirstNonfarm Payroll SectorNumber ofEmployeesGovernmentGovernmentEducation & health servicesFinancial activitiesFinancial activitiesWholesale & retail tradeEducation & health tor, which increased by 4,600 jobs,or 3.1 percent (Table 2). The sector,which includes nearly 15 percent oftotal nonfarm payrolls, is currentlythe third-largest payroll sector in theHMA, up from 2000, when it wasthe fifth-largest sector. Investmentsin hospital and healthcare facilityexpansions have totaled more than 2.7 billion in the HMA since 2009.OhioHealth Riverside Methodist Hos pital, in Columbus, completed a 300 million expansion in July 2015,and has begun filling an expected330 new jobs. The largest healthcareexpansion was at the Wexner MedicalCenter at The Ohio State University.When the James Cancer Hospital andSolove Research Institute opened in thewinter of 2014, developed at a cost ofapprox imately 750 million, it was theprimary component of a larger 1.1billion healthcare investment by theuniversity. Currently still hiring staff,the university’s investment is expectedto result in 6,000 additional full-timejobs at the medical center and supportmore than 4,000 full-time jobs fromindirect economic activity, estimatedat 1.7 billion annually (The OhioState University Medical Center).Of the 10 largest employers in theColumbus HMA, 3 are healthcareproviders, including public healthsystems whose employees are countedin the government sector but supportadditional education and health ser vices jobs. The Ohio State University—the largest employer in the HMA,with nearly 31,000 employees and anannual payroll of 1.4 billion—hasan annual economic impact of morethan 4 billion (The Ohio StateUniversity). Table 3 shows the largestemployers in the Columbus HMA.The financial activities and thetransportation and utilities sectors
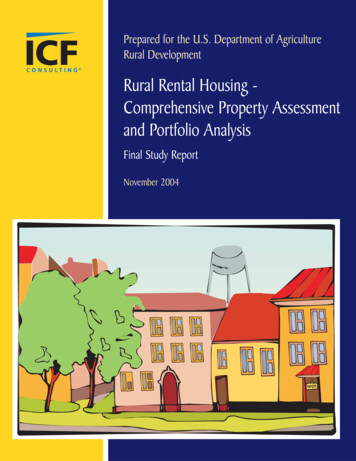
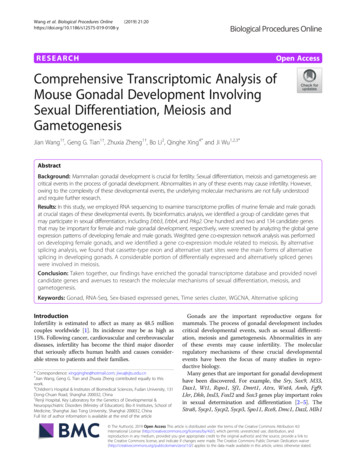
C o l u m b u s , O H C O M P R E H E N S I V E H O U S I N G M A R K E T A N A LY S I S4Economic Conditions Continuedhad the second and third largestgrowth during the past 12 months,increasing by 2,900 jobs each, or 3.8and 5.9 percent, respectively. In thefinancial activities sector, job growthwas in the insurance carriers andrelated activities industry. Two of thelargest employers in the ColumbusHMA are JPMorgan Chase Bankand Nationwide Mutual InsuranceCompany, which employ 19,200 and12,200 people, respectively. Otherfinancial activities sector companieswith significant employment inthe HMA include PNC FinancialServices Group, Inc., with approximately 3,000 employees, and StateFarm Mutual Automobile InsuranceCompany, with approximately 1,950employees. In the transportationand utilities sector, employment intransportation and warehousingcontributed more than 70 percent ofthe sector growth, or 2,100 jobs. Inearly 2015, Zulily began hiring anexpected 900 full-time warehouseemployees at their Lockbourne, Ohiofulfillment center. Columbus is withina 10-hour drive of 47 percent of thepopulation of the country, whichmakes it a central location for warehousing and shipping (The ColumbusRegion). The Rickenbacker GlobalLogistics Park, a component of theRickenbacker International Airport,is an intermodal logistics hub and aForeign Trade Zone. In November2015, Amazon.com, Inc., announcedplans to build a 1-million-square-footfulfillment center in the park. Thatfulfillment center and another slightlysmaller center to be built in Etna,Ohio—also in the Columbus HMA—are expected to employ approximately2,000 workers combined and beginoperations in the fall of 2016. From2001 through 2010, the transportationand utilities sector contributed 20percent of the growth in the serviceproviding sectors. Figure 2 showsnonfarm payroll growth, by sector,since 2000.During the 3-year forecast period,nonfarm payrolls are expected togrow by an average of 22,650 jobs, or2.2 percent, annually. Employment invarious construction industries willFigure 2. Sector Growth in the Columbus HMA, Percentage Change, 2000 to CurrentTotal nonfarm payroll jobsGoods-producing sectorsMining, logging, & constructionManufacturingService-providing sectorsWholesale & retail tradeTransportation & utilitiesInformationFinancial activitiesProfessional & business servicesEducation & health servicesLeisure & hospitalityOther servicesGovernment– 40– 30– 20– 100102030Note: Current is based on 12-month averages through March 2016.Source: U.S. Bureau of Labor Statistics40506070
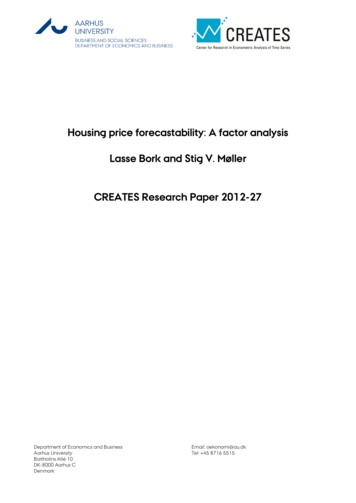
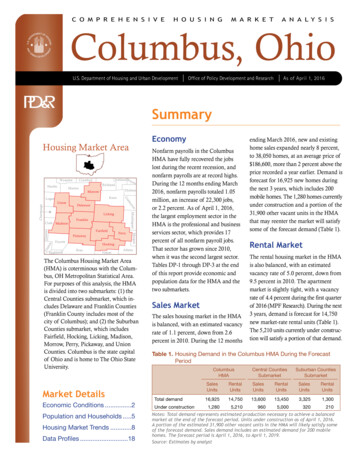
C o l u m b u s , O H C O M P R E H E N S I V E H O U S I N G M A R K E T A N A LY S I S5Economic Conditions Continuedexpand because of several significantdevelopment initiatives planned orin progress. Nine major constructionprojects are currently under way atThe Ohio State University, each withdevelopment costs of 20 millionor more. In the spring of 2016, theuniversity announced that a 42 million, 4-year renovation of the OhioStadium—where The Ohio StateUniversity football team plays—willbegin in 2017. The City of Columbusidentified capital improvement projects totaling approximately 1 billionFigure 3. Current Nonfarm Payroll Jobs in the Columbus HMA,by SectorGovernment 16.0%Mining, logging, & construction 3.5%Manufacturing 6.9%Wholesale & retail trade 13.9%Other services 4.0%Leisure & hospitality 9.9%Transportation & utilities 5.0%Information 1.6%Financial activities 7.7%Education & health services 14.6%Professional & business services 17.0%Note: Based on 12-month averages through March 2016.Source: U.S. Bureau of Labor Statisticsduring 2016, of which 612 millionwill be used to repair or replace publicutilities, including sanitation, storm,and water and electric infrastructure.Employment in the education andhealth services sector will continueto grow when Mt. Carmel St. Ann’scompletes the construction of a newinpatient rehabilitation hospital inWesterville. On completion, thatproject is expected to create 100 newfull-time jobs. Nationwide Children’sHospital expects to hire nearly 1,700new employees over the next 8 yearsand reports approximately 189million in new construction andrenovation projects currently underway. The professional and businessservices sector, which currently isthe largest nonfarm payroll sector inthe HMA, with 17 percent of totaljobs (Figure 3), is expected to growduring the next 3 years. The City ofColumbus Development Departmentestimates approximately 1,800 newjobs in technology, design, and mar keting will be added in the city ofColumbus during the next year.Population and HouseholdsAs of April 1, 2016, the population of the Columbus HMA isestimated at 2.04 million, growth of1.2 percent, or 24,700 annually, since2012 (Census Bureau populationestimates as of July 1). From 2007 to2012, population growth averaged 1.1percent annually, or 21,000 people.From 2000 to 2007, population growthaveraged 22,950 annually, or 1.3percent, and annual net in-migrationaveraged 9,800. Net-migration changestend to be moderate for the HMAbecause of its relatively stableemployment base. The two largestemployers, The Ohio State Universityand the State of Ohio, do not typicallyexpand or contract suddenly. Thehigher rate of population growth since2012 is the result of net in-migration,which grew from an average of 7,950annually from 2007 to 2012 to anaverage of 12,150 annually since2012. The economic recovery, whichbegan during 2011 and is ongoing,contributed to the growth.
Population and Households ContinuedCurrently, about 72 percent of theHMA population resides in theCentral Counties submarket. Thepopulation of the Central Countiessubmarket has grown faster than thatof the Suburban Counties submarketsince 2010, when the Central Countiessubmarket accounted for 70 percentof the HMA population, the samelevel as in 2000. Starting in 2007,population dynamics in the HMAchanged, and growth shifted into theCentral Counties submarket from theSuburban Counties submarket.During 2007, the rate of populationgrowth accelerated in the CentralCounties submarket and declined inthe Suburban Counties submarket,because net migration into the HMAshifted into the former area. From2000 to 2007, the population in theCentral Counties submarket grew byAverage annual changeFigure 4. Population and Household Growth in the Columbus HMA,2000 to Forecast25,00020,00015,00010,0005,00002000 to 20102010 to currentPopulationCurrent to forecastHouseholdsNotes: The current date is April 1, 2016. The forecast date is April 1, 2019.Sources: 2000 and 2010—2000 Census and 2010 Census; current and forecast—estimatesby analystFigure 5. Components of Population Change in the Columbus HMA,2000 to Forecast14,000Average annual changeC o l u m b u s , O H C O M P R E H E N S I V E H O U S I N G M A R K E T A N A LY S I S612,00010,0008,0006,0004,0002,00002000 to 20102010 to currentNet natural changeCurrent to forecastNet migrationNotes: The current date is April 1, 2016. The forecast date is April 1, 2019.Sources: 2000 and 2010—2000 Census and 2010 Census; current and forecast—estimatesby analystan average of 15,150 yearly, or 1.2percent, whereas the population inthe Suburban Counties submarketgrew by an average of 7,800 annually, or 1.5 percent. Contributing tothose annual population rates, netin-migration averaged 4,450 in theCentral Counties submarket and5,350 in the Suburban Countiessub market. During 2007, net inmigration in the two submarketstransposed. From 2007 to 2012, netin-migration increased in the CentralCounties submarket, to 6,800 peopleeach year, and population rose 1.4percent, or 17,950 people annually. Netmigration into the Suburban Countiessubmarket, by contrast, fell to 1,125people annually, and populationgrowth dropped to 0.5 percent or3,025 people. Net migration intoFranklin County from 2007 to 2010,when the economy contracted andthe unemployment rate in the HMArose, increased because people wantedto be near the job center of the HMA.The economy in the HMA began torecover in 2011, and net migrationinto each submarket grew starting in2012; however, migration into theCentral Counties submarket remainsstronger. From 2012 to 2016, netmigration into the Central Countiessubmarket rose to an average of 10,600and population growth averaged21,650 people, or 1.5 percent, annually.The gains were smaller in the Suburban Counties submarket, where netin-migration averaged 1,500 peopleannually and population growthaveraged 3,050 annually, or 0.5 percent.Figure 4 shows patterns of population and household growth andFigure 5 shows the components ofpopulation change in the HMA from2000 to the forecast date.From 2010 to 2015, the two countiesthat constitute the Central Counties
C o l u m b u s , O H C O M P R E H E N S I V E H O U S I N G M A R K E T A N A LY S I S7Population and Households Continuedsubmarket (Delaware and Franklin)were the two fastest-growing countiesin Ohio, averaging population growthof 2.0 and 1.4 percent annually. Duringthe same period, 6 of the 11 fastestgrowing counties in the state were inthe Columbus HMA because of netin- migration spurred by economicgrowth.The number of households in the HMAis currently estimated at 800,900, anincrea
Center at The Ohio State University. When the James Cancer Hospital and Solove Research Institute opened in the winter of 2014, developed at a cost of approximately 750 million, it was the primary component of a larger 1.1 billion healthcare investment by the university. Currently still hiring staff,