Transcription
C O M P R E H E N S I V EH O U S I N GM A R K E TA N A L Y S I SMidland, TexasU.S. Department of Housing and Urban DevelopmentOffice of Policy Development and ResearchAs of June 1, 2015SummaryHousing Market eMidlandUptonGlasscockReaganThe Midland Housing Market Area(HMA) comprises Midland and MartinCounties in western Texas. The HMA,approximately 50 miles from the south eastern corner of New Mexico, is cotermi nous with the Midland, TX MetropolitanStatistical Area (MSA). Together withthe adjacent Odessa, TX MSA, the HMAserves as a hub for the extraction of oiland natural gas in the Permian Basin,a geological formation rich in hydrocarbons. The city of Midland, also knownas the Tall City, is the largest city in theHMA and contains approximately 79percent of the HMA population.Market DetailsEconomic Conditions. 2Population and Households. 5Housing Market Trends. 7Data Profile. 12EconomyThe economy of the Midland HMA isslowing because of recent declines inoil prices after recording growth since2010. The mining, logging, and con struction sector is the largest sectorand accounts for 30.2 percent of non farm payrolls in the HMA. During the12 months ending May 2015, nonfarmpayrolls averaged 97,900 jobs, an in crease of 7,400 jobs, or 8.2 percent,from a year ago. During the 3-yearforecast period, nonfarm payrolls areexpected to increase by an average of2,150 jobs, or 2.2 percent, annually.Sales MarketThe sales housing market in the HMAhas improved in recent months butremains slightly tight, with an esti mated sales vacancy rate of 1.1 percent,down from 1.6 percent in April 2010.During the forecast period, employmentand population gains are expected tosupport demand for 2,200 new homes,including 100 mobile homes (Table 1).The 240 homes currently under con struction and a portion of the 1,400other vacant units in the HMA thatmay reenter the housing market willsatisfy some of the demand.Rental MarketThe rental housing market in the HMAis currently soft, with an estimated over all rental vacancy rate of 8.9 percent, upslightly from 8.4 percent in April 2010.The apartment vacancy rate is currently8.8 percent, up significantly from 0.6percent a year ago because of a slow down in economic growth that beganin November 2014 coupled with a highnumber of recent apartment completions.During the forecast period, demand isexpected for 1,125 new market-raterental units (Table 1). The 1,725 unitscurrently under construction will satisfyand exceed the forecast demand.Table 1. Housing Demand in theMidland HMA During theForecast PeriodMidland HMASalesUnitsRentalUnitsTotal demand2,2001,125Underconstruction2401,725Notes: Total demand represents estimatedproduction necessary to achieve a balancedmarket at the end of the forecast period.Units under construction as of June 1, 2015.A portion of the estimated 1,400 othervacant units in the HMA will likely satisfysome of the forecast demand. Sales demand includes an estimated demand for100 mobile homes. The forecast period isJune 1, 2015, to June 1, 2018.Source: Estimates by analyst
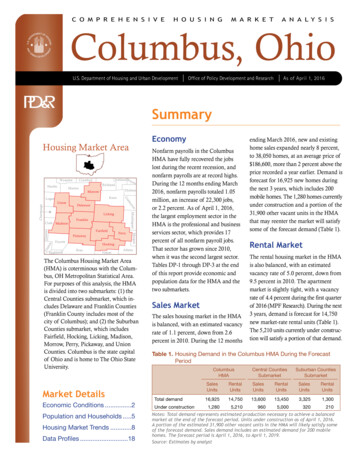
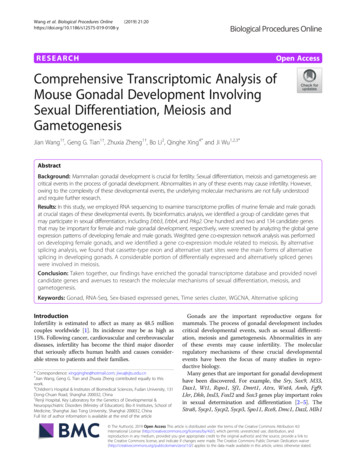
Economic Conditions2EM i d l a n d , T X C O M P R E H E N S I V E H O U S I N G M A R K E T A N A LY S I Sconomic growth in the MidlandHMA has slowed in recentmonths because, in November 2014,oil prices dropped below 73 per barrel,an important price point for profitableoil-extraction operations, and remainedbelow that price through the currentdate. The minimum price of oil requiredfor a substantial increase in drillingoperations averages 73 across all firms,with a range of 60 to 90 (survey byFederal Reserve Bank of Kansas City).The variation in the price range is be cause of numerous factors, includingpeculiarities of particular oil or gasfields, geographical location, or theefficiency of the company’s technology.The price for West Texas Intermediate crude oil as of June 1, 2015, was 60.24 per barrel, down 43 percentfrom the price of 105.79 per barrelin June 2014 (Federal Reserve Bankof St. Louis). The energy industryresponded to the decline by reducingthe number of well starts. During the3 months ending May 2015, TexasRailroad Commission districts 7C and8, which cover the Permian Basin,recorded 870 well starts, a 52-percentdecline compared with the number ofwell starts during the same 3-monthperiod 1 year ago (Baker Hughes,Inc.). Sales tax revenue in the city ofMidland in May 2015 totaled 4.93million, down 7.3 percent comparedwith sales tax revenues in May 2014,indicating an economic slowdown.Source: U.S. Bureau of Labor Statistics43201220112011020109Resident employment2008202020202020202020Labor force07Unemployment rateUnemployment 8.00110.090,00000100,00020Labor force andresident employmentFigure 1. T rends in Labor Force, Resident Employment, and Unemployment Rate in the Midland HMA, 2000 Through 2014During the 12 months ending May2015, nonfarm payrolls averaged97,900 jobs, an increase of 7,400 jobs,or 8.2 percent, from a year ago. Despitesignificant gains during the past 12months, nonfarm payrolls increasedless than 1.0 percent during the first5 months of 2015 compared with anincrease of 3.6 percent during thefirst 5 months of 2014 because of therecent decline in oil prices, which isexpected to last until late 2015. During the 12 months ending May 2015,the unemployment rate averaged 2.8percent, down from 3.4 percent dur ing the previous 12 months. By com parison, from 2000 through 2009,the unemployment rate averaged4.0 percent (Figure 1).The economy of the HMA has beenclosely linked to the oil and gas indus try since the discovery of oil in thePermian Basin during the 1920s. TheMidland HMA has the highest con centration of nonfarm payrolls in themining, logging, and construction sector of any MSA in the United States(U.S. Bureau of Labor Statistics). Con ditions in the oil and gas industry overthe years have caused several boomsand busts in the HMA economy. Theprevious secular oil boom, whichended in 1983, was caused by high oilprices that prevailed during the 1970sand early 1980s. When oil prices began to decline in 1983, the economyof the HMA entered a secular buststage, causing significant job lossesand dramatic declines in single-familyhome and apartment constructionactivity. During the mid-2000s, anothersecular oil boom began as a result ofan increase in the price of oil coupledwith the development of hydraulicfracturing techniques, greatly expanding the amount of oil and gas thatcould be extracted economically.
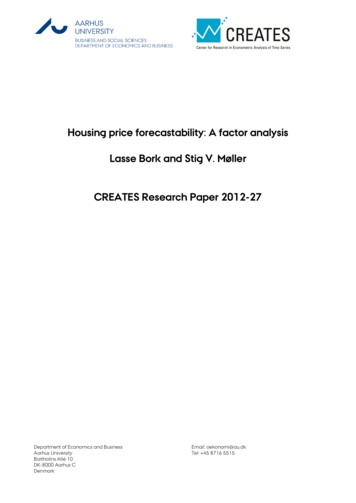
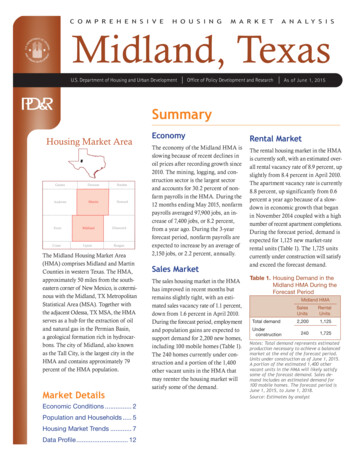
Economic Conditions ContinuedM i d l a n d , T X C O M P R E H E N S I V E H O U S I N G M A R K E T A N A LY S I S3From 2005 through 2008, nonfarmpayrolls in the mining, logging, andconstruction sector increased by anaverage of 1,475, or 11.3 percent,annually. The oil boom encountereda brief hiatus from late 2008 through2010, because the national recessionthat began in December 2007 contributed to a decline in oil prices fromJune 2008 to January 2010. Consequently, in 2009, nonfarm payrolls inthe mining, logging, and constructionsector decreased by 2,000, or 11.8percent. From 2010 through 2014, theoil boom resumed in earnest as oilprices recovered and nonfarm payrollsin the mining, logging, and construction sector increased by an averageof 2,700, or 13.8 percent, annuallyduring the period. From 2000 to thecurrent date, the mining, logging, andconstruction sector has grown morethan any other sector in the HMA,recording cumulative gains of 173percent (Figure 2).During the 12 months ending May2015, the mining, logging, and con struction sector led job gains in theHMA, increasing by 3,400 jobs, or13.0 percent, because of strength inthe energy industry until NovemberFigure 2. Sector Growth in the Midland HMA, Percentage Change, 2000 to CurrentTotal nonfarm payroll jobsGoods-producing sectorsMining, logging, & constructionManufacturingService-providing sectorsWholesale & retail tradeTransportation & utilitiesInformationFinancial activitiesProfessional & business servicesEducation & health servicesLeisure & hospitalityOther servicesGovernment– 40– 20020406080100120140160180Note: Current is based on 12-month averages through May 2015.Source: U.S. Bureau of Labor StatisticsFigure 3. Current Nonfarm Payroll Jobs in the Midland HMA, by SectorGovernment 9.6%Other services 3.3%Mining, logging,& construction 30.2%Leisure & hospitality 9.5%Education & health services 7.1%Manufacturing 4.2%Professional & business services 10.0%Financial activities 4.6%Information 0.9%Wholesale & retail trade 16.0%Transportation & utilities 4.6%Note: Based on 12-month averages through May 2015.Source: U.S. Bureau of Labor Statistics2014. The sector is also the largest inthe HMA, accounting for 30.2 percentof all nonfarm payrolls (Figure 3). Jobgains in the sector accounted for nearlyone-half of the gains in nonfarm pay rolls during the 12 months endingMay 2015. Despite gains during thepast 12 months, growth in the sectorhas slowed in recent months. Nonfarmpayrolls in the mining, logging, andconstruction sector decreased 2.0
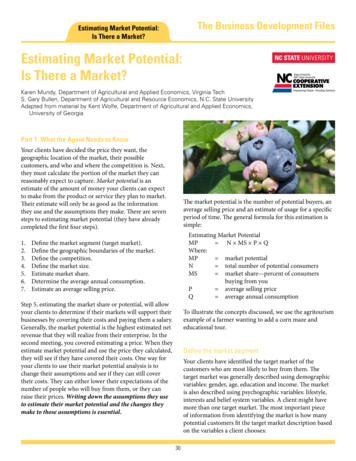
4Economic Conditions ContinuedM i d l a n d , T X C O M P R E H E N S I V E H O U S I N G M A R K E T A N A LY S I Spercent during the first 5 months of2015 compared with an increase of7.3 percent during the first 5 monthsof 2014. The sector includes some ofthe largest employers in the HMA,including Dawson Geophysical Com pany, the largest employer in the HMA,with 2,925 employees (Table 2).During the 12 months ending May2015, nonfarm payrolls in the wholesale and retail trade sector increased by1,500 jobs, or 10.6 percent (Table 3).The Commons at Northpark shoppingcenter is undergoing a 32,000-squarefoot expansion that has contributedan unspecified number of jobs to thewholesale and retail trade sector andTable 2. Major Employers in the Midland HMANumber ofEmployeesName of EmployerNonfarm Payroll SectorDawson Geophysical CompanyMidland Memorial Hospital andMedical CenterWal-Mart Stores, Inc.City of MidlandMidland CollegeBaker Hughes, Inc.Warren Equipment CompanyMidland CountyConcho Resources, Inc.Mining, logging, & constructionGovernment2,9251,250Wholesale & retail tradeGovernmentGovernmentMining, logging, & constructionMining, logging, & constructionGovernmentMining, logging, & construction950880740600600540510Note: Excludes local school districts.Source: City of MidlandTable 3. 12-Month Average Nonfarm Payroll Jobs in the Midland HMA,by Sector12 Months EndingTotal nonfarm payroll jobsGoods-producing sectorsMining, logging, & constructionManufacturingService-providing sectorsWholesale & retail tradeTransportation & utilitiesInformationFinancial activitiesProfessional & business servicesEducation & health servicesLeisure & hospitalityOther servicesGovernmentMay 2014May 1,5004000100300– � 1.412.03.24.4Notes: Numbers may not add to totals because of rounding. Based on 12-month averagesthrough May 2014 and May 2015.Source: U.S. Bureau of Labor Statisticsis expected to include 20 businessesby the time it is complete, althoughthe final completion date and numberof jobs to be created have not beenannounced. Banana Republic Factoryand Gap Factory opened in late 2014,and Destination XL opened in March2015, creating an undetermined num ber of jobs in the shopping center.Wal-Mart Stores, Inc., is the thirdlargest employer in the HMA, with1,250 employees. The leisure andhospitality sector also recorded stronggrowth during the 12 months endingMay 2015, increasing by 1,000 jobs,or 12.0 percent, during the 12 monthsending May 2015. The hotel industrycontributed to growth in the sectorby adding more than 10 hotels sinceJanuary 2013, including the 82-roomWyndham Microtel Inn & Suites, whichopened in October 2014, althoughthe number of jobs created was notannounced. The hotels were built tomeet strong demand, partly stemmingfrom employers in the energy industrythat use hotels and motels to providetemporary housing for workers. Theopening of the 34,628-square-footHorseshoe Pavilion, an entertainmentand meeting venue, in February 2015also contributed to job gains in thesector, although the number of jobscreated was not announced.During the 3-year forecast period, non farm payrolls are expected to increaseby an average of 2,150 jobs, or 2.2percent, annually. The rate of growthin nonfarm payrolls is expected toincrease each year during the forecastperiod as oil prices are expected torise. The average response for the expected price for West Texas Intermediate crude oil by year-end 2016 was 70 per barrel (Federal Reserve Bankof Kansas City). XCOR Aerospace,
M i d l a n d , T X C O M P R E H E N S I V E H O U S I N G M A R K E T A N A LY S I S5Economic Conditions Continuedan aerospace and space tourism com pany, is expected to relocate its head quarters to Midland International Airand Space Port, which in September2014 became the first U.S. facilitylicensed by the Federal AviationAdministration to serve both airlineflights and commercial human space flight. The relocation is expected tobegin in the summer of 2015 and tocreate 100 jobs by the time it is complete,although a final completion date hasnot been announced. The company isconducting research and developmentin commercial spaceflight applicationsand plans to begin commercial spacetourism in 2016, at an expected costof 95,000 per trip. Orbital Outfitters,a spacesuit manufacturer, is also relo cating to the HMA. The company isbuilding a 17,600-square-foot facilityfor testing spacesuits and satellites,although a final completion date andthe number of jobs to be created havenot been announced yet. The companyis also expected to manufacture customspacesuits for XCOR’s commercialspace tourism passengers. UnitedSurgical Partners International hasannounced plans to build a medicalcampus in the city of Midland. Con struction on the 52,000-square-footfacility is expected to commence inAugust 2015 and is expected to besubstantially complete by the secondquarter of 2016. The 144-room HotelFuel, a boutique hotel currently underconstruction in the city of Midland,is expected to be complete in early2016. A 112,000-square-foot H-E-Bgrocery store is under construction inthe city of Midland and is expected tobe complete in the spring of 2016. Atthis time, estimates are unavailable forthe number of jobs expected in thesefinal three projects.Population and HouseholdsAs of June 1, 2015, the popu lation of the Midland HMAwas estimated at 164,600, reflectingan average annual increase of 4,450,or 2.9 percent, from 141,671 on April1, 2010. By comparison, from 2000 to2010, the population increased by anaverage of 2,100, or 1.6 percent, annu ally. Population growth fluctuatedduring the previous decade, coincidingwith changes in the oil and naturalgas industry. Before the widespreadimplementation of hydraulic fracturing techniques in 2005 and rising oilprices in the same year, populationgrowth was relatively slow. Duringthis period, from 2000 to 2005, thepopulation grew by an average of1,175, or 1.0 percent, annually (CensusBureau, July 1 estimates). From 2005to 2009, the population grew by anaverage of 3,575, or 2.7 percent, annu ally, in response to the jobs created bythe widespread deployment of hydrau lic fracturing techniques coupled withsignificant increases in oil prices. From2009 to 2010, as a result of low energyprices during and immediately afterthe most recent national recession,which lasted from December 2007 toJune 2009, population growth slowedto 960 people, or less than 1 percent,annually. Since 2010, a year when oilprices increased, the rate of population growth has exceeded that whichprevailed from 2005 to 2009. During
6Population and Households Continuedthe 3-year forecast period, the rate ofpopulation growth is expected to slowbecause of the recent decline in oilprices, and the population is expectedFigure 4. Population and Household Growth in the Midland HMA,2000 to ForecastAverage annual change4,0003,5003,0002,5002,0001,5001,00050002000 to 20102010 to currentPopulationCurrent to forecastHouseholdsNote: The current date is June 1, 2015. The forecast date is June 1, 2018.Sources: 2000 and 2010—2000 Census and 2010 Census; current and forecast—estimates by analystFigure 5. Components of Population Change in the Midland HMA,2000 to Forecast3,000Average annual changeM i d l a n d , T X C O M P R E H E N S I V E H O U S I N G M A R K E T A N A LY S I S4,5002,5002,0001,5001,000to increase by 3,825, or 2.3 percent,annually, to 176,100 by June 1, 2018(Figure 4).From 2000 to 2005, a period of slowgrowth preceding the hydraulic frac turing boom, net in-migration averaged210 people annually, and net naturalincrease (resident births minus residentdeaths) averaged 970 per year. Afterthe deployment of hydraulic fracturing,from 2005 to 2009, net in-migrationaveraged 2,175 annually, and netnatural increase averaged 1,325 peryear. From 2009 to 2010, the HMArecorded net out-migration of 480people annually because of the declinein oil prices and recession. From 2010to the current date, net in-migrationresumed at a rapid pace, averaging2,900 people annually, because of therecovery in oil prices that began inFebruary 2010; during the same period,net natural increase averaged 1,550per year (Figure 5). During the fore cast period, net in-migration to theHMA is expected to average 2,125people annually.50002000 to 20102010 to currentNet natural changeCurrent to forecastNet migrationNote: The current date is June 1, 2015. The forecast date is June 1, 2018.Sources: 2000 and 2010—2000 Census and 2010 Census; current and forecast—estimates by analystFigure 6. Number of Households by Tenure in the Midland HMA,2000 to ,00002000Current2010RenterOwnerNote: The current date is June 1, 2015.Sources: 2000 and 2010—2000 Census and 2010 Census; current—estimates byanalystThe number of households in theHMA has increased at a higher ratesince 2010 than during the previousdecade. Since 2010, the number ofhouseholds has increased by 1,275, or2.3 percent, annually compared withan average annual increase of 810, or1.7 percent, during the past decade.The rate of household growth since2010 has lagged the rate of populationgrowth because from 2011 through2014, a period of tight housing markets,the additions to the housing inventorydid not keep up with rapid populationgrowth. The number of households inthe HMA is currently estimated at59,100. Figure 6 illustrates the numberof households by tenure in the HMAfor 2000, 2010, and the current date.
7Population and Households ContinuedM i d l a n d , T X C O M P R E H E N S I V E H O U S I N G M A R K E T A N A LY S I SDuring the forecast period, the rate ofhousehold growth is expected todecrease because of the recent declinein oil prices, and the number ofhouseholds is expected to increase by1,150, or 1.9 percent, annually toapproximately 62,550 households byJune 1, 2018. Table DP-1, at the endof this report, provides additionaldemographic data for the HMA.Housing Market TrendsSales MarketDespite some recent improvement, thesales housing market in the MidlandHMA is currently slightly tight becauseof strong employment and populationgrowth from 2010 through 2014, butit is approaching balanced conditionsbecause of the recent slowdown ineconomic growth. The home salesvacancy rate is estimated at 1.1 percent,down from 1.6 percent in April 2010.During the 12 months ending May2015, new and existing home sales(including single-family homes, townhomes, and condominiums) totaled1,950, a 4-percent increase comparedwith new and existing home salesduring the previous 12-month period(Real Estate Center
nous with the Midland, TX Metropolitan Statistical Area (MSA). Together with the adjacent Odessa, TX MSA, the HMA serves as a hub for the extraction of oil and natural gas in the Permian Basin, a geological formation rich in hydrocar-bons. The city of Midland, also known as the Tall City, is