Transcription
FACTA UNIVERSITATIS (NI Š)S ER .: E LEC . E NERG . vol. 23, no. 1, Apr. 2010, 73-88Bandwidth Calculation for VoIP Networks Based on PSTNStatistical Model- ord-e BabićZvezdan Stojanović and DAbstract: This paper shows an analysis how to calculate proper bandwidth for VoIPcalls after proper dimensioning of PSTN network. For this purpose, we use Erlang Band extended Erlang B formulae. Further, we have developed a software tool, namedBandwidth Calculator to calculate proper number of the circuits on the PSTN side andafter that IP bandwidth. Traffic analysis is conducted for VoIP networks consideringimpact of many factors on the bandwidth such as: voice codecs, samples, VAD, RTPcompression. The results obtained by bandwidth calculator are compared to simulation results and data obtained by measurements.Keywords: VoIP, bandwidth calculation, tele-traffic analysis.1Introductionis probably the most expensive component of the network. Thenetwork administrator has to know how to calculate proper bandwidth andhow to reduce overall bandwidth consumption [1–3]. In this paper we developa method to calculate proper bandwidth for VoIP calls after proper dimensioningPSTN network and determining optimal number of the circuits for the peak hourtime.In this paper, the two categories of Internet subscribers are considered: dialup and ADSL. In the Literature ( [4–11]), it is assumed that the Internet traffichas property of self-similarity. In order to express the degree of self-similaritynumerically, we use so-called Hurst parameter. In [4] and [6] it has been shownthat when value of Hurst parameter is small, i.e. H 0, 7, a classical model canBANDWIDTHManuscript received January 13, 2010.Z. Stojanović Telekom Srpske, Bosnia and Herzegovina (Tel: 387-56-231-900; e-mail:zvezdan.stojanovic@mtel.ba). Dj. Babić, Fakultet za informacione tehnologije, SlobomirP Univerzitet, P.O. Box 70 Slobomir, 76300 Bijeljina, Bosnia and Herzegovina; (e-mail:dj.babic@spu.ba).73
74be used, which is based on Erlang B and Extended Erlang B and their inversionfunctions. Thus, our first task is to check if classical method for calculation ofnumber of circuits can be used. This can be done by calculating Hurst parameterfor both type of traffic. Here, we use linear and square regression to show futuretrends of the ADSL and dial-up traffic behaviors and for the calculation of Hurstparameter.The main task is to find method for proper dimensioning of a typical PSTNnetwork. We consider a typical part of the network; however results and tools canbe applied to any similar situation. We show that the value of Hurst parameter is inrange H 0.7 for dial-up traffic and for ADSL traffic is bigger than 0.7 . Erlangbased model can be applied for the network with low load and rare loss and for thehigh speed and highly aggregated traffic on the backbone network (network core)because that traffic tends back to Poisson [12–16] . Because of its mathematicalsimplicity, well defined and well-known conditions for the simulations, it is stilluseful tool [13–19].Further, obtained traffic analysis is applied to VoIP network, and proper bandwidth for VoIP calls is calculated. We have developed a software tool which operates as bandwidth calculator for such network [19]. First, we calculate propernumber of circuits. After that, based on this calculation, the proper bandwidthis calculated for several VoIP codecs. The bandwidth calculation takes into consideration impact of many factors on the bandwidth such as: voice codecs, VAD,RTP compression. The results obtained by bandwidth calculator are compared tosimulation results and data obtained by measurements.The paper is organized as follows. In chapter 2, PSTN statistical model isdescribed. The regression analysis is made in Chapter 3. Tele-traffic analysis ispresented in Chapter 4. Finally, some case studies are discussed in Chapter 5.Chapter 6 describes traffic analysis of the VoIP network.2 PSTN Statistical ModelErlang B and Extended Erlang B models are used to determine proper numberof circuits to carry voice traffic during the busy hour time (BHT), because it isperiod with maximum traffic load which one network must support [20]. However,our aim is to calculate proper number of circuits for VoIP calls. In determiningbusy hour traffic (BHT) intensity for certain day, we have to use simplificationin which BHT is 17 percent of all traffic for that day [21]. The Erlang B trafficmodel [19–24] is based on the following initial assumptions: (i) an infinite numberof sources, (ii) Poisson arrival process, (iii) block calls cleared, and (iv) holdingtimes are exponentially distributed. But it can be shown that (iv) assumption is
75valid for arbitrary holding time distribution [20,22]. In this paper is checked whichdistribution is valid in our case.The following expression is used to derive the Erlang B model:AciPB c! kc A k 1 k!(1)Here, PB is the probability of blocking a call, c is number of circuits, and Ai isoffered Internet traffic1 . Calls with retrials are not used into the consideration inErlang B model. For this purpose Extended Erlang B model is used which can becalculated on the base of already calculated Erlang B model. Based on (1), ErlangB, Extended Erlang B models and their inversion functions, we have developed thesoftware tool named Bandwidth Calculator [19]. The Bandwidth Calculator canbe used to determine proper number of circuits for VoIP calls. The user interfaceof the software tool is shown and explained later.Erlang based model can be applied for the network with low load and rare lossand for the high speed and highly aggregated traffic on the backbone network (network core) because that traffic tends back to Poisson. Because of its mathematicalsimplicity, well defined and well-known conditions for the simulations it is stilluseful tool [13–19].3Regression AnalysisIn order to analyze how increased number of subscribers influence on the traffic andto calculate Hurst parameter, we use regression model for the specific category ofsubscribers under consideration. The regression analysis is used to examine trendsof the subscriber behavior in the future. We use regression analysis model whichis based on the real values of the variables obtained by measurements. The regression analysis includes estimation of the unknown parameters, calculating dispersioncharacteristics and other statistical-analytical indices [25, 26].The regression model is used when it is desired to express analytical relationbetween data appearance. The aim of this model is to find relationship betweensingle variable Y and several variables X. The simplest method of the regression islinear regression [25]:Y a bX u(2)1 Offeredtraffic is theoretical parameter, it can not be measured and it is used for calculation likein Erlang formula. Calculations on the rest of the paper is based on the real, measured traffic knownas carried (serverd) traffic.
76Here, X is independent variable, Y is dependent variable, u is error term known asresidual, and a, b are parameters which have to be determined. Equation (2) can bewritten as:yi ŷi ui , where ŷi a bxi , for i 1, 2, ., n.(3)where, ŷi is a deterministic part of model. Residual ui can be expressed as:ui yi ŷi , ui yi a bxi , for i 1, 2, ., n.(4)In order to achieve better accuracy, square regression and method of the leastsquares can be used: The square regression model is expressed as [24]:yi a bxi cx2 ui , for i 1, 2, ., n.(5)Residual sum of squares can be written as:nni 1i 1SQ (yi ŷi )2 (yi (a bxi cxi2 ))2 .(6)Parameters a, b and c can be found by solving the following set of equations: SQ SQ SQ 0; 0; 0 a b c(7)Mathematical calculations are performed by using Matlab and by operating withdata obtained by measurements.4 Tele-Traffic AnalysisWhen setting up a statistical model of a network, it is very important to chooseproper mathematical traffic model. For connection-oriented circuit switched application, such as voice, relatively simple analytical model exists based on the Poissonprocess. This is classical model [20]. Connectionless packet-oriented data traffic(Internet traffic) is much more variable and thus less predictable. The main reason is in the fact that a typical multimedia application contains packets from thedifferent sources, such as video, voice and data, which differ in statistical pattern.However, the traffic poses certain degree of correlation between arrivals and longrange dependences on time, thus it can be defined as self-similar traffic [9], [10].The fundamental questions related to the traffic model are:1. Whether it is possible to use the classical model in the presence of selfsimilar traffic, and,
772. How self-similarity influences on the network performance in the situationunder consideration.In this paper, the property of self-similarity and Hurst parameter which is used tomeasure degree of self similarity is explained. After that, self-similarity of dial-upand ADSL traffic are analyzed, for the network segment under consideration. Allanalysis and other calculations are performed using traffic measurements in a realnetwork.4.1 Self-similar trafficA self-similar phenomenon displays structural similarities across a wide range oftimescales: milliseconds, seconds, minutes, hour, even days and weeks. It meansthat it is not matter what time scale is observed, similar pattern is seen (fractal-likebehavior) [4]. The definition of self-similarity is given below [4, 6, 9, 10]:X is defined to be a wide sense stationary random process with mean µ ,variance σ and autocorrelation function r(k). A stationary random process X (Xt;t 1, 2, 3.) is statistically exact second-order self-similar if it has the sameautocorrelation function r(k) E[(xt µ )(xt 1 µ )] as the series X m for all m,(m)where X m is the m-aggregated series X (m) (Xk ; k 1, 2, 3, .) obtained by(m)summing the original series X over non-overlapping blocks of size m, Xk 1m (Xkm m 1 Xkm m 2 · · · Xkm ).The self-similar process has the following properties: i) slowly decaying variance, and ii) long range dependence. Hurst parameter H is used to determine thedegree of the self-similarity. It expresses the speed of decay of the autocorrelationfunction. For a self-similar process, Hurst parameter is in range 21 H 1; forH 21 the time series is short range dependent; for H 1, the process becomesmore and more self similar [4]. In [4] and [6], it is shown that for H 0, 7, thelong-range dependence is unimportant, and self-similar traffic pattern can be neglected. In this case classical model for traffic engineering can be used. This typeof traffic has short-range dependency.For the larger values of Hurst parameter H, the property of self-similarity hasbad influence on the network performance. In [5], it is shown that in this case,buffering can be extremely large. However, increased buffering leads to large queuing delays and overall delay which has impact on QoS for real-time applications,e.g. for VoIP. In the case under consideration, H parameter has to be calculated forthe dial-up and ADSL traffic.
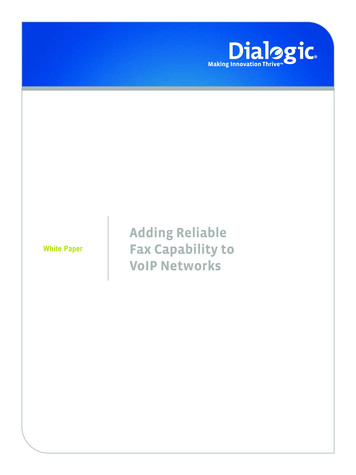
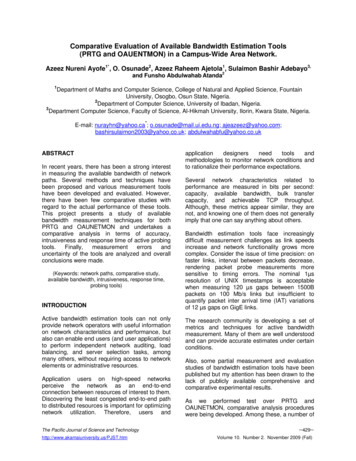
784.2 R/S method for the calculation of Hurst parameterIn [6], [8] and [9], several methods for calculation of Hurst parameter are explained.However, in this paper, we use R/S method.For empirical time series Xt (for t 1, 2, ., n) with arithmetic mean X(n) andvariance S2 (n), we define R/S statistics, also called Rescaled Adjusted Range, withR(n)/S(n) [9]. Here R(n) is defined as:"#"#nR(n) max (Xi X(n)), 1 k n mini 1n (Xi X(n)), 1 k n(8)i 1For almost all naturally occurring time series, the rescaled adjusted range statisticfor set of samples of size n follows the following relationship: R(n)(9) cnH as n , c is constant.ES(n)If log[R(n)/S(n)] is plotted versus log(n), the slope of the curve is equal toHurst parameter H.5 Case StudiesIn this part, we consider a typical part of the network; however results and toolscan be applied to any similar situation.5.1 Description of the network segment under considerationFigure 1 shows situation under analyses. From Fig. 1, it is obvious that there aretwo types of the traffic which must be observed differently.1. Served (carried) dial-up traffic: It can be seen from the Fig. 1. that subscribers from Tandem Office (TO in Fig. 1.) use same circuits for voice anddata for transmission to the Main Exchange (ME in the Fig. 1.) in Zvornik fordial-up category of the subscribers. The switching part of EWSD exchangein Zvornik (ME in Fig. 1.) separates voice from data using dialed numbers.This is done due to the fact that anonymous dial-up subscribers dial 081-501433 and classical dial-up subscribers dial 081-59-1432 number, and thusall subscribers dialing those numbers are directed to Access Server. AccessServer and switching part of EWSD exchange are connected via 90 transmission trunks. After that data is transferred to IP-MPLS bus across edge router.All traffic between main exchange and all exchanges which are connected tothe main exchange is measured.
79Fig. 1. Network segment under consideration2. Served (carried) ADSL traffic (data part of ADSL traffic): From each NodeExchange (NE) and TO with ADSL to the ME (Main Exchange), see Fig. 1,data part of ADSL traffic is transmitted using separate optical transmissionnetwork. The voice part of the ADSL traffic from all exchanges is mixedwith voice traffic, from ordinary PSTN subscribers [19]. Whole data part ofADSL traffic, from NE, TO and ME, is directed via edge router in Zvornikto IP/MPLS bus to core router in Banja Luka.Overall served traffic is composed of served telephone and data traffic:Amix At Ai(10)Here, Amix is overall served traffic, At is served telephone traffic and Ai is servedInternet (data) traffic. In our case:Ai Adial up AADSL .(11)In (11), Ai is served data traffic directed from edge router in Zvornik to corerouter in Banja Luka by GEth (Zx) interface, andAdial up Adialup 56k Adial up ISDN(12)
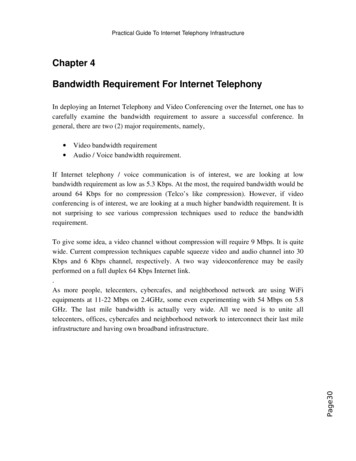
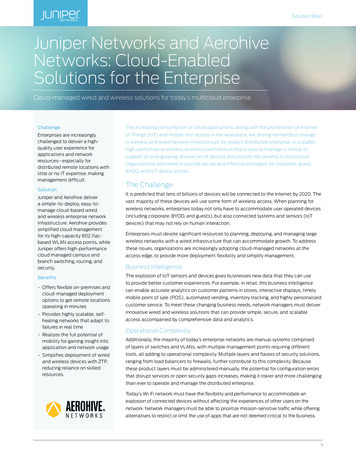
80where, Adial up 56k is served traffic from subscribers with dial-up connections toInternet, and Adial up ISDN is served traffic from subscribers with ISDN connectionto Internet and AADSL is served traffic from ADSL subscribers [19].ADSL served traffic and dial-up served traffic are different, by their nature,because ADSL served traffic has bigger self-similarity than dial-up served trafficwhich can not be neglected. ADSL served traffic has different statistical properties.The third difference is the fact that data part of ADSL served traffic is directedpermanently to IP/MPLS bus. The rest of traffic, i.e. dial-up served traffic and voiceserved traffic, which come to main exchange from all NEs, (Node Exchanges),TO and RDLU (Remote Digital Line Unit) is directed to the IP/MPLS bus afterseparation of voice and data, see Fig. 1.Having in mind the self-similarity property of ADSL traffic and the fact thatIP/MPLS bus has great capacity and DWDM equipment is ready to start withworks, there is no sense to perform dimensioning of that part of the network. Statistical models used here are based on real data obtained by measurement of trafficbetween Access Server and edge router.5.2 Traffic variablesThere are two key traffic variables for dial-up traffic: holding time and interarrivaltime [27, 28]. In order to test initial assumption that holding time is exponentiallydistributed according to Erlang B model, we take only first variable in consideration. There are several methods to examine the underlying distribution [28]. In thispaper, we use two: i) a histogram or density plot, and, ii) the squared coefficient ofvariance.In order to test assumption of underlying distribution, we use data obtained bymeasurements during 6 months. Based on the collected data, it is very useful to plotfrequency of occurrence of each score. This is known as frequency distribution, orhistogram, which is simply a graph plotting values of service times (holding times),on x axis, and number of observations (frequency) on y axis. In ideal case, i.e. inthe case of normal distribution, all service times will be distributed symetricallyaround the centre of all values (peak value at the mean). However, from Fig. 2, wesee that this is not the case.From Fig. 2, we can see that a positive skew is evident in the data. Thisimplies that there are a many short sessions with short serving times. The largenumber of short sessions can be based on large number of aborted sessions. Ahistogram or density plot is more visual test and additional test has to be performedto examine distribution. The squared coefficient of variance Cx2 is calculated toprovide additional information about underlying distribution [27].From Table 1, one can be read data about variance (column 8), mean duration of
81Fig. 2. Histogram of the aggregate holding times (based on data obtained by measurements fromaugust 2008 to January 2009)session (column 3) and square coefficient of variance (column 9). If squared coefficient of variance is equal to one, i.e. Cx2 1, then X has exponential distribution.If Cx2 1/k, then X has Erlang-k distribution. Finally, if Cx2 1, than X has nstage hyper-exponential distribution. The squared coefficient of variance (column9) indicates that the services time follows hyper-exponentially distribution2 [28].Table 1. Daily Service Time 91306165645735925845525902Variance 15.7782.030.8145,365,444,655,815,706,745,00From Table 1, we see that the mean holding times per day are slightly different,with the biggest value on Monday. In our case median holding time provides a littlemore insight into actual traffic [26, 28]. Based on the median value, we conclude2 Importantproperties of Erlang B formula is insensivity of underlaying distribution
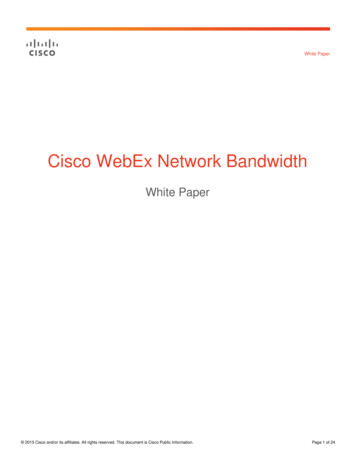
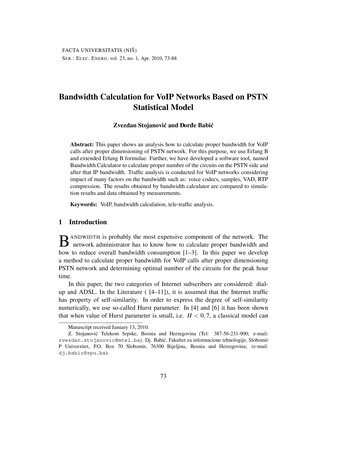
82that 50 percent of all sessions involve short holding times. Seventy-five percentof all sessions are less than 10 minutes in duration, and twenty-five percent of allsession are between one half and one minutes. These results are in accordance withhistogram in Fig. 2 and positive skew in it.5.3 Self-similarity and Hurst parameterIn analysis of the dial-up traffic, we have used data obtained by traffic measurementduring 17 months for the network segment under consideration, see Fig. 1. Inanalysis of ADSL traffic, we have used data obtained by traffic measurement during8 months.From Fig. 3.(a), we can see that the value of Hurst parameter for dial-up trafficis H 0, 6344. We can conclude that in the case of dial-up traffic we can use classical model for network dimensioning because H 0, 7. This fact is in accordancewith results of [4] and [6].(a)(b)Fig. 3. (a) R/S plot for dial-up traffic and, (b) ADSL trafficFrom Fig. 3.(b), we can see that H 0, 8529, thus Hurst parameter is biggerthan 0,7. We can conclude that in the case of ADSL traffic the property of selfsimilarity is significant, thus it is not possible to use classical model for networkdimensioning.5.4 Network dimensioning and Bandwidth calculatorFigures from 4(a) to 4(b) show relationship between blocking probability PB andrecall factor (repeated call attempt), which is varied in the range from 0.1 to 0.9,for each of 20 measured days, (table 2).
83Relationship recall factor to blocking probabilityRelationship recall factor to blocking probability321.81.6Blocking probabilityBlocking 30.40.50.60.70.80.9Recall factor00.10.20.30.40.50.60.70.80.9Recall factor(a)(b)Fig. 4. Relationship between blocking probability and recall factor for the constan
erates as bandwidth calculator for such network [19]. First, we calculate proper number of circuits. After that, based on this calculation, the proper bandwidth is calculated for several VoIP codecs. The bandwidth calculation takes into con-sideration impact of many factors on t