Transcription
Comparative Evaluation of Available Bandwidth Estimation Tools(PRTG and OAUENTMON) in a Campus-Wide Area Network.Azeez Nureni Ayofe1*, O. Osunade2, Azeez Raheem Ajetola1, Sulaimon Bashir Adebayo3,and Funsho Abdulwahab Atanda21Department of Maths and Computer Science, College of Natural and Applied Science, FountainUniversity, Osogbo, Osun State, Nigeria.2Department of Computer Science, University of Ibadan, Nigeria.3Department Computer Science, Faculty of Science, Al-Hikmah University, Ilorin, Kwara State, Nigeria.E-mail: nurayhn@yahoo.ca*; o.osunade@mail.ui.edu.ng; ajeazeez@yahoo.com;bashirsulaimon2003@yahoo.co.uk; abdulwahabfu@yahoo.co.ukABSTRACTIn recent years, there has been a strong interestin measuring the available bandwidth of networkpaths. Several methods and techniques havebeen proposed and various measurement toolshave been developed and evaluated. However,there have been few comparative studies withregard to the actual performance of these tools.This project presents a study of availablebandwidth measurement techniques for bothPRTG and OAUNETMON and undertakes acomparative analysis in terms of accuracy,intrusiveness and response time of active ty of the tools are analyzed and overallconclusions were made.(Keywords: network paths, comparative study,available bandwidth, intrusiveness, response time,probing tools)INTRODUCTIONActive bandwidth estimation tools can not onlyprovide network operators with useful informationon network characteristics and performance, butalso can enable end users (and user applications)to perform independent network auditing, loadbalancing, and server selection tasks, amongmany others, without requiring access to networkelements or administrative resources.Application users on high-speed networksperceive the network as an end-to-endconnection between resources of interest to them.Discovering the least congested end-to-end pathto distributed resources is important for optimizingnetwork utilization. Therefore, users andThe Pacific Journal of Science and pplicationdesignersneedtoolsandmethodologies to monitor network conditions andto rationalize their performance expectations.Several network characteristics related toperformance are measured in bits per second:capacity, available bandwidth, bulk transfercapacity, and achievable TCP throughput.Although, these metrics appear similar, they arenot, and knowing one of them does not generallyimply that one can say anything about others.Bandwidth estimation tools face increasinglydifficult measurement challenges as link speedsincrease and network functionality grows morecomplex. Consider the issue of time precision: onfaster links, interval between packets decrease,rendering packet probe measurements moresensitive to timing errors. The nominal 1µsresolution of UNIX timestamps is acceptablewhen measuring 120 µs gaps between 1500Bpackets on 100 Mb/s links but insufficient toquantify packet inter arrival time (IAT) variationsof 12 µs gaps on GigE links.The research community is developing a set ofmetrics and techniques for active bandwidthmeasurement. Many of them are well understoodand can provide accurate estimates under certainconditions.Also, some partial measurement and evaluationstudies of bandwidth estimation tools have beenpublished but my attention has been drawn to thelack of publicly available comprehensive andcomparative experimental results.As we performed test over PRTG andOAUNETMON, comparative analysis procedureswere being developed. Among these, a number of–429–Volume 10. Number 2. November 2009 (Fall)
generic criteria were highlighted. These criteriahave been classified into two groups: a first set ofcriteria specified as simple numerical and scalarmetrics that provide a partial comparison of toolsperformance, a second set of criteria that providecomparative evaluation of tools performance.The first set includes metrics that can be useful toquickly choose or discard some techniques andtools according to simple constraints such asrequired time or allowed probe bandwidth, someof these metrics are the following:¾¾¾¾¾Total probe traffic generated;Maximum attainable accuracy;Total estimation time;Traffic IN;Traffic OUT.The second set of criteria for comparativeanalysis between different techniques includesbut is not limited to the following:¾Accuracy: maximum accuracy for a fixedtime, maximum accuracy for a limitedamount of probe traffic, dependency ofaccuracy on estimation time, anddependency of accuracy on probe trafficvolume.¾Consistency of estimates¾Efficiency: required network load for agiven accuracy, and required networkload for a given estimation time.¾Estimation time: required time for a givenaccuracy.¾Dependency of accuracy, efficiency andestimation time on overall network loadas well as overall machine (both senderand receiver) load.PRTG and OAUNETMON monitor network andbandwidth usage as well as various other networkparameters like memory and CPU usages,providing system administrators with live readingsand periodical usage trends to optimize theefficiency, layout, and setup of leased lines,routers, firewalls, servers, and other networkcomponents.This project provides a comparative study of twoAvailable Bandwidth (ABw) techniques (PRTGand OAUNETMON) taking into account theThe Pacific Journal of Science and tatistical conditions of the ABw, severalimprovement of OAUNETMON in terms ofaccuracy and efficiency, and a performanceevaluation of OAUNETMON under a DiffServenvironment.The same study was carried out for PRTG andthe results obtained were compared withOAUNETMON and recommendations were madeonly to know which among the two to choosewhen a bandwidth is to be measured in order toobtain accurate, reliable and up-to-date results.RESEARCH JUSTIFICATIONThe following are the contributions of thisresearch work in particular:¾A well understood bandwidth analysiscould be used to build multicast routingtrees more efficiently and dynamically.Ideally, multicast routing trees would bebuilt so that packets travel along a treethat minimizes duplicate packets andlatency while maximizing bandwidth;¾To provide proactive problem detection,efficient troubleshooting and rapidproblem solution concerning bandwidthespecially when there is the need toimprove on the low bandwidth of anetwork;¾To determine which among the tools isgood for bandwidth measurement with amean of getting detail results in terms ofaccuracy, reliability, intrusiveness andgood response time;¾To quickly and easily set up and run amonitoring station for networks. With justa few mouse clicks a person can log theamount of data flowing through routersand leased line, monitors CPU utilization,analyze the traffic by type, or check diskspace utilization;¾To monitor the bandwidth usage ofleased lines, routers, and firewalls viaSNMP, packet sniffing, or NetFlow;¾To be able to obtain a graphical overviewas well as detail statistics of networkusage;–430–Volume 10. Number 2. November 2009 (Fall)
¾To have opportunity of storing andanalyzing traffic in a switched networksuch as Fast Ethernet and GigabitEthernet.RESEARCH AIM AND OBJECTIVESThe aim of this project work is to carry out aresearch work on the measurement ofcomparative evaluation of available bandwidthestimation tools in a campus Wide Area Network(PRTG and OAUNETMON).The objectives of this research work include thefollowing:¾¾To ease the deployment of platforms thattakes the advantage of the huge amountof available experimental resources toprovide a solid experimental basis forresearch on active bandwidth estimation.Assess to what extend current bandwidthestimation tools can be used as basis forproviding a bandwidth estimation servicefor applications as well as networksoperation.FastEthernet links. The network built for tests,comprise sender and receiver hosts, belonging todifferent LANs on which several cross-trafficsources are active.The used hosts are equipped with Debian Linuxand have the same hardware configuration. Acouple of hosts are used as the sender and thereceiver part of the measurement tool, while theother hosts are used as the source and thedestination for the cross-traffic. The choice of anisolated network is motivated by the need tototally control the network under test.The methodology adopted so far include thefollowing:¾An extensive review of relevant andrelated literatures on previous work doneinprojectscomparingbandwidthmeasuring tools;¾Running of the two bandwidth measuringtools on the same network with equalnumber of system;¾Implementation of these measuring tools(OAUNETMON and PRTG) on the sameoperating system;¾Conducting two series of reproduciblelaboratory test in a fully controlledenvironment using two different sourcesof cross-traffic;¾To give aggregate, detailed overviewabout the traffic patterns on the networkof each tool and to recommend the onethat is more acceptable in terms ofintrusiveness, reliable and e analysis in terms ofaccuracy, intrusiveness and responsetime of active probing tools.Experimenting on high-speed paths inreal networks where I had a completeknowledge of link capacities and hadaccesstoSNMPcountersforindependent cross-traffic verification;¾Know the challenges facing a lowbandwidth network and to probablyproffer suggestions on how best tomanage such to give a betterperformance.Obtaining the final results for both theOAUNETMON and PRTG after aconsistent and reliable period to avoiddoubt in the statistical value andgraphical interpretation values obtained;¾Comparing the accuracy and otheroperational characteristics of the tools,and analyze factors impacting theirperformance;¾Then, based on the data collected fromthe above studies, recommendations andsuggestion on improving the performanceof the bandwidth networks will also bemade.¾RESEARCH METHODOLOGYTo compare the performance of the measurementtools studied; OAUNETMON and PRTG, a set ofexperiments were carried out on an isolatednetwork that comprises three Cisco 1700 seriesrouters that is SNMP enabled connected throughThe Pacific Journal of Science and ��431–Volume 10. Number 2. November 2009 (Fall)
Our research takes one step further the ailablebandwidthestimation. First, I conducted two series ofreproducible laboratory tests in a fully controlledenvironment using two different sources of crosstraffic. Second, I experimented on high-speedpaths in real networks where there is a completeknowledge of link capacities and had access toSNMP counters for independent cross trafficverification. Finally, I compare the accuracy andother operational characteristics of the tools, andanalyze factors impacting their performance.OVERVIEW OF PRTG - PAESSLER ROUTERTRAFFIC GRAPHERPRTG Traffic Grapher is an easy to use Windowsapplication for monitoring and rators with live readings and long-termusage trends for their network devices. PRTG ismainly used for bandwidth usage monitoring, butmay also be used to monitor many other aspectsof a network such as memory and CPU utilization.With PRTG Traffic Grapher the user receivescomprehensive bandwidth and network usagedata that helps to optimize the efficiency of thenetwork. Understanding bandwidth and resourceconsumption is the key to better networkmanagement: Avoid bandwidth and serverperformance bottlenecks; Find out whatapplications or what servers use up yourbandwidth; Deliver better quality of service to yourusers by being proactive; Reduce costs by buyingbandwidth and hardware according to actual load.The Freeware Edition of PRTG Traffic Grapher iscompletely free for personal and commercial useand may be downloaded for free. PRTG TrafficGrapher is designed to run on a Windowsmachine in your network for 24 hours every day,and constantly records the network usageparameters. The recorded data is stored in aninternal database for later reference. Using aneasy to use Windows interface you can configurethe monitored sensors as well as create usagereports. For remote access PRTG Traffic Graphercomes with a built-in web server to provideaccess to graphs and tables.All common methods for network usage dataacquisition are supported: SNMP: SimpleNetwork Management Protocol is the basicThe Pacific Journal of Science and ethod of gathering bandwidth and networkusage data. It can be used to monitor bandwidthusage of routers and switches port-by-port as wellas device readings like memory, CPU load etc.Packet Sniffing: With its built-in Packet SnifferPRTG can inspect all network data packetspassing the network card to calculate thebandwidth usage. NetFlow: The NetFlow protocolis supported by most Cisco routers to measurebandwidth usage.How to Choose a Method of Data Acquisition:There are four methods of Data Acquisition whenusing PRTG for measuring bandwidth. They are:¾¾¾¾SNMP Monitoring;Packet Sniffing;Netflow Monitoring;Latency Monitoring.PRTG Network Monitor System Architecture:PRTG Network Monitor consists of three mainparts:PRTG Core Server: The central part of a PRTGinstallation is the “Core Server” that includes datastorage, web server, report engine andnotification system. PRTG Probe: A “Probe” performs theactual monitoring. It receives itsconfiguration from the Core Server, runsthe monitoring processes and deliversmonitoring results back to the CoreServer. A Core Server can manage anunlimited number of Probes in order toachieve multi location monitoring. PRTG Web Interface: The user interfaceis completely web-based. The usersaccess the configuration and monitoringresults using a standard web browser.Core and probe are Windows services which arerun by the Windows system without therequirement for a user to be logged in.The monitoring system runs on the Linuxoperating system. Monitoring was done usingopen source IPTraf software. A wrapper scriptwas used to start the IPTrafprogram with suitablecommand line arguments to sort the output ofIPTraf based on IP address and protocol and itcreates suitable inputs for PRTG and Webaliser.–432–Volume 10. Number 2. November 2009 (Fall)
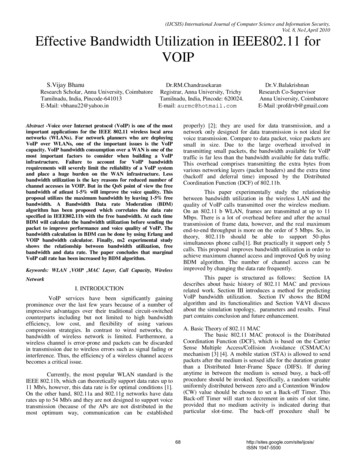
After starting up IPTraf and initializing somevariables, the wrapper script is responsible forprocessing the summary information from IPTrafinto suitable log formats both for PRTG andWebaliser. The software aims at doing theprocessing very fast and as such it is notcomplicated. In order to maintain system stabilityand minimize memory leaks, the software restartsevery 24 hours. Other script used are run prtg,prtg reader, run webaliser and webaliser caller.For each of the tools there is a correspondingvalue for the following:i.bandwidth Traffickbit/second);IN(kbyteandii.Bandwidth Traffickbit/second);OUT(kbyteandiii.Sum of Bandwidth Traffic INBandwidth Traffic OUT (kbytekbit/second);andandiv.Coverage (%);v.Total volume for parameters from i-ivabove;vi.The Average for parameters from i-ivabove.OAUNETMON OVERVIEWThe developed non intrusive traffic monitoringand analysis system (OAUNETMON) is differentfrom similar tools because it is non intrusive. Ituses open source software and has the capabilityto show traffic information on Global, host andprotocol basis. It can keep historical informationabout network usage. It can also give a graphicaloverview as well as a detailed statistics. It has theability to monitor and analyze traffic in a switchednetwork such as Fast Ethernet and GigabitEthernet. Apart from monitoring and analyzingnetwork traffic, OAUNETMON can also carry outproxy log analysis using Webalizer.The Obafemi Awolowo University NetworkMonitoring (OAUNETMON) Experiment wasconducted with the aim of monitoring live networkwithout adversely imparting on the performanceand also to identify and monitor traffic patterns(both speed and volume) on the basis of host (IPaddress), protocol and time of the day.For this experiment, open source software wasused for the reason of ease modification and cost.On a high-speed network, the system may not beable to handle all packets in time. If theprocessing speed or the system itself operates atspeed insufficient to capture all packets, theanalysis result is unreliable.The project was to set up a single monitoringstation that will monitor all the traffic. The figurebelow shows the architecture of OAUNETMON asit was used to monitor the traffic on the Universityof Ibadan Network.Each of the above parameters are properlyobserved and studied into detail for each of thetools and conclusions were drawn from theircharacteristics.It is important to note that all the hardwarerequirements for both tools were the same inorder to obtain dependable and consistent resultson the same network.For OAUNETMON the results were obtained atevery five (5) minutes interval for a complete day.But for PRTG, the results obtained indicate adaily values for each of the parameters statedabove.Hence, the Totals for 10-June-08 from 9:30 PM to11-June-08 till 9:30 PM indicate a daily averageas it was obtained for PRTG which is on dailybasis. The values obtained for each of the toolswere used to determine the bandwidthrequirements for the network.RESULTS OBTAINEDThe discussion on the results obtained from theseexperimental works was analyzed under thefollowing criteria:RESULTS AND DISCUSSIONi.The Network Coverage characteristics ofeach of the tools;The results obtained for both the PRTG andOAUNETMON are presented in the tables below.ii.Daily results characteristics;The Pacific Journal of Science and ��433–Volume 10. Number 2. November 2009 (Fall)
Figure 1: Design Architecture of PRTG.iii.Speed required for implementing each ofthe tools;iv.Speed required in generating the output;v.Code size andvi.Bandwidth requirement for the networkthe tools analyzed.The Network Coverage: The network coveragevalue tells whether the monitoring was on all thetime and covered the complete time period.From the table above, the result shows thatOAUNETMON has nearly 100% networkcoverage unlike PRTG with poor networkcoveragecharacteristics.ThisfeatureThe Pacific Journal of Science and ndoubtedly shows efficiency and reliability inOAUNETMON which is a characteristic to rely onfor any bandwidth measuring tool in order toobtain accurate result.Daily Result Characteristics: The daily resultsobtained shows that PRTG did not give any resultfor few days. In OAUNETMON, this did not arise.For each of the day, the results were fully and therequired data were recorded. Daily ResultCharacteristics indicates that OAUNETMON isstill far better in relying on the precision of theresult unlike PRTG which omitted some results inmost of its daily readings.Speed Required for Implementing the Tools:When both PRTG and OAUNETMON were bothimplemented on the network, it was clearly–434–Volume 10. Number 2. November 2009 (Fall)
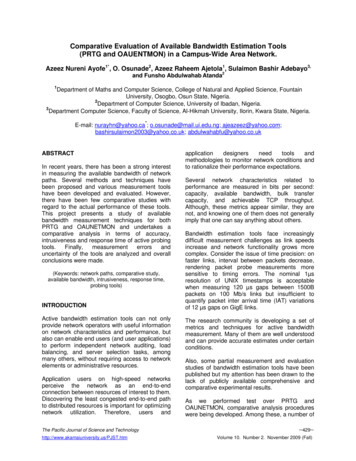
Figure 2: Design Architecture of OAUNETMON.observed and noticed that OAUNETMON runsfaster; two times the time required by PRTG to beimplemented on the same network.Speed Required in Generating the Output: Ofcourse, when the speed used by a particular toolis faster than the other, what this mean invariablyis that the time when the output will be generatedshall definitely be different. OAUNETMON takesthe opportunity of having a better running time togenerate its result in a better time than PRTG. Itwas noticed that 3 minutes after OAUNETMONwould have started generating its results thatPRGT will just begin displaying its result on thesame network.Code Size: PRTG has a better advantage overOAUNETMON in this regard. The size of coderequired for implementation on the network forThe Pacific Journal of Sc
The Freeware Edition of PRTG Traffic Grapher is completely free for personal and commercial use and may be downloaded for free. PRTG Traffic Grapher is designed to run on a Windows machine in your network for 24 hours every day, and constantly records the ne