Transcription
Axioma AXUS3MH-M United States Macroeconomic Equity Factor Risk ModelAxioma United States Macroeconomic Equity Factor RiskModelModel OverviewAs of 2013, the model covers over 8800 securities (over 18,700 historically)listed on various U.S. stock exchanges, including ADRs. The model alsocovers more than 250 ETFs and more than 300 EIF contracts, including allassets covered by the AXUS3 Fundamental and Statistical models.Model Variants (1)Medium-horizon model availableModel HistoryDaily history from January 1995 onwards.Forecast HorizonMedium-horizon model: 3-6 months.Estimation FrequencyFactor exposures, covariances, and asset specific risks estimated daily.DRAFTAsset CoverageModel FrameworkFactor ReturnsFactor CategoriesCore MacroeconomicMarket-TradedEquitySectorsExposure EstimationAxiomaMarket-Traded, Equity, and Sector returns are available on a daily basis andare computed directly from market prices or extracted from the AXUS3-MHfundamental model. Core Macro factor returns are estimated by means of aDynamic Factor Model with a small number of dynamic factors distilled fromeight years of 31 traditional economic time series released monthly as well asover one hundred daily time series from market data.These relate to traditional macroeconomic time-series. They reflect basic determinants of economic activity and market dynamics: economic growth, inflation, and consumer confidence.These are returns on commodities and currencies as well as changes in yieldspreads between various government and corporate US bonds.Returns on market and style factors derived from the AXUS3-MH fundamentalmodel.Returns on sector factors derived from aggregates of industry factors from theAXUS3-MH fundamental model.Time-series regression of four years of daily returns of each asset against Core,Market-Traded, and Equity Macroeconomic factor returns. Residuals are thenregressed against a second block of Sector returns. Asset exposures are nullfor sectors not containing that asset.1
Axioma AXUS3MH-M United States Macroeconomic Equity Factor Risk ModelFactor DescriptionsCore MacroeconomicEconomic GrowthEconomic Growth reflects expectations of year-over-year changes in Industrial Production. If the annual growth is currently expected to be 3%, thena 1% observed return reflects a change in the expected industrial productiongrowth from 3% to 4%.InflationInflation reflects the forecasted annualized inflation rate over the nextmonth as measured by the Core Consumer Price Index (Core CPI). If theinflation rate is currently expected to be 3%, then a 1% observed returnreflects a change in the expected inflation rate from 3% to 4%.ConfidenceConfidence reflects unexpected monthly changes in the Consumer Confidence Index after being rescaled so it varies between -10% and 10% withlong-run mean of zero. If the CCI is currently 3%, then a 1% observedreturn reflects an expected change in CCI from 3% to 4%.Market-TradedCommodityReturns on the GSCI R Non-energy spot price index.Returns on the front month futures price of West Texas Intermediate crudeoil in excess of the Commodity factor return.GoldReturns on the GSCI R Gold spot price index in excess of the return onthe Commodity factor.Credit SpreadA positive factor return represents a widening of the spread between theyields of BAA and AAA rated US corporate bonds. A 100 basis pointwidening of the spread corresponds to a factor return of 1% or 0.01.Term SpreadA positive factor return represents a widening of the spread between theyields of 10-year and 13-week US Treasuries with constant maturity. A 100basis point widening of the spread corresponds to a factor return of 1% or0.01.FX BasketUS Dollar return on the basket of currencies defined by the IMF SpecialDrawing Rights currency portfolio (XDR).DRAFTOilEquityEquity MarketThe AXUS3-MH Market return in excess of the component explained bythe Economic Growth factor.Equity SizeThe AXUS3-MH Size factor return.Equity ValueThe AXUS3-MH Value factor return.Sectors (10)AxiomaReturns on market-capital weighted aggregates of AXUS3-MH Industryfactor returns. The sectors are defined by the GICS R sector classification.The industry returns can be interpreted as an excess return relative to themarket and style factors.2
Axioma AXUS3MH-M United States Macroeconomic Equity Factor Risk ModelFactor Volatilities / CovariancesEstimationCovariance of exponentially-weighted daily factor returns.Half-life ParametersMedium-horizon model: 125 days for variances, 250 days for correlations.AutocorrelationNewey-West adjustment accounting for 2 days of autocorrelation.AdjustmentsAxioma’s proprietary Dynamic Volatility Adjustment (DVA) procedure isused to analyze trends in factor returns dispersion and adjust risk estimation accordingly, to allow for heightened responsiveness in risk forecastsand adaptability to the prevailing volatility regime.Specific RisksVariance of exponentially-weighted daily specific returnsHistoryMedium-horizon model: 250 days.Half-life ParameterMedium-horizon model: 125 days.AutocorrelationNewey-West adjustment accounting for 1 day of autocorrelation.Other AdjustmentsIssuer Specific Covariance (ISC) captures covariances between security linesof the same issuer, using a cointegration model of price behavior. Appliesonly to portfolios containing two or more securities from the same issuer.DRAFTEstimationData DeliverablesAvailabilityUpdated daily and downloadable via FTP/HTTPS.Historical CoverageDaily history from January 1995 onwards.Data FormatDelimited text file (“flatfiles”) or proprietary database format for seamlessintegration into Axioma Portfolio and Axioma Backtester.BenchmarksLocal market benchmarks are available in a format compatible with Axiomasoftware products.Exchange Traded Funds(ETFs)Broad coverage of ETFs and index linked ETFs. ETF coverage for themodel is determined by the model’s full coverage of the underlying constituents in order to ensure consistency in the instruments risk and exposuremeasures.Equity(EIFs)Broad coverage of EIF contracts with daily history as far back as January2008. Risk characteristics for EIFs are inherited from underlying indices,or ETF proxies when indices are unavailable.IndexAsset IdentifiersAxiomaFuturesAxioma ID, 7-digit SEDOL, 9-digit CUSIP, ISIN, local ticker, and securityname.3
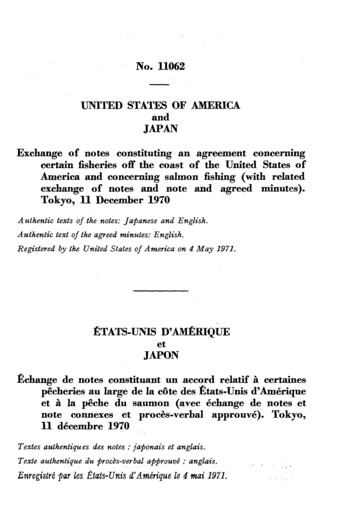
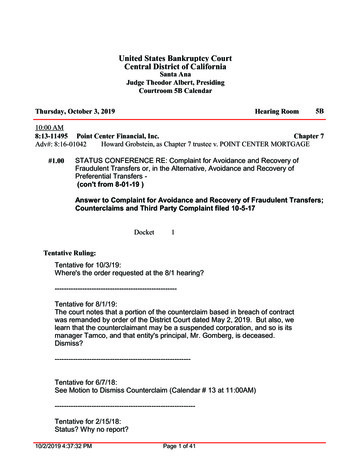
Axioma AXUS3MH-M United States Macroeconomic Equity Factor Risk ModelAppendix: Factor 0092010201120122013Gold200%Economic Growth-10%OilInflation-20%FX 620072008200920102011201220134%120%3%100%Equity Market80%2%Credit SpreadEquity SizeEquity ValueTerm 0%(a) Macroeconomic Core and Equity factors(b) Market-traded factorsFigure 1: Cumulative returns to each of the AXUS3-MH-M factors.Axioma4
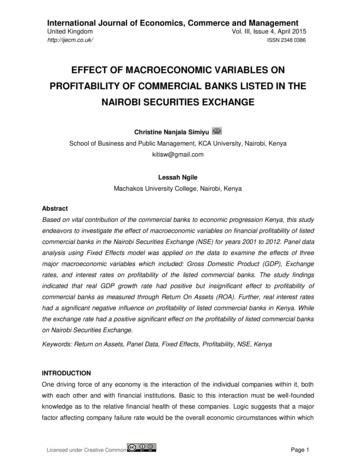
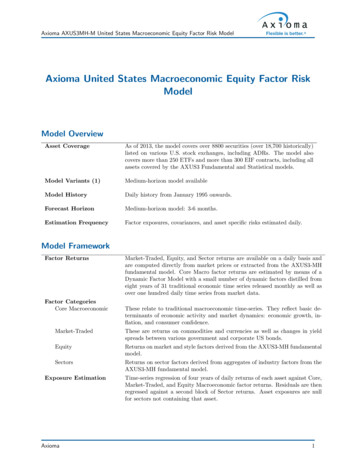
Axioma AXUS3MH-M United States Macroeconomic Equity Factor Risk ure 2: Total Risk Bias statistics for selected benchmark portfolios, 2005-2012. The dashed lines representthe bounds of the 95% confidence interval at 0.89 and 1.11. Bias stats beyond these lines are significantlydifferent from 1.00.Axioma5
United States and Canada: 212-991-4500Europe: 44 20 7856 2451Asia: 852-8203-2790New York OfficeAxioma, Inc.17 State StreetSuite 2700New York, NY 10004Atlanta OfficeAxioma, Inc.400 Northridge RoadSuite 850Atlanta, GA 30350Phone: 212-991-4500Fax: 212-991-4539Phone: 678-672-5400Fax: 678-672-5401Phone: 415-614-4170Fax: 415-614-4169London OfficeAxioma, (UK) Ltd.St Clements House27 Clements LaneLondon EC4N 7AEHong Kong OfficeAxioma, (HK) Ltd.Unit B, 17/F30 Queen’s Road CentralHong KongSingapore OfficeAxioma, (Asia) Pte Ltd.30 Raffles Place#23-00 Chevron HouseSingapore 048622Phone: 44 (0) 20 7856 2451Fax: 44 (0) 20 3874 9379Phone: 852-8203-2790Fax: 852-8203-2774Phone: 65 6233 6835Fax: 65 6233 6891DRAFTSan Francisco OfficeAxioma, Inc.201 Mission StreetSuite #2150San Francisco, CA 94105Geneva OfficeAxioma CHRue du Rhone 69, 2nd Floor1207 Geneva, SwitzerlandPhone: 41 22 700 83 00Sales: sales@axioma.comClient Support: support@axioma.comCareers: careers@axioma.com
Axioma AXUS3MH-M United States Macroeconomic Equity Factor Risk Model Axioma United States Macroeconomic Equity Factor Risk Model Model Overview Asset Coverage As of 2013, the model covers over 8800 securities (over 18,700 historically) listed on various U.S. stock e