Transcription
WHITE PAPERMonitoringMicroservices onKubernetes
WHITE PAPERAccording to the latest bi-annual survey from CNCF,monitoring is one of the top challenges for organizationsadopting Kubernetes.This White Paper provides insights into how to best monitor both Kubernetes clusters and microservices deployedon Kubernetes in order to pinpoint performance issues, minimizing mean time-to-resolution (MTTR).Managing performance issues in real-time is a controllable way to enable a flawless end-user experience. Enterprisesneed to develop best practices for operating Kubernetes clusters as well as for understanding performance acrossthe entire stack, including distributed traces across all microservices.The Brain Behind the Orchestration of Containerized ApplicationsKubernetes is a leading container orchestration solution for deploying containerized applications. Enterprises acrossevery industry are adopting containerized microservices in order to gain: Speed — to accelerate the pace of innovation Scale — to deliver optimized application experiences across different geographies and cloud providers Efficiency — to provide more value at a lower cost by optimizing resource consumptionKubernetes has several logical layers to support various use cases and manage the lifecycleof containerized microservices.There are three foundational pillars of the Kubernetes deployment philosophyInfrastructure AbstractionDeclarative ConfigurationImmutabilityApplication orchestration from theKubernetes continuously monitors theContinuing the immutability requirementsinfrastructure resources such as computestate of the applications deployed andset forth by Docker where containerservers, storage volumes, and networksKubernetes objects; It also implements theimages are immutable, Kubernetes objectsdesired state of the system as expressed byare also immutable e.g. different versionsthe operators such as how many replicasof Kubernetes Services are completelyof a service should be runningseparate and are not interchangeableMonitoring Microservices on Kubernetes1
WHITE PAPERWhy Use Kubernetes?In addition to the benefits that containerization provides for application developers, Kubernetes makes the life ofoperations easier in many different ways:Automated Application LifecycleManagementCloud InteroperabilitySelf-Healing SystemKubernetes automates applicationKubernetes provides abstraction over theKubernetes guards applications againstlifecycle management as an end-to-endinfrastructure so that applications becomeany failures or unreliable behavior thatsolution including application provisioning,truly portable across different cloudsdestabilizes the system. It continuouslyautoscaling, and replication managementtakes actions to ensure the state ofas well as CI/CDthe system conforms to the desired state,as expressed in the ctDifferenceKubernetes Controller Manager continuously compares the desired state with the actual state, evaluatesthe differences between them, and reconciles the differences by taking appropriate actions.Monitoring Microservices on Kubernetes2
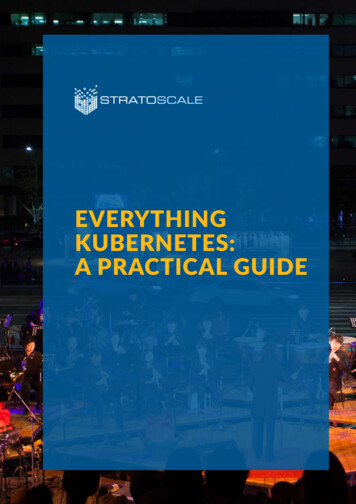
WHITE PAPERUnderstanding Kubernetes ComponentsKubernetes is a system that assembles a group of machines into a single unit that can be consumed via an API.Kubernetes further segments the compute resources into two groups:Worker Nodes and Master NodesMaster NodeController ManagerSchedulerAPI orker NodeSmartAgentDaemonSetKubeletKube-ProxyPODWorker NodeMonitoring Microservices on Kubernetes3
WHITE PAPERHere are the main components running on master and worker nodes:Master NodesWorker NodesAPI ServerKubelet — Agent On Every Worker Gateway to the Kubernetes cluster Initiates pods (a group of one or more containers) usingPodSpec and ensures all pods are running and healthy Mediates all the requests from clients and API objects storedin etcd Interacts with containers — e.g. Docker Performs authentication and role-based access control RBAC More: http://bit.ly/k8s-kubelet Requests validation and admission controlKube Proxy — Agent On Every Worker More information: http://bit.ly/k8s-apiserver Network proxy and load balancer for Kubernetes Services More: http://bit.ly/k8s-proxyControl Manager Daemon process that implements the control loops built intoKubernetes — rolling deployments, replica sets, number ofworker nodes, etc. More information: http://bit.ly/k8s-ctrl-mgrScheduler Decides where pods should run based on multiple factors —affinity, available resources, labels, QoS, etc. More: http://bit.ly/k8s-scheduleretcd Heart of the Kubernetes cluster; persists key-value informationon all Kubernetes objectsMore: http://bit.ly/2COkMx9These are the Kubernetes add-ons that are required for the most applications:kube-dnskubectl Provisioned as a pod and a service on Kubernetes The official command line for Kubernetes Every service gets a DNS entry in Kubernetes Behind the scenes uses REST-based API calls to KubernetesAPI server kube-dns resolves DNS of all services in the clusterMonitoring Microservices on Kubernetes4
WHITE PAPERKey Kubernetes Constructs and Objects:NamespacesPodsVirtual segmentation of single clustersA logical grouping of one or more containers that are managedby KubernetesNodesReplicasetInfrastructure fabric of Kubernetes (host of worker and mastercomponents)Continuous loop that ensures given number of pods are runningRolesIngressesRole-based access controls for Kubernetes clusterManages external HTTP traffic to hosted serviceDeploymentsServicesManages a ReplicaSet, pod definitions, updatesand other conceptsA logical layer that provides IP, DNS, etc. persistenceto dynamic podsMonitoring Challenges in Kubernetes EnvironmentsAccording to the latest survey from CNCF, complexity, monitoring, and security are amongst the top challenges fororganizations adopting Kubernetes. Monitoring strategies of yore do not work in the cloud-native era primarily because: There are many more components to monitor Containers are ephemeral and dynamic Kubernetes automatically schedules pods based on the best resource utilization. While it does increaseefficiency, it also adds unpredictability on where the pods get deployed and run unless specific intentis expressed using affinity or taintsThis results in the following set of conditions for Kubernetes environments: There are many more components to monitor Containers are ephemeral and have unpredictable pod placement Containerized microservices are more complex to troubleshootMonitoring Microservices on Kubernetes5
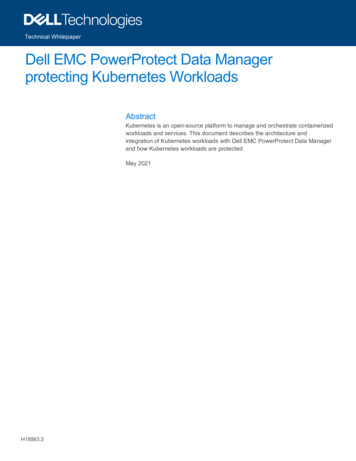
WHITE PAPERMore Components to MonitorIn the monolithic world, there are only two components to monitor — applications and the hosts on which theapplications were deployed.In the cloud-native world, containerized applications orchestrated by Kubernetes have multiple components thatrequire monitoring: Hosts The Kubernetes platform itself Docker containers Containerized MicroservicesMicroservicesDocker ContainersKubernetes PlatformHost-Bare-Metal or Virtual MachinesContainer Ephemerality and Unpredictable PlacementUnlike the traditional long-running host model, modern microservices-based applications are typically deployedon containers that are dynamic and ephemeral. Kubernetes makes sure the desired number of application replicasare running. Kubernetes will place the pods on the nodes that it deems fit unless specifically instructed not to doso via node affinity or taints. In fact, letting Kubernetes schedule pods is the key design goal for this selfadjusting system.Traditional monitoring approaches do not work in these highly dynamic environments because they tend to followlong-running hosts by using hostnames or IP addresses. For containerized environments, monitoring tools must provideimmediate service discovery and automatically detect the lifecycle events of containers, while also adjusting metriccollection when containers are spun up or restarted in seconds.Monitoring Microservices on Kubernetes6
WHITE PAPERMonitoring the Performance of MicroservicesPinpointing issues in a microservices environment is more challenging than with a monolithic one, as requests traverseboth between different layers of the stack and across multiple services. Modern monitoring tools must monitor theseinterrelated layers while also efficiently correlating application and infrastructure behavior to streamlinetroubleshooting.Key Performance Metrics to MonitorPOD MetricsIt’s essential to monitor all Kubernetes objects in order to ensure each cluster is healthy and resource utilization isoptimized. Monitoring Kubernetes pod metrics as well as Deployments and Services will help determine whetherKubernetes is working as intended in your environment.Number of Desired PodsNumber of Available PodsPods by Phase (failed, pending, running)PODSDesired Pods per DeploymentDesired Pods per ServiceAvailable Pods by DeploymentAvailable Pods by ServicePods Desired by ReplicaSetRunning Pods Per NodeResource Utilization MetricsIt’s important to also keep track of resource utilization to ensure that your applications and Kubernetes clustersremain healthy. Docker Socket provides container metrics and node-level resource utilization metrics, such as CPU and memoryusage. Kubernetes provides collectd metrics as well as metrics emitted by Kubernetes. Correlating CPU, memory, Disk IO, and network performance metrics with application performance and Kubernetesevents help to get to the root cause of a performance issue quicker. Monitoring Docker and Kubernetes events, such as container or pod lifecycle events, helps to pinpointmisconfigurations or resource starvation.Monitoring Microservices on Kubernetes7
WHITE PAPERMonitoring Kubernetes with SplunkKubernetes provides detailed information about its components and application resource usage at the cluster, pod,and service level that can easily be collected by a vast array of monitoring solutions, but the task of making this dataactionable is left to end users.Splunk enables you to monitor Kubernetes with flexible, open instrumentation and pre-built dashboards that provideimmediate visibility into the various layers of their environment. By combining streaming analytics with distributedtracing, Splunk users can go beyond basic data collection — leveraging real-time alerting and performance analysisto find and resolve issues in seconds.Collect Metrics from a Cloud ProviderFor basic monitoring of a managed Kubernetes service like AWS Elastic Container Service for Kubernetes (EKS), GoogleContainer Engine (GKE), and Azure Kubernetes Service, the simplest way to collect metrics is by integrating Splunkwith services such as AWS CloudWatch, Google Stackdriver, and Azure Monitor.This approach is the most straightforward, and enables Splunk to collect Kubernetes metrics without having toinstall an agent or modify application code. However, these services are configured by default to aggregate and reportmetrics at relatively infrequent intervals (AWS CloudWatch updates every 5 minutes by default) and do not provideinsight into the specific services deployed on your Kubernetes clusters.Fully Automated Kubernetes MonitoringFor greater insight into services and finer-grained monitoring of container metrics, we recommend installing theSmart Agent throughout your Kubernetes clusters.An open-source metrics collection agent built on top of collectd, the Smart Agent provides automatic servicediscovery and configuration for monitoring content. One advantage with this approach is the Smart Agent’s ability tosubmit metrics to Splunk at 1-second resolution, making it especially well-suited for the ephemeral nature ofKubernetes pods.The Smart Agent runs as a DaemonSet in Kubernetes to ensure that it is installed on every node in the cluster. It collectsdata from Kubernetes and uses cAdvisor to get resource and performance characteristics from running Dockercontainers. Zero-touch configuration with automatic discovery of Kubernetes components and containerized servicesinstantly monitors the entire stack. The Smart Agent is installed with one simple step:helm install splunk --set splunkAccessToken YOUR ACCESS TOKEN --setclusterName YOUR CLUSTER NAME splunk/splunk-agentMonitoring Microservices on Kubernetes8
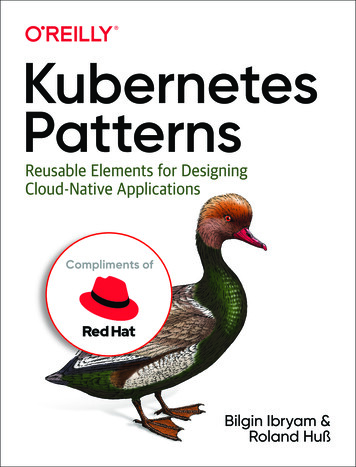
WHITE PAPERNot only can the Smart Agent monitor upstream Kubernetes, it is also capable of collecting metrics from managedKubernetes services like AWS Elastic Container Service for Kubernetes (EKS) and Google Container Engine (GKE),as well as platforms like Openshift and Pivotal Kubernetes Service (PKS).The Smart Agent also provides monitors that can collect data from other metrics protocols like Prometheusand StatsD, so that teams with existing metrics pipelines can easily take advantage of Splunk.Navigating Through Your Kubernetes EnvironmentPre-Built Kubernetes DashboardsStarting with the bird’s eye view, Kubernetes Navigator enables teams to quickly understand the performance ofthe entire Kubernetes environment with intuitive and hierarchical navigation. Select, filter, or search for any Kubernetesentity and drill-down for detailed analysis, e.g., node, pod, and container level within seconds. Understand relationshipsbetween dynamic Kubernetes components and quickly fix interdependent performance issues arising fromnoisy neighbors.Drilling down to an individual node will display system metrics for that particularnode, as well as dashboards for the specific services running on that node.Monitoring Microservices on Kubernetes9
WHITE PAPERYou can also view all of the pods running in your Kubernetes cluster, and trackactivity across a particular pod or across all the pods in your cluster. From here,it’s possible to drill down to individual Docker containers in each pod.Kubernetes AnalyzerAI-driven analytics automatically surfaces insights and recommendations to precisely answer, in real-time, whatis causing anomalies across the entire Kubernetes cluster — nodes, containers, and workloads. Sophisticatedalgorithms, including Historical Performance Baselines and Sudden Change, detect system-level issues such as asudden increase in Goroutines or container restarts and alert within seconds.Monitoring Microservices on Kubernetes10
WHITE PAPERLogs in ContextSeamlessly pivot to logs and get granular visibility into application, Kubernetes, and container logs to correlateperformance across the entire stack without any context switching. Visibility into lifecycle events of Kubernetesand API Server Audit logs help you understand and maintain your security and compliance postures.Monitoring Microservices on Kubernetes11
WHITE PAPERCreating Custom Service DashboardsSplunk lets you view container metrics alongside other performance indicators to provide visibility across everylayer of your environment. For example, a service owner who wants to monitor canary deployments might create thefollowing dashboard, with container metrics displayed next to charts measuring request latency and an event feedthat tracks code pushes, alerts, and any remediation actions are taken.Detect Problems in Real-TimeWith Splunk, setting up alerts doesn’t have to be a compromise between accuracy and timeliness. Proactively alerton issues by combining high-resolution metrics from your Kubernetes clusters with a library of statistical functionsand algorithms in Splunk. Preview alerts against historical data to tune them before deployment, and apply datascience to alerting to avoid the false positives and alert storms common in highly ephemeral environments.Monitoring Microservices on Kubernetes12
WHITE PAPERLeverage Distributed Tracing for Directed TroubleshootingSplunk APM provides users with distributed tracing capabilities to dig deep when a performance-impacting eventoccurs. No matter where an issue arises in your Kubernetes environment, you can navigate fromreal-time alerts directly to application traces and correlate performance trends between infrastructure, Kubernetes,and your microservices. Splunk APM is built on a NoSample Full-Fidelity architecture that ingests and analyzes alltraces so outliers and anomalies never go undetected.Outlier Analyzer provides directed troubleshooting by surfacing most commonly represented patterns in outliertraces enabling you to quickly narrow down to anomalous Kubernetes nodes, cluster, cloud region or applicationspecific labels or tags.Increase DevOps VelocityOnce data from Kubernetes is flowing into Splunk, DevOps teams can more easily leverage monitoring best practicesand solutions to common problems across the entire organization. Splunk provides out of the box, instant visibility intohosts, containers, pods, and Kubernetes objects with zero-touch, built-in dashboards, while also allowing teams tocustomize dashboards, alerts, and notifications for their specific needs.Central teams can deliver monitoring as code by using the Splunk API to programmatically create monitoringcontent and define analytics, and leverage Service Bureau to control usage, access, and editing permissions forusers and teams.curl \ --request post \ --header “x-sf-token: your accesstoken” \ --header “content-type: application/json” \ --data \‘{“name”: “cpu load”, “programtext”: “data(‘cpu.load’).publish()”}’ \ https://api.splunk.com/v2/chartMonitoring Microservices on Kubernetes13
WHITE PAPERSplunk is Trusted by Leading OrganizationsEnterprises from every industry and across the globe are leveraging Splunk to accelerate their journey to cloud-nativeand adopt Kubernetes in their organizations with confidence. Following is a list of just a few customers.More information: https://www.splunk.com/en us/customers.htmlGet Started Today with Splunk Infrastructure MonitoringReady to learn how Splunk can accelerate Kubernetes adoption in your organization?Our customer success managers and solutions engineers will work with your teams to accelerate your Kubernetes adoption,and to monitor Kubernetes in real-time. Get started with a 14-day free trial: https://www.observability.splunk.comSign up for a free trialGet StartedDeploy Smart AgentStart monitoring KubernetesenvironmentsLearn MoreLearn MoreTo learn more about Kubernetes Navigator for real-time monitoring and troubleshooting Kubernetes environments, at any scale,download the free Kubernetes Navigator Data Sheet.Learn more: www.splunk.com/asksalesSplunk, Splunk , Data-to-Everything, D2E and Turn Data Into Doing are trademarks and registered trademarks of Splunk Inc. in the United States andother countries. All other brand names, product names or trademarks belong to their respective owners. 2020 Splunk Inc. All rights reserved.www.splunk.com20-15997-Monitoring Microservices on Kubernetes-WP-113
Containerized Microservices Container Ephemerality and Unpredictable Placement Unlike the traditional long-running host model, modern microservices-based applications are typically deployed on containers that are dynamic and ephemeral. Kubernetes makes sur