Transcription
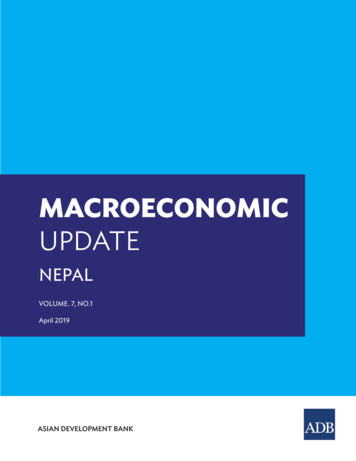
Macroeconomic Update iMACROECONOMICUPDATENEPALVOLUME. 7, NO.1April 2019
MACROECONOMICUPDATENEPALVOLUME. 7, NO. 1April 2019
iv Macroeconomic Update@2019 Asian Development Bank, Nepal Resident MissionAll rights reserved. No part of this publication may be reproduced, stored in a retrieval system, or transmitted,in any form or by any means, without the prior written permission of the Asian Development Bank (ADB). ADBdoes not guarantee the accuracy of the data included in this publication and accepts no responsibility for anyconsequences of their use.This issue of the Nepal Resident Mission (NRM) Macroeconomic Update was prepared by the following teamwith overall guidance from Mukhtor Khamudkhanov, Country Director, NRM and Sharad Bhandari, PrincipalEconomist, NRM. Lei Lei Song, Regional Economic Advisor, South Asia Department (SARD); Tadateru Hayashi,Principal Economist, Regional Cooperation and Operations Coordination Division (SARC); Masato Nakane,Senior Economist, SARC; and Anjan Panday, Senior Programs Officer, NRM reviewed the draft and providedcomments and suggestions.Manbar Singh Khadka, Economics Officer, NRM.Neelina Nakarmi, Economics Analyst, NRM.Supported by:Malika KC (Thapa), Operations Assistant, NRMThe views expressed in the Macroeconomic Update are those of the authors and do not necessarily reflect theviews of the ADB, or its Board of Directors, or its member governments.Asian Development BankNepal Resident MissionMetro Park Building, LazimpatPost Box 5017Kathmandu, NepalTel 977 1 4005120Fax 977 1 .com/adbnrm/
Macroeconomic Update vCONTENTSMACROECONOMIC UPDATEExecutive summaryEconomic performance in FY2018Economic prospects in FY2019 and FY2020Pagevii15ISSUE FOCUSProspects of trade in services in Nepal10BOXESBox 1: Importance of hospitality and tourism industryBox 2: ICT business – a success story of Deerwalk Nepal1418APPENDICESAppendix 1: Country Economic IndicatorsAppendix 2: Country Poverty and Social Indicators2324
vi Macroeconomic UpdateABBREVIATIONSBFI banks and financial institutionsBPO business process outsourcingFDI foreign direct investmentGATS General Agreement on Trade in ServicesGDP gross domestic productICT Information and Communication TechnologyIRC interest rate corridorIT information technologyNEPSE Nepal Stock ExchangeNRB Nepal Rastra BankNTIS Nepal Trade Integration StrategySNG sub-national governmentWTO World Trade Organizationy-o-y year-on-yearNOTEi.The fiscal year (FY) of the government ends in mid-July. FY before a calendar year denotes theyear in which the fiscal year ends, e.g., FY2018 ended on 16 July 2018.ii.In this report, “ ” refers to US dollars.
Macroeconomic Update viiExecutive Summary1.The economy is anticipated to grow by 6.2% in fiscal year (FY)2019,marginally down from 6.3% in FY2018. Normal monsoon is expected to boostpaddy production to 5.5 million tons, a rise of 8.4% from a year earlier. Productionof maize, the other important summer crop, is also projected to rise by 1.8%. Industrywill likely grow by 7.1% in FY2019 buoyed by increased availability of electricityand conducive socio-political environment. Enactment of Foreign Investmentand Technology Transfer Act 2019, Public-Private Partnership and InvestmentAct 2019 and amendment to Special Economic Zone Act 2016 will likely boostbusiness confidence, supporting the growth of foreign investment across industries.Construction has gained momentum in the fiscal year through mid-February2019 and will probably rise given the development needs in, and larger budgetallocation to, sub-national governments (SNGs) and the accelerated post-earthquakereconstruction. Services growth will edge up to 6.4%, supported by expansion ofwholesale and retail trade, hotel and restaurant, and financial intermediation.2.On the demand side, growth in public infrastructure spending andprivate investment as well as buoyant government expenses will drive growth inFY2019. Data to mid-February 2019 show that capital expenditure increased by6.7% over the year-earlier period. The spending of SNGs will also stimulate growthin FY2019. Private consumption will likely remain strong on the back of robustgrowth of remittance despite a fall in out-migration and the gradual appreciation ofNepali rupee vis-à-vis the US dollar.3.Gross domestic product (GDP) growth at 6.3% is envisaged for FY2020,assuming a normal monsoon and no untoward circumstances such as floodsdevastating crop production. The ongoing mechanization of agriculture, effortsto accelerate the implementation of large infrastructure projects, and the likelyimplementation of proposed legal reforms to promote investment will supportgrowth.4.Average annual inflation will edge up to 4.4% in FY2019 from 4.2% inFY2018. Inflation averaged 4.2% in the first 7 months of FY2019, above the 3.7%result in the year-earlier period. The increase in crop production, ease in the supplyof goods, availability of electricity, subdued oil prices and expectation of a modestrise of inflation in India will quell inflationary pressure in FY2019. Average annualinflation will stay moderate at 5.1% in FY2020, assuming a better harvest, stable oilprices and a modest rise of inflation in India.
viii Macroeconomic Update5.Data to mid-February 2019 show that trade deficit has surpassedthe net invisible earnings, widening the current account deficit to 1.5billion, slightly up from a deficit of 1.4 billion in the year earlierperiod. The rising current account deficit and weak financial inflowsled to an overall balance of payment deficit of 433.0 million in midFebruary 2019 higher than the deficit of 179.1 million in the year earlierperiod. The current account deficit is projected to widen further to 9.3%of GDP, up from 8.2% a year earlier because of increasing imports ofcapital and consumer goods and services irrespective of a healthy growthof remittance and modest oil prices. The current account deficit isexpected to narrow down to 8.1% of GDP in FY2020 as import growthrestrains following measures taken to curtail the import of non-priorityitems and an increased generation of hydroelectricity, partly offsetting theconsumption of fossil fuel. Remittances will continue to grow healthilythough falling substantially behind trade deficit expansion.6.Downside risks to outlook in FY2020 center on challenges tosmooth implementation of fiscal federalism. While some key legislationshave been enacted and the National Natural Resources and FiscalCommission constituted, the SNGs face challenges in terms of programand project development, project implementation, grant utilization andmaintaining fiscal discipline at large. Further, the recent buildup of creditto construction, overdraft and working capital in the absence of strongrisk management practices may induce financial sector vulnerabilities.7.This edition of Macroeconomic Update’s Issue Focus shedslight on the current state and prospects of Nepal’s services trade andsuggests sector-specific policy recommendations. Landlocked-nessand mountainous terrain have historically impeded the promotion ofmerchandise trade in Nepal. Lack of competitiveness has further heldback merchandise exports. Consequently, Nepal’s merchandise tradedeficit as a share of GDP has substantially ballooned over the years.Growth in services export, on the other hand, has been better than thegrowth in merchandise export. The services sector accounted for 66.0% oftotal exports and 13.0% of total imports in FY2018, indicating its growingimportance in external trade. But because of infrastructural, institutional,legal and procedural barriers, the services trade in Nepal has yet to achieveits full potential.
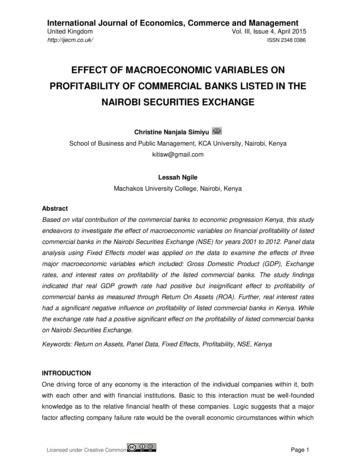
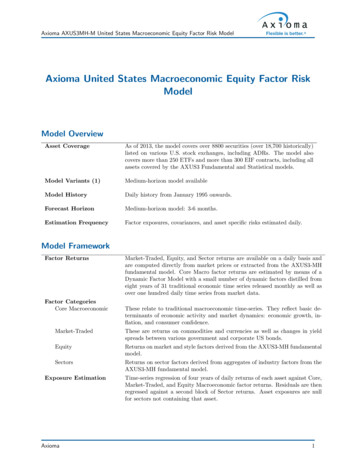
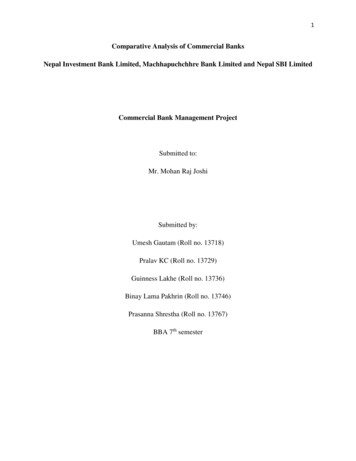
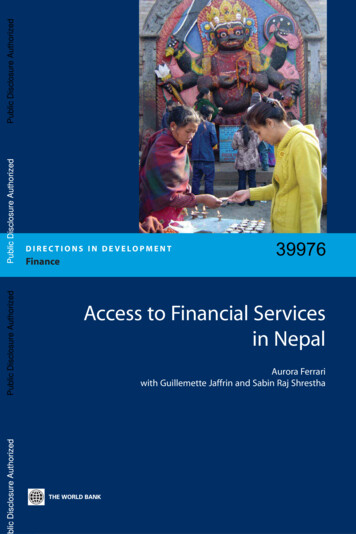
Macroeconomic Update 1MACROECONOMIC UPDATEA. Economic performance in FY20181.Gross domestic product (GDP) growth edged down to anestimated 6.3% in fiscal year 2018 (FY2018, ended 16 July 2018) from7.9% in fiscal year 2017 that accelerated from a low base (Figure 1).Floods of August 2017 crimped paddy production by 1.5% comparedto the previous year. Manufacturing grew by 8.0%, though down from9.7% a year earlier, on increased availability of electricity. Constructiongrew at a sustained pace with the sub-sector taking off at sub-nationallevels and the renewed acceleration of post-earthquake reconstruction.Several small sized hydropower projects commenced operation, raisingthe installed electricity capacity by 10.5% in FY2018 (Figure 2).Tourists’ arrival (Figure 3) increased favoring the expansion of hotelsand restaurants and travel and communication services as the economyrecovered from the 2015 earthquakes and the September 2015 –February 2016 trade and supply disruptions, further bolstered by theprospects of a more stable socio-political environment.Figure 1: Supply-side contributions to growthAgricultureIndustryServicesIndirect taxes less subsidesGross Domestic ProductPercentage 60FY2014FY2015-2Source: Central Bureau of Statistics; ADB estimates.FY2016FY2017ForecastSource: Central Bureau of Statistics. 2018. National Accounts of Nepal 2017/18 Š’. http://cbs.gov.np/ and staff estimates
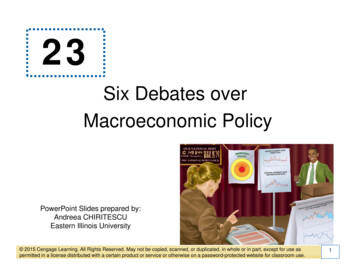
2 Macroeconomic UpdateFigure 2: Electricity demand and supply (MW)MW megawattSource: Nepal Electricity AuthorityFigure 3: Tourists’ arrivalTourists' arrivalIn '000y-o-y (% 30-400201320142015201620172018Source: Department of Tourism and Department of ImmigrationSource: Department of Tourism. 2017. Nepal Tourism Statistics 2017.2.On the demand side, high consumption, induced byremittance, dominated spending in FY2018. Fixed investment rose by15.7%, on higher private investment in manufacturing, energy andtourism, to account for nearly one-third of GDP. A strong growth inthe construction led to an increased import of input materials as wellas capital goods, widening trade deficit in FY2018 (Figure 4).3.Inflation inched down to 4.2% in FY2018 from 4.5% a yearearlier, mainly on the back of subdued inflation in neighboring India,the main source of supplies, and to whose currency the Nepali rupee ispegged (Figure 5). Despite a spike in domestic oil prices, the ease in thesupply of goods, and slow rise in prices for health care and educationservices tamed overall inflation.
Macroeconomic Update 3Figure 4: Share of GDP by expenditureR revised; P provisionalSource: Central Bureau of StatisticsFigure 5: Monthly inflationSource: Nepal Rastra Bank.4.With higher recurrent and capital expenditures, budget deficitwidened to 6.7% of GDP in FY2018, up from 3.2% a year earlier(Figure 6). Budget implementation reforms and the government’s pushtoward execution in the last months of the fiscal year accelerated capitalexpenditures by 28.0%. The election expenses and the fiscal transfer ofabout 8.0% of GDP to sub-national governments (SNGs) also boostedrecurrent expenditures. Nonetheless, long-standing challenges tied toproject readiness, procurement processes, and project management haveoften hampered smooth implementation, affecting budget executionand limiting public investment. Revenue collection increased by 20.1%to equal 24.3% of GDP in FY2018 on higher import growth. To meethigher financing requirements, the government raised external debt by26.6% to equal 17.4% of GDP in FY2018.
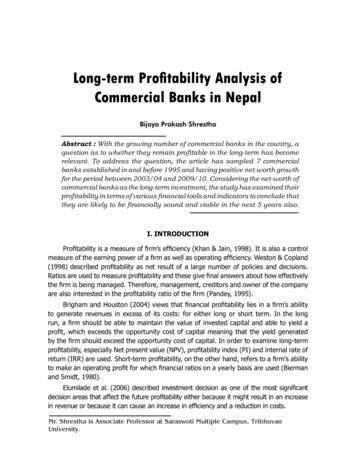
4 Macroeconomic UpdateFigure 6: Fiscal indicatorsDomestic revenueGrantsRecurrent expenditureCapital expenditureFiscal balance% of GDP403020100-10201420152016201720182019 BudgetSource: Ministry of Finance. Budget Speech various years.5.Broad money (M2) supply increased by 19.4% in FY2018,up from an increase of 15.5% a year earlier on rising net domesticassets (Figure 7). Credit to the private sector grew by 22.3% with asignificant share going to wholesale and retail trade, production andconstruction.6.While the Nepali rupee depreciated against the US dollar innominal terms, the currency has been appreciating in real effectiveterms.1 Nominal depreciation was by 6.0% in the fiscal year to midJuly 2018, in line with the depreciation of Indian rupee. The Nepalirupee has appreciated in real effective terms with rising demand ofnon-tradable vis-à-vis tradable sector, leading to higher inflation andthus dampening export competitiveness.7.Merchandise trade deficit widened on higher importgrowth and weak export competitiveness. Imports particularly ofconstruction materials and capital goods surged in FY2018 flaringtrade deficit to 10.9 billion equivalent to 37.7% of GDP rising from33.9% in FY2017. Despite remittance growing healthily at 10.5%in FY2018, the current account deficit widened to 2.3 billion, or8.2% of GDP, up from the deficit of 95.4 million in FY2017 (Figure8). Nonetheless, financial inflows boosted gross foreign exchangereserves to 10.1 billion, providing 9.4 months of cover for importsof goods and services (Figure 9).1As per the IMF’s recent macroeconomic developments released in February 2019, the real effective exchange rate remained about 11% above the 2010-2014 average.Figure 7: Credit to the private sector and M2 growthCredit to private sectorM2 growth% Source: Nepal Rastra Bank.Source : Nepal Rastra Bank. 2019. Recent Macroeconomic Situation . http://www.nrb.org.npFigure 8: Current account indicatorsSource: Nepal Rastra Bank.Figure 9: Gross international reserves and foreignexchange adequacySource: Nepal Rastra Bank.
Macroeconomic Update 5B. Economic prospects in FY2019 andFY2020Figure 10: Major crops production8.The economy is anticipated to grow by 6.2% in FY2019,marginally down from 6.3% in FY2018 (Figure 1; Table 1). Normalmonsoon is expected to boost paddy production to 5.5 million tons,a rise of 8.4% from a year earlier. Production of maize, the otherimportant summer crop, is also projected to rise by 1.8% (Figure 10).Further, the winter rainfall has been timely that will likely
tive exchange rate remained about 11% above the 2010-2014 average. Figure 6: Fiscal indicators 5. Broad money (M2) supply increased by 19.4% in FY2018, up from an increase of 15.5% a year earlier on rising net domesticFile Size: 850KBPage Count: 34