Transcription
OEE OVERVIEWMETRICSPRODUCTIVITY INTELLIGENCE
OEE OVERVIEWMETRICS2PRODUCTIVITY INTELLIGENCE
OEE OVERVIEW What if you had a ‘Tool’ that couldhelp increase manufacturingefficiency 10 - 50%Profitability would increase 20 – 300% !METRICS3PRODUCTIVITY INTELLIGENCE
OEE OVERVIEWOEE DefinedOverall Equipment Effectiveness (OEE) is a quantitative way of measuringhow well a standalone or a flow-line production system operates in making goodproduct relative to what the system could make if it operated perfectly, 100% ofthe scheduled time based on specific products and processes.OEE is a Key Performance Indicator (KPI) used to define theProducutivity between Current State and ‘World Class’ for your system.The goal is Continuous ImprovementMETRICS4PRODUCTIVITY INTELLIGENCE
Initial FoundationOEE OVERVIEW“OVERALL EQUIPMENT EFFECTIVENESS:A Powerful Production/MaintenanceTool for Increased Profits”Robert C. Hansen, PE., CMRPIndustrial Press, New York, NY 2001Owner: RC Hansen Consulting, LLC970-490-1720 cell: 970-481-3145METRICS5PRODUCTIVITY INTELLIGENCE
Initial FoundationOEE OVERVIEW“Total Production Maintenance”A Guide for the Printing IndustryKenneth E. RizzoGATF Press, 2008www.printing.orgMETRICS6PRODUCTIVITY INTELLIGENCE
Initial FoundationOEE OVERVIEWAll methodologies require data tosupport decision makingLean 6S, OEE, TEEP, TPM, Takt Time, TQM, Kaizen, ContinuousImprovementCombine Machine Data with Operator Knowledge to prove the caseèèèèèèMETRICS7PRODUCTIVITY INTELLIGENCE
Initial FoundationOEE OVERVIEWThe OEE Industry Standard gives aguideline in order to find ALL potentiallosses in effectiveness.An average machine in an averagefactory runs about 35 to 45% OEE.So it is losing 55 to 65% capacity!While - not running- running at reduced speed- or producing parts out of specIt is a matter of definition, What you arenot looking for you will not find.www.oeefoundation.orgTo really reveal the hidden machines in your factory, ALL Losses need tobe defined and visualizedMETRICS8PRODUCTIVITY INTELLIGENCE
OEE OVERVIEWProductivity Increases of 10-50%q Reduce Unplanned Downtimeq Reduce Setup and Changeover Timesq Better Management of Resource Allocation,Planning and Schedulingq Operator Productivity Increasesq Efficiency with Automated Data Collectionq Better Root Cause Analysisq Improve Quality, Minimize Rejectsq Identify Bottlenecks and Constraintsq Improve On-Time Deliveryq Manage Operations Pre-emptively & Proactivelyq Measurably Improve Profitability9METRICSPRODUCTIVITY INTELLIGENCE
Why is OEE so important?OEE OVERVIEWè If you were told that your department was running flat out you mightreasonably assume that the equipment was running efficiently andeffectively.è What if the equipment only ran for 65% of the time?è What if when it ran it ran at 80% of its speed ?è What if only 90% of the print are good?65% x 80% x 90% 47%è Individually these performance measures seem to indicate an OKpiece of equipment, but is it a true picture?è What is having an impact on these performance figures?METRICS10PRODUCTIVITY INTELLIGENCE
OEE OVERVIEWMETRICSPRODUCTIVITY INTELLIGENCE
How do we use OEE?OEE OVERVIEWè OEE is only a measure, its benefits will be lost if the shortfalls itidentifies are not acted upon.è OEE is a total measure of performance but the data used to produceit must be used to prioritise improvement tasks.è The purpose of measurement is to identify losses, remove waste anddrive improvement.è OEE should be used to support the Total Productive Maintenance(TPM) approach and the tools it supplies.METRICS12PRODUCTIVITY INTELLIGENCE
OEE OVERVIEWOEE is a Key Performance Indicator (KPI) that can measure theimpact of change on a process caused by eliminating process, orequipment lossesOEE is used to measure the performance of equipment and theprocess.METRICS13PRODUCTIVITY INTELLIGENCE
OEE OVERVIEWOrganizations that train and strategically use the OEE Tools and methodspresented in the modules have a clear roadmap to quickly achieve “TopQuartile” competitive advantage in the Printing Industry.‘Top Quartile’ Winning Teams havecommon best practices;è Detailed Measurement of their performanceè Constantly improving their ‘Best Ever’ performanceè Synergizing every player’s contribution – OPERATOR KNOWLEDGEè Effectively Communicating new ideas or conditionsè Being the Provider of Choicere: Price and DeliveryMETRICS14PRODUCTIVITY INTELLIGENCE
How do I measure OEE?OEE OVERVIEWOEE % Availability x Performance x QualityShows each press output as a percentage of maximum capacityExample: 65% x 80% x 90% 47%Availability %Percentage of scheduled time that the operation is actually operating.Availability % Run Time / Scheduled TimePerformance %Speed at which the Press runs as a percentage of its designed speedor ideal cycle time. Reality vs. advertised “Feeds and Speeds”.Performance % (Parts Made x Standard) / Run TimeQuality %Good Units produced as a percentage of the Total Units Started.Quality % Good Units / Units Started15METRICSPRODUCTIVITY INTELLIGENCE
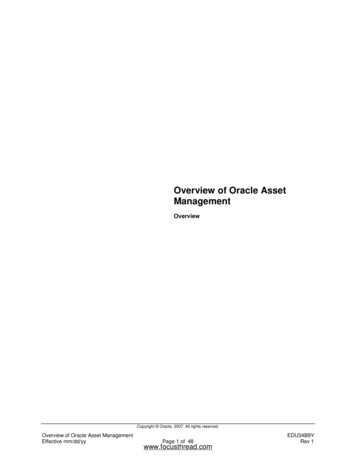
Loading Time less DelaysService, Repair, Break/Jam, Maintenance,Quality Control, Consumables, SetupTotal Output Actual TimeOEE OVERVIEWWaste &ReworkGood Output Actual TimeGood Output@Rated SpeedProductivityOEE TopUtilizationAVAILABILITYQUALITYPERFORMANCEOEEOEE SolitaireTEEP: NetUtilizationOperationsEffectivenessAsset sGood Output TimeLoading Time less DelaysGood Output TimeLoading Time (Work Load)Good Output TimeSum of All Shift TimesTotal Output Actual TimeLoading Time (Work Load)Good OutputTotal OutputGood Output @RateGood Output Actual TimeGood Output @RateLoading Time (Work Load)Good Output @RateLoading Time less DelaysGood Output @RateSelected Measurement Duration 24/7Good Output @Rate W&RSum of All Shift TimesTotal Output Actual TimeSelected Measurement Duration 24/7Loading Time (Work Load)Selected Measurement Duration 24/7METRICSPRODUCTIVITY INTELLIGENCE
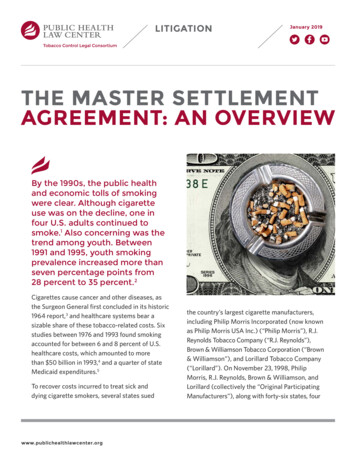
yOperational Equipment Effectiveness (OEE)IllustrationOEE OVERVIEWSelected Measurement Duration 24/7Sum of All Shift TimesNo ShiftsLoading Time (Work Load)Loading Time less DelaysDelaysService, Repair, Break/Jam, Maintenance,Quality Control, Consumables, SetupTotal Output Actual TimeWaste &ReworkGood Output Actual TimeGood Output@Rated SpeedNo WorkPerformanceLossGood Output TimeLoading Time less DelaysGood Output TimeLoading Time (Work Load)Good Output TimeMETRICSPRODUCTIVITY INTELLIGENCE
OEE OVERVIEWMETRICSPRODUCTIVITY INTELLIGENCE
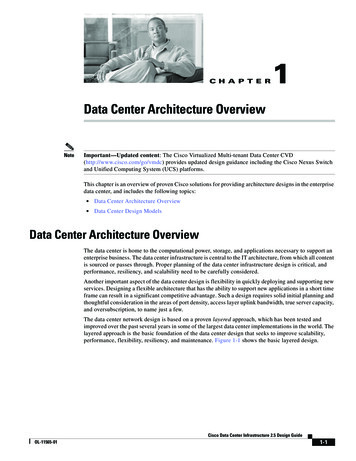
OEE OVERVIEWPareto Analysis is adata graphing analysisbased on the Paretoprinciple which focuseson identifying the20% of sources thatresult in 80% of theproblemsMETRICS19PRODUCTIVITY INTELLIGENCE
Six Big Losses – What Are They?OEE OVERVIEWSix Big Losses1Breakdowns2Setup / adjustment3Idling / minorstoppages4Speed5Defects in processand rework6Start up lossesThe time lost due to key equipmentbreaking down or deterioration whichcauses the production to be stoppedfor more than 10 min.METRICS20PRODUCTIVITY INTELLIGENCE
OEE OVERVIEWSixBig Losses – What Are They?Six Big Losses12BreakdownsSetup / adjustment3Idling / minorstoppages4Speed5Defects in processand rework6Start up lossesThe time lost through “productchange over and adjustment ” tothe point where the production ofthe new product is completelysatisfactory. “Makeready”METRICS21PRODUCTIVITY INTELLIGENCE
Six Big Losses – What Are They?OEE OVERVIEWSix Big Losses1Breakdowns2Setup / adjustment3Idling / minorstoppages4Speed5Defects in processand rework6Start up lossesThe time lost through keyequipment being stopped for lessthan 10 min.Time lost during the standard cyclewhen the equipment is not addingvalue.METRICS22PRODUCTIVITY INTELLIGENCE
Six Big Losses – What AreThey?Six Big LossesOEE OVERVIEW1Breakdowns2Setup / adjustment3Idling / minorstoppages4Speed5Defects in processand rework6Start up lossesThe time lost through keyequipment not producing parts atits optimum rate.METRICS23PRODUCTIVITY INTELLIGENCE
Six Big Losses – What AreThey?Six Big LossesOEE OVERVIEW1Breakdowns2Setup / adjustment3Idling / minorstoppages4Speed56The time lost through key equipmentnot producing parts that meet thespecified quality standard.The time lost through keyequipment being utilised to reworksub-standard parts.Defects in processand reworkStart up lossesMETRICS24PRODUCTIVITY INTELLIGENCE
OEE OVERVIEWSixBig Losses – What Are They?Six Big Losses1Breakdowns2Setup / adjustment3Idling / minorstoppages4Speed5Defects in processand rework6Start up lossesThe time lost through keyequipment not producing parts tothe specified quality standard,following start up and before theequipment achieves controllableproduction conditions.METRICS25PRODUCTIVITY INTELLIGENCE
OEE OverviewOEE OVERVIEWOEE (Overall Equipment Effectiveness) is the measure of :the amount of good product produced compared to the amount ofproduct that could have been produced if the manufacturing systemoperated perfectly for its entire scheduled time.Total Effective Equipment Performance (TEEP) is the measure of theamount of good product produced compared to the amount of product thatcould have been produced if the manufacturing system operated perfectlyfor the total time (calendar time) over the time period under consideration.24 x 7 x 365 100 asset utilizationMETRICS26PRODUCTIVITY INTELLIGENCE
How to collect data for OEEOEE OVERVIEWKey Points:METRICS27PRODUCTIVITY INTELLIGENCE
How to collect data for OEEOEE OVERVIEWExample: Three Hourly Data SheetMETRICS28PRODUCTIVITY INTELLIGENCE
How to collect data for OEEOEE OVERVIEWAVAILABILITYABC A-BGross Time(in minutes)Planned Down Time(in minutes)Net Available Time(in minutes)Non planned stoppages(in minutes)Operating Time(in minutes)DE C-DF E/C(mins/ unit)GHI (HxG)/EAVAILABILITYPRODUCTIVITYOutputStandard Cycle timePRODUCTIVITYQUALITYDefect QuantityQUALITYJK (G-J)/GMETRICS29PRODUCTIVITY INTELLIGENCE
IIOT – Industrial Internet of ThingsOEE OVERVIEW“Following the computer and the Internet,every machine tool will become a node onthe network creating greater ibutedcomputingbatch computingtime neConnectivityopen systems &client serversmicros / PC’sThe technology is here today, the tools are readilyavailable and cost 30METRICSPRODUCTIVITY INTELLIGENCE
METRICS PRODUCTIVITY INTELLIGENCECONNECTMeasureAutomatic Data Collection Enhanced with Operator KnowledgeAnalyzeImprovespencerMETRICS LLCA SPENCER ASSOCIATES GROUP COMPANYmember of the spencerLAB family– serving the industry for over 27 years METRICSPRODUCTIVITY INTELLIGENCE
OEE OVERVIEWMETRICSPRODUCTIVITY INTELLIGENCE
OEE OVERVIEWMETRICSPRODUCTIVITY INTELLIGENCE
OEE OVERVIEWMETRICSPRODUCTIVITY INTELLIGENCE
OEE OverviewOEE OVERVIEWLearning to ‘see’ OEEè As a Strategic Tool and a Monitoring Tool NOT BIG BROTHERè As a Reliability metric and a Business metricè As a leading metric and a lagging metricè Using OEE as a ‘fair’ benchmarking metricè Quantify the value of each OEE factorMETRICS35PRODUCTIVITY INTELLIGENCE
Lean ThinkingOEE OVERVIEWLean Thinking Management System ModelThe Lean Management System Model reflects graphically, theintegration of Hoshin Kanri (Strategic Deployment), Deming’s PDCAWheel (plan–do–check–act) four-step model for carrying out changewith the Toyota Way 2001 principles (Continuous Improvement andRespect for people), and how the lean management system is driven bycustomer requirements and level of satisfaction.The Lean Thinking Management System is used toimplement the 5 Elements of Lean Thinking.METRICS36PRODUCTIVITY INTELLIGENCE
The Deming CycleOEE OVERVIEW.Data based problem solvingTypical PDCA:Plan quicklyHigh Velocity Organization PDCA:Plan deeply Discuss actual situation and target with Address Symptomseveryone affectedDo immediately Really understand/model the problemand its root cause Jump to conclusionsCheck roughlyAct pretty much the wayyou did beforeDo many quick experiments Validate your thinkingCheck implications carefullyAct systematically Update and deploy standards andchecklist disciplinesMETRICS37PRODUCTIVITY INTELLIGENCE
OEE OVERVIEWCurrentCondition – What's your OEE ? What do we already know ?Specific, detailed, quantitative, conciseè Tables, graphs, histograms, value-stream maps, diagramsè Highlight exactly where problem occursè Baseline to compare to metrics after countermeasures areappliedEngage everyone affected by or causing symptomsBuild Consensus on what isè Symptoms / Undesirable Effects everyone can seeè Foundation of authority to experiment withcountermeasuresUpdate as understanding improvesMETRICS38PRODUCTIVITY INTELLIGENCE
Goal – Next Target ConditionOEE OVERVIEW Model what we expectWhat baseline change is wantedè What does “ideal” look like?è What does the organization need?è What is Realistically attainable target condition?Mentor ensures that the owner has bothPlausible Hypothesisè Based on best available model/understanding of howthe system works/could workConsensus among stakeholdersè Target is attainable and desirable.METRICSUpdate as root cause and countermeasures developed39PRODUCTIVITY INTELLIGENCE
Root CauseOEE OVERVIEW Model Cause & EffectIdentify underlying problem(s) causing symptomsè Root cause is typically faulty thinking or assumptionsAddressing the root cause(s) improves all levels of symptoms/undesirable effects/visible damage.Build consensus among stakeholdersè Broad agreement on Cause & Effect networkè Reflect best current knowledge about how things workSome techniques:è Fishbone Diagramè 5 Whysè Histogramsè Pareto Analysisè Root Cause AnalysisMETRICS40PRODUCTIVITY INTELLIGENCE
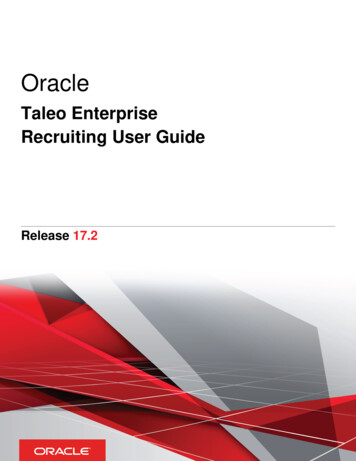
Root Cause AnalysisOEE OVERVIEWThe causal orcontributing factorsthat, if corrected,would preventrecurrence of theidentified problem.The “true” reasonthat contributed tothe creation of aproblem, defect ornon-conformance.ProblemsHow deep are youwilling or able to dig?Are defined in terms of their.EffectsBut this is only what we see on the surfaceour habits and work proceduresCausesWhat is happening under the surface?what is causing our habits and work proceduresRoot CauseA root cause is a blind spot beyond our reachthey are hidden deep down, they feed into or create many of the causes that we see under the surfaceMETRICS41PRODUCTIVITY INTELLIGENCE
OEE shiftsoperatorsMETRICSPRODUCTIVITY INTELLIGENCE
OEE OverviewOEE OVERVIEWOEE for LeadershipOEE Value Stream Analysis as a Strategic ToolWhere?When?What?Why?METRICS43PRODUCTIVITY INTELLIGENCE
OEE ETRICSPRODUCTIVITY INTELLIGENCE
METRICSPRODUCTIVITY INTELLIGENCE
è As a Strategic Tool and a Monitoring Tool NOT BIG BROTHER è As a Reliability metric and a Business metric è As a leading metric and a lagging metric è Using OEE as a ‘fair’ benchmarking metric è Quantify the value of each OEE factor 35