Transcription
Lotto Master Formula (v1.3) – The Formula Used By Lottery WinnersI. IntroductionThis book is designed to provide you with all of the knowledge that you willneed to be a consistent winner in your local lottery or lotto. After learning thescientific way to track and wheel combinations, you will never again wasteyour hard earned money using random numbers, astrology, or any other nonscientific betting strategy.Many people have become confused with all of the wheeling systems andother gaming mechanisms. This book is designed to give you clear and easy-tounderstand knowledge of the most scientific lottery and lotto betting systemsavailable. In addition, you will also learn how to use these tested methods tomake more money than you have ever dreamed possible.By reading and learning the scientific concepts contained in this book, eachdollar that you wager in the lottery or lotto becomes a logical investmentdesigned to reap profits from gamblers who choose to play with no real logic.Now let’s get started and learn how to play the lottery to WIN!II. What are Lotteries and Lottos?The lottery has been around almost as long as mankind has been on earth. It isa way to distribute something of value to those people who have paid for theopportunity to be included.The game, as we know it, dates back to the Italian “La lotto de Firenze” in1530. From Italy, the lotto quickly spread throughout Europe where, from lastreports, it is still going strong.When the settlers came to the new world it was natural to set up a lotterysimilar to what they had known. The proceeds from these lotteries financedsuch things as the buildings of roads, churches and schools.It is best to play the state lotteries because you do not have to worry aboutthem being crooked. State lotteries are supervised by large auditing firms thathave no vested in which numbers are drawn. (Playing the numbers on a locallevel is not only illegal, but also, usually not very profitable.)1
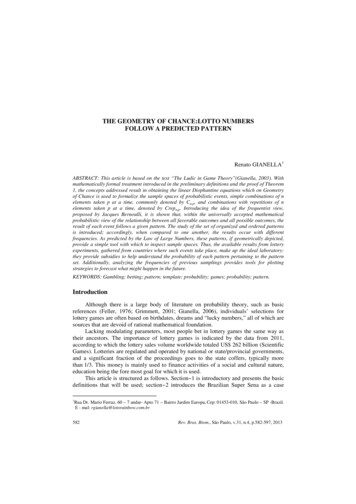
The Three Types of Lotteries:There are three basic types of lotteries. The first one is called the INSTANTGAME.The Instant GameBecause it is so easy to set up, the Instant game is typically the first gameinitiated when a state passes lottery legislation.To win a prize you merely scratch off the latex coating from a card and try tomatch up numbers or pictures.There is no way to show any type of consistent profit from this game so it isadvised that you DO NOT WASTE YOUR MONEY by purchasing these tickets.Strategy is not possible so no more time will be spent on the instant game.3 and 4 Digit LotteryThe second type of lottery involves picking either a three or four digit number.For example, balls numbered from 0 to 9 are placed in either 3 or 4 containers,Lottery Gamedepending on whether it is a three or four ball pick. Forced air is thencirculated inside each container.2
When the tube on top of the container is opened, the ball closest to theopening is forced up the tube and is trapped, this becomes the draw. The topsare opened on each of the containers until all balls are selected.These lottery picks occur almost nightly and require that the digits (ornumbers) be in exact order. The tickets are purchased with combinations thatrange from 000 to 999 and 0000 to 9999 respectively. The payoffs are typically 500 for the three number combinations and 5000 for the four numbercombinations.As you can see, the payoff is 50% of the total pool. The state normally keeps45% and the retail outlet that sells the tickets receives 5%. Using strategiesincluded in this book, you’ll see that three and four digit lotteries are aplayable game and must be considered.LottoThe third type of lottery game is commonly referred to as the Lotto. Theoriginal Pick-6 Lotto requires picking 6 numbers out of a possible 49. The orderof the numbers drawn in a lotto, as opposed to a lottery, makes no difference.All of the balls are placed in a container and mixed up either by forced air or arevolving bin. Typically, the bin is above a curved shoot. Balls revolve and arethen released one at a time down the tube or shoot into a horizontal holdingarea. If it is a 6 ball draw, 6 balls are allowed to be released and gather at theend of the tube. These balls represent the draw for that week or day.The lotto is the highest paying game in the world with payoffs of over 20,000,000 not uncommon!This book will show you the correct strategy necessary to become a lottowinner. Even if you do not win the 6 ball Grand Prize, the 3, 4 and 5 ball prizespaid each week amount to a very comfortable living.3
How to Win at the LotteryMany people make large sums of money following and playing the three andfour digit lottery. In this section we will explore the secrets used to getconsistent winners.Before we begin our strategies it is important to remember that all lotteriesand lottos have biases.III.BiasesIn order to scientifically play the lottery or lotto, biases must be isolated andused to your advantage. A bias is something that causes an event to happenconsistently.In the Old West smart gamblers used to pay close attention to the roulettewheel and keep track of the numbers that came up. Certain wheels had a bias,that, for whatever reason, favored a numbered or a colour (black or red). Afterisolating a bias, the observant player would capitalize on this knowledge andbet accordingly until the saloon caught on.In the lottery and lotto, biases can be caused by inconsistent weight or numberpatterns on the balls.The drag coefficient of each ball is different, therefore patterns will developthat can be tracked. This inconsistency causes a bias which becomes noticeablein your analysis. For example:There is no real need to understand what causes biases. You only need toknow how to use these biases to your advantage.Best Numbers and DigitsIf you look at each stage you will find that the best numbers (most frequentlydrawn) are always different. Using simple methods we will learn how to4
discover these biases or differences so they can be used to predict futurenumbers.There are two schools of thought regarding how to play numbers that seem tobe randomly drawn. You either play the ones that come up the most, or theones that are overdue to come up. To beat the lottery, I suggest that you playnumbers that show a high frequency rather that a low frequency ofoccurrence.Remember, the lottery consists of either 3 or 4 digits with a range of between0 and 9. These digits form an actual number (1234), but should be thought ofas a series of digits (1, 2, 3, 4) for strategic purposes.I suggest that a combination of best numbers (frequently drawn) and bestdigits be used for 3 ball picks.In best number analysis we look at the draw as a whole number (like 928),whereas a best digit analysis would break this down into the actual digits thatcompose the number (9, 2 and 8).We also recommend that only the analysis of digits (0, 9, 3, 5 etc.) be used for4 ball picks. It is difficult to track 4 ball numbers instead of digits because thereare 10,000 possible numbers, which makes a frequency analysis verycumbersome.As an example, let’s look at a 3 ball pick and examine the digits drawn alongwith the numbers created.3(digit)-4(digit)-9(digit)Above are the three digits drawn and below is the number created.349(number)In 4 ball picks, only the digits are studied.3(digit)-4(digit)-9(digit)-6(digit)5
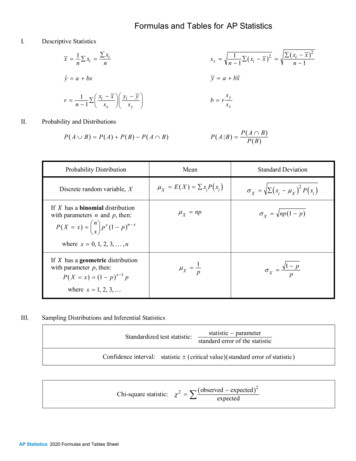
The tremendous amount of possible numbers is why the study of individualdigits and their positions is the only productive analysis.If the state lottery drew a 3 ball and 4 ball winner every day and there were noduplications of numbers, it would take 2.74 years to draw all 3 ballcombinations and 27.4 years to draw all 4 ball combinations; 1000 days for 3ball and 10,000 days for 4 ball!To reiterate, you cannot track four ball numbers, there are too many.Frequency Analysis – 3 & 4 ball drawFor reasons suggested earlier, the analysis of digits is the most powerfulmechanism for predicting lottery winners. To gain an advantage, it is necessaryto track digits in a logical manner.We will start with Frequency Analysis, which simply means, “How often doeseach digit get drawn?”The following page shows an example of a Frequency Graph. This frequencygraph illustrates the bias in this lottery.As you can see, the number 8 is the most frequently drawn digit in this samplelottery. Remember, each digit’s frequency will be different because all lotterieshave particular biases that causes them to be different, but it is thesedifferences that will isolate and use to our advantage.To create your own frequency chart, use a piece of paper and mark a dot oneach column beside the number that is drawn.Using this simple method, play the three or four most frequent digits. If youbelieve that the least frequent digits are actually overdue and are ready to be6
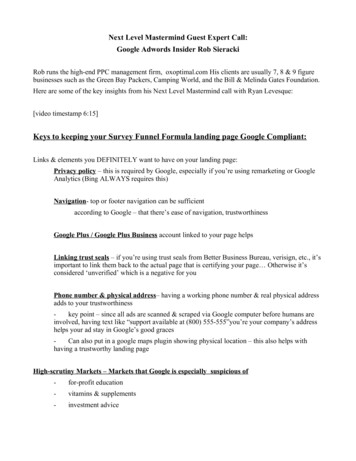
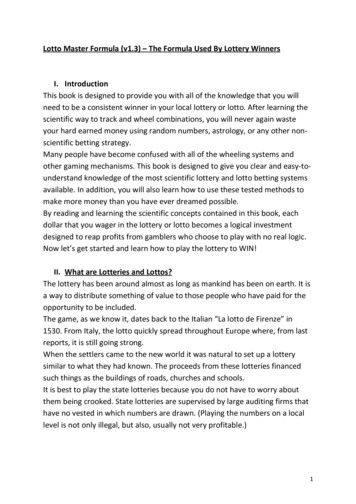
drawn, these also can be played, but the digits with the highest frequency arerecommended.Positional Digit AnalysisWith Frequency Analysis you are able to keep track of how frequently (orinfrequently) digits are drawn. You can now put these digits in positions ofdraw and look at their frequency.It is again suggested that the strategy of analyzing digits be used rather than aBest Number analysis.As was earlier noted in three ball lottery, there are 3 sets of 10 digits (0through 9) but there are 1000 actual numbers (000 to 999). This is a lot oftracking using pencil and paper and is not really that effective.Positional Analysis of the digits is more productive and easier to do.Positional Analysis ChartWhen a set of digits are drawn, position each digit in the column that it wasdrawn. Remember, the order of the draw is important. For this example, let’suse these numbers; 0926, 1452 and 7876.The chart below shows you how to place these numbers in each position ing your own chart is simple – all you have to do is place a dot on thedrawn number in each position. Notice that 0 (zero) is the first digit in thenumber 0926, so put it in position number one, number 9 in position two, andso on.The next step is to find the highest frequency number for each category orposition. The following illustration is what your chart will look like.7
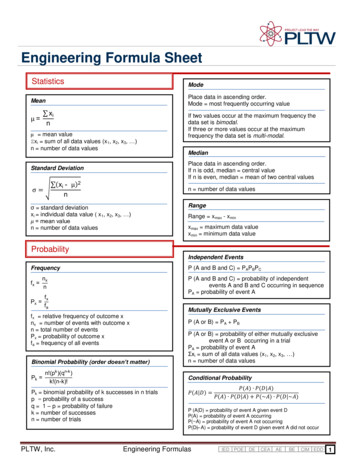
POSITIONA quick check of this chart shows that the best and most frequent digit is #6,and it is in position four. The following illustration represents a chart with alarge sample of draws entered.POSITIONYou now find the number in each column (position) with the highest frequencyand that is the number for that position that you should play.In this example, the number 9 has the highest frequency in position one, 7 inposition two, 3 in position three, and 0 in position four.8
Based on this information, the logical number to play would 9730.As we discussed at the beginning of this section, it is easier and moreprofitable to analyze digits rather than numbers and that is exactly what wehave done.Top Two Best DigitsIt is also a good strategy to take the top two best digits in each category andmake them part of your bet. In this lottery, these would include numbers 8 and9 in the first position, numbers 7 and 9 in the second position, numbers 3 and6 in the third position, and numbers 0 and 3 in the fourth position.The numbers that were used in this example are:POSITION 19827933640 Best Numbers3 Second Best NumbersThis is what the numbers you play would look 9638933993387339733When you use the top 2 best digits make sure that each digit in each positionis part of your bet.If you look at the example you will see that all possible combinations using thefirst and second most frequently picked digits in each position are represented.You have now used a combination of Frequency Analysis and PositionalAnalysis and arrived at a logical and statistical system of playing the lotterythat provides the best chance for success.Cluster AnalysisCluster Analysis refers to analyzing which numbers are drawn most often withother numbers.For example, the following group of numbers are drawn .9
002384915684675231007784In this example, the cluster numbers are 84 and 00. The 84 combinationoccurred on three occasions with the 00 appearing twice.In order to use the Cluster Analysis you must keep track of all of the clustersalong with the frequency of each one.This is a paramount task using pencil and paper. We advise that you useCluster Analysis in conjunction with a computer program due to the complexityof tracking so many possible combinations.Best Number AnalysisWe shall look at Best Number Analysis although it should never be used in 4ball lotteries. Even in 3 ball lotteries it is not as powerful as the Frequency andPositional analysis methods that we discussed earlier.Using the same concepts involved in Frequency analysis we will track actualnumbers or 3 digits sets.We will look at the whole number and not break it down into digits.In order to track best numbers, you must set up your paper or spreadsheet soall possible numbers are represented.For example:Each time a number is drawn simply place a dot above that number in order tokeep track of the frequency of draws.In this chart, the number 004 is the most frequent, with numbers 002, 003 and005 having never been drawn.If you believe that frequently drawn numbers will be drawn again and again,play 004. If overdue numbers are where you would like to put your money,play the low frequency or overdue numbers.10
Best number strategies are difficult because it often takes years before anumber is drawn twice, as we explained earlier.Betting 3 and 4 Ball lotteriesUsing the previously outlined methods you should already understand whatnumbers or sets of digits you would like to wager on. These bets can bestraight bets or boxes.Straight BetsTo play a straight bet you merely play the numbers or combinations of digitsthat the analysis predicted.124003265432410987680234 (3 ball numbers)1975 (4 ball numbers)BoxesMany professional lottery handicappers will box their numbers in order tocreate more combinations, along with a higher degree of winning confidence.They may feel very comfortable with digits 3, 5 and 6 based on their analysis,so they will box them. This means that these numbers must be included in thedraw, but can be in any order or combination.333353365653 Boxing digits is much more expensive than playing straight numbers but theconfidence level of winning is also higher.When you box digits, the order of the lottery machines can be changed beforethe draw and it does not affect your bet like it would with straight bets.Partial BoxesAfter a thorough analysis of digits and positional frequencies, many bettorsdecide that only a portion of a number needs to be boxed – for example, thelast digit.11
Partial Box Using Last Digit340341342343344345346347348349As you can see, only the last digit is boxed thus creating ten combinations.It is now time to start analyzing your local lottery. The methods discussed arethe most productive and provide you will the ability to make meaningfulwagers based on winning strategies.IV. How to Win at LottoThe most popular and profitable game is the LOTTO. Each state has a differenttype of lotto that relates to how many numbers are possible and how manyare drawn.In the popular 6/49 Pick Six, balls numbered from 1 to 49 are placed in acontainer and circulated either with air or a revolving bin.Six balls are then selected.These balls represent the winning draw. California and some other states alsoadd a bonus draw which can be used to complete a 6 ball winning set.22793624116Ball 16 in the above example, is the bonus ball that can be used to completethe 6 ball winning combination.To win the grand prize you must have 6 out of the 7 numbers drawn. Thebonus draw gives you an extra chance if you only picked 5 out of the first 6correctly.12
New York and others have initiated lottos that have a pool of over 90 numbersand require up to 20 numbers out of 20 to be correct.These lottos are very difficult to beat because of the high odds. For thepurpose of this book all strategies will be geared toward the 6/49 lotto, but themethods of analysis are valid for all lottos.Best Number AnalysisThe Best Number Analysis in the lotto is the same as the frequency analysis inthe lottery. The frequency, or how many times each number has been drawn,is tracked. The best number is the one that has the highest frequency.The following page shows a simple Best Number Chart that you can easilycreate.If you look at this chart you can see that number 5 has the highest frequency, ithas been drawn a total of 6 times. The lowest frequency is number 2 which hasonly been drawn once.As in the lottery strategies, I suggest that you use the Best Number Analysis inconjunction with the Positional Analysis.Positional AnalysisThe Positional Analysis should represent the heart of your analysis.It is the most productive and will produce consistent profit. This analysis isessentially the same as was described in the lottery method. With lotto there isno duplication of numbers so it is even more effective.13
Your chart will look something like this chart. The first thing to do is to create achart similar to the previous one. A piece of paper or a spreadsheet will workthe best. A dot is placed on the sheet in the correct column for each numberthat is drawn. For example, let’s look at how to add numbers to the chartbased on 3 draws. These are the numbers that were drawn:010519221107190206090808162721492840In order to correctly position each draw, numbers must be put in ascendingorder, lowest to highest. Therefore, after each draw, sort the numbers beforeplacing them in their respective positions.The sorted numbers look like this:010206090507160808191119222721492840Now place a dot on your chart for each chart for each number, making surethat it is in the correct column or position. A quick look at the chart on page 30shows that the number 8 appeared 2 times in the third position and that thenumber 19 also appeared twice in position four. It is still too early to predictfuture numbers, but your chart will soon begin to give you importantinformation. Let’s move on to the next chart.14
As you can see, this chart is beginning to show patterns of numbers in eachcategory that have the highest frequency.You can now see that after you have entered a large numbers of draws, thechart will tell you exactly which numbers are most frequent in each position.15
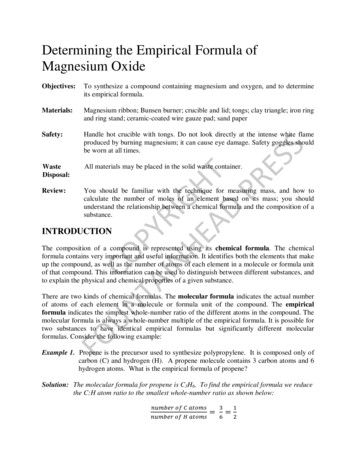
For the purpose of clarity, the previous chart shows the exact frequency ofeach number in a numerical form rather that the dots that you entered. Thismakes it easier for you to use the information in the chart.If you look at each position, you will see that #2 was the most frequentlydrawn number in position one, #17 in position three, #19 in position four, #32in position five and #34 in position six.As you can see, position #2 is unique because it does not have a single TOPnumber, the numbers 3, 5, 7, 8, 9 and 14 all occurring 6 times. As a rule, thefewer the number of samples, the larger the number of ties. When thishappens, two numbers or more being tied, you normally include all of them inyour wheel – with the exception of any duplicate numbers that may haveappeared in several positions.Thus, if a number has the highest frequency in two or more positions, use itonly once in your wheel.In this example, your chosen numbers would be;2 17 19 32 343 5 7 8 9 14Highest Frequency NumbersTies in Position Two16
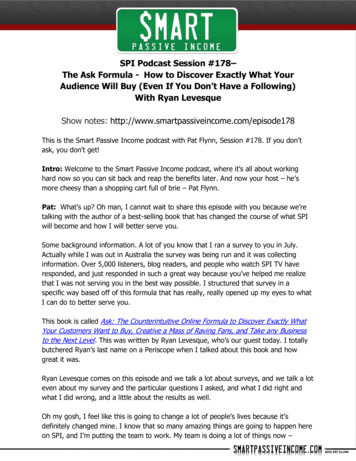
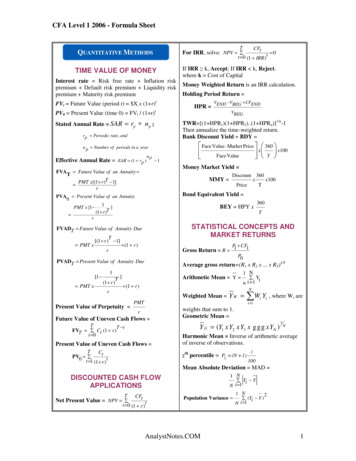
If you have a large number of ties, or want to use the highest and secondhighest numbers (as we did in the lottery), using a wheeling system is the onlyway to keep your betting costs acceptable.Dimitrov Wheeling SystemsUnlike Positional Analysis, the Dimitrov Wheeling Systems are not an analysisbut an analysis but rather a system for wheeling ions1728842104629241716A wheeling system
The third type of lottery game is commonly referred to as the Lotto. The original Pick-6 Lotto requires picking 6 numbers out of a possible 49. The order of the numbers drawn in a lotto, as opposed to a lottery