Transcription
APPLI CATI ONANALY TI C SFOR U N I F I E DCOM MU N I CATI ON SUnprecedented Insight into everyuser’s actual UC experience
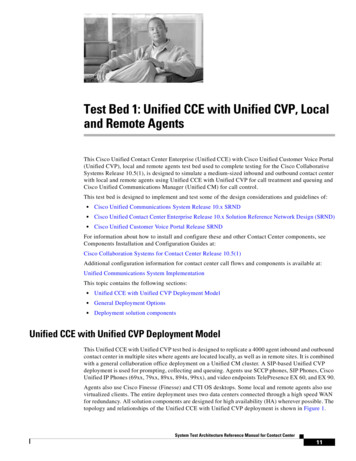
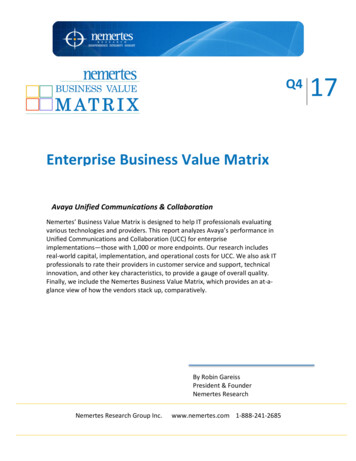
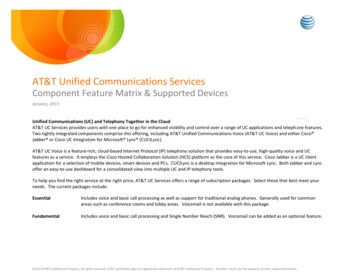
RICH USER APPLICATION ANALYTICS FOR UNIFIED COMMUNICATIONSThrough direct feeds from Cisco UCM and Skype for Business application programming interfaces (APIs),Voyance delivers unprecedented insight into the user experience for business-critical UC applications.This includes detailed visibility into user calls, quality of experience for individual users, baselining of UCapplications across all users, and richer root cause analysis. Specific UC call metrics are analyzed, measured, and correlated to all other network services on which UC communications depend. Detailed UCmetrics that Voyance constantly measures and tracks include:: Unique users per minute Number of UC voice/video calls over pre-defined time periods Estimated bandwidth usage over time Per minute MOS scoring and MOS degradation Voice and video stream quality Packet loss, jitter and RTT tracking per UC application12FIGURE : At a glance Voyance dashboard shows most used applications1Number or total users per application and percentage of user application issues experienced2Aggregate user traffic usage per application over timei n fo @ nya n s a .co m 2 47 H i g h St, Pa l o A l to C A 94 3 01 nya n s a .co m
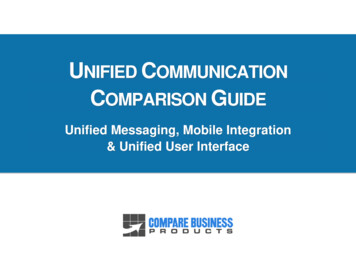
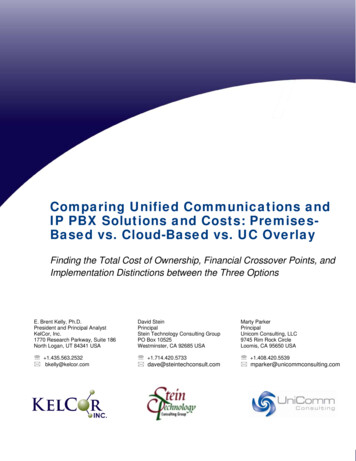
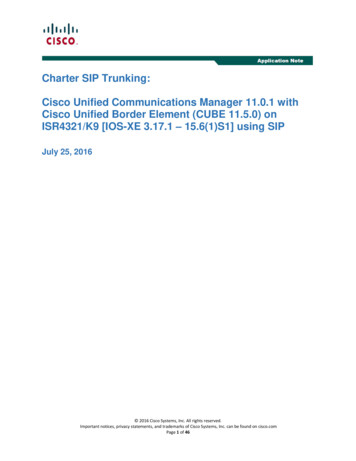
DETAILED CALL METRICS FOR CISCO UCM AND SKYPE FOR BUSINEESS21341Total UC traffic consumed over time period2Real-time seach for any user, device, application or server3Current number of users/devices experiening performance problems4Detailed UC metrics measure voice call quality, tracking jitter latency, packet loss and MOS scoresi n fo @ nya n s a .co m 2 47 H i g h St, Pa l o A l to C A 94 3 01 nya n s a .co m
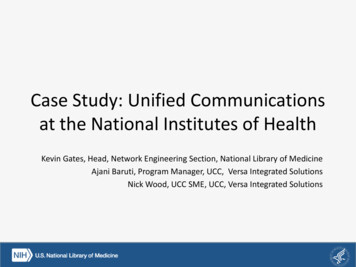
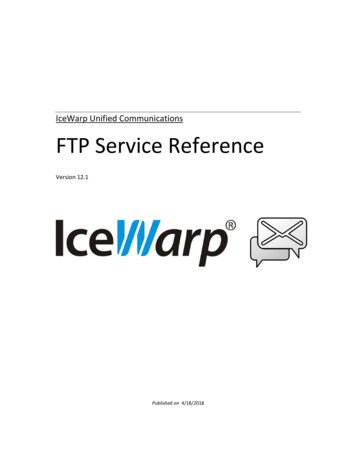
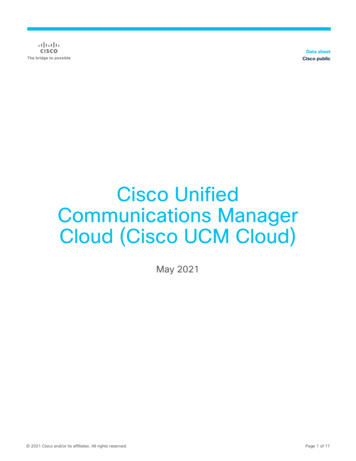
AUTOMATIC UC APPLICATION BASELININGACMESearch clients, apps anSupportClients had poor Cisco UCM ExperienceBenchmarkAnalysis2FILTERSTrendsClients had poor Cisco UCMBaseline Experience % of clients affected1A60%Last Two WeeksNo Filter Selected50%40%Split baseline: wired, wireless30%MOST IMPACTED20%Most affected locations10%0%Wed 15Thu 16Fri 17Sat 18Jun 19Mon 20Tue 21Wed 22View Annotations4Root Cause AnalysisCommon Root Cause39th Floor19 of 337 clients60%11th Floor22%12th Floor8%4th Floor5%1st Floor2%Top 10Next StepsClient and/or non-network issue.1Client PropertiesClient and/or non-network issue.APAP09Z0F99ZFMost affected SSIDsGuest19%Cafeteria12%Thunderbolt Theatre 8%CUCM Abnormal Calls«12Network MOSDegradation34CUCM Max RTTCUCM Max JitterCUCM Max Packet Loss Listen MOS Session MinL2 Rx RetransmitBuilding B4%Lab3%Top 10»1 of 4 Root CausesMost affected Device OSMost A ected Clients5ClientsUser NameHours Affected999006bmcdonal168hqw7nb990DNC AD\Mrochwar108hqw7nb0405DNC Windows 1019%OS X 10.212%Android 4.48%iOS 4.14%Client X3%Top 101Automatic baseline experience of each application by % of affected users2Rich filtering by application type, incident, time window3Application incidents by most affected location, SSIDs, RF bands, and client device OS4Full stack root cause analysis of incidents and next step remediation suggestions5Most affected clients by user name and number of client hours affectedi n fo @ nya n s a .co m 2 47 H i g h St, Pa l o A l to C A 94 3 01 nya n s a .co m
QUANTIFYABLE BOTTOM LINE BENEFITSMAXIMIZING THE QUALITY OF USER EXPERIENCEKEY FEATURESVoyance analyzes every user’s quality of experiencefor UC applications from the moment they connect Detailed insight into every user’s UC applicationand all the way through application access, allowingexperienceproactive remediation and planning based on actualuser traffic, application behavior and real network Concurrent measurement and correlation of UCservice trends.application performance with network servicesTRACKING LOST USER PRODUCTIVITY Quantifiable client hours lost per UC applicationAs user incidents occur, Voyance automatically iden-incidenttifies and lists the most affected clients, detailing thenumber of client hours lost. This gives enterprises quan- Identification of most affected clients andtitative justification of the direct financial impact of UCrespective lost user hours from any UC issueapplication issues on business productivity. Automatic baselining of UC applicationWAY BEYOND APPLICATION RESPONSE TIMES performance by location, SSID, client O/SUnlike any other analytics solution, Voyance concurrently correlates other essential metrics such as UC root cause analysis prioritization, symptomsWi-Fi performance, network service details and clientand suggested remediationdevice behavior with UC performance to deliver a At a glance UC application use by number oftrue view of how users are really experiencing UCusers, traffic consumed and % of user issuesapplications.FIGURE :The applicationdetails pagehighlights the totaluser traffic volumeper UC application over timeas well as thenumber of usersof each application and theirrespective trafficconsumption.i n fo @ nya n s a .co m 2 47 H i g h St, Pa l o A l to C A 94 3 01 nya n s a .co m
rich user application analytics for unified communications Through direct feeds from Cisco UCM and Skype for Business application programming interfaces (APIs), Voyance delivers unprecedented insight into t