Transcription
Climatic Change(2021) longed Siberian heat of 2020 almost impossiblewithout human influenceAndrew Ciavarella 1 & Daniel Cotterill 1 & Peter Stott 1 & Sarah Kew 2 & Sjoukje Philip 2 &Geert Jan van Oldenborgh 2 & Amalie Skålevåg 3 & Philip Lorenz 3 & Yoann Robin 4 &Friederike Otto 5 & Mathias Hauser 6 & Sonia I. Seneviratne 6 & Flavio Lehner 6 &Olga Zolina 7,8Received: 20 August 2020 / Accepted: 25 February 2021/# Crown 2021AbstractOver the first half of 2020, Siberia experienced the warmest period from January to Junesince records began and on the 20th of June the weather station at Verkhoyansk reported38 C, the highest daily maximum temperature recorded north of the Arctic Circle. Wepresent a multi-model, multi-method analysis on how anthropogenic climate changeaffected the probability of these events occurring using both observational datasets anda large collection of climate models, including state-of-the-art higher-resolution simulations designed for attribution and many from the latest generation of coupled oceanatmosphere models, CMIP6. Conscious that the impacts of heatwaves can span largedifferences in spatial and temporal scales, we focus on two measures of the extremeSiberian heat of 2020: January to June mean temperatures over a large Siberian regionand maximum daily temperatures in the vicinity of the town of Verkhoyansk. We showthat human-induced climate change has dramatically increased the probability of occurrence and magnitude of extremes in both of these (with lower confidence for theprobability for Verkhoyansk) and that without human influence the temperatures widelyexperienced in Siberia in the first half of 2020 would have been practically impossible.Keywords Extreme Event Attribution . Heatwave . Siberia . Extremes . Multi-model . Rapidattribution1 IntroductionSince the beginning of 2020, anomalously high temperatures were repeatedly reported inSiberia. For instance, on 17 June 2020, the Guardian reported that Russia as a whole had* Andrew ed author information available on the last page of the article
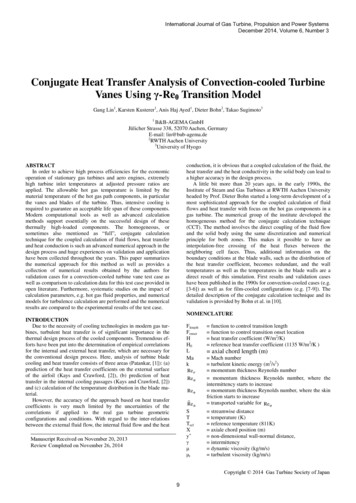
9Page 2 of 18Climatic Change(2021) 166:9experienced record high temperatures in 2020, with the average from January to May being5.3 C above the 1951–1980 average (Guardian 2020) and contributing to January to Mayglobally averaged temperatures ranking 2nd warmest on record (Met Office global temperature2020). On the 23rd of June, the World Meteorological Organization (WMO) announced that itwas ‘seeking to verify a reported new record temperature north of the Arctic Circle [of] 38 Con 20th June in the Russian town of Verkhoyansk amid a prolonged Siberian heatwave andincrease in wildfire activity’ (WMO 2020). Notably, this event happened in the month prior tothat of the climatologically expected peak daily maxima. Subsequently, numerous media(newspapers, television, radio) reported on the event as well as on the Siberian heat anomalypersisting since early 2020. The 20th of June Arctic temperature record was then confirmed onthe 30th of June by Russia’s meteorological service Roshydromet (WMO Twitter). We notedthat this temperature is not reproduced by the (lower than station resolution) ERA5 reanalysis,which reaches 32.9 C on the 21st of June in the vicinity of Verkhoyansk but which is still arecord in this dataset, supporting the exceptional nature of the heat locally over this period.This article is based on a rapid attribution study performed by the World Weather Attributionconsortium and the scientific report underlying that study.Here, we investigate the role of human-induced climate change in the likelihood andintensity of both of these events: the persistent warm anomalies across Siberia (here definedas 60 N–75 N, 60 E–180 E) from January to June 2020 (black box in Fig. 1 (a)) and thereported record temperature of 38 C at Verkhoyansk (67.55 N, 133.38 E) on the 20th of June(Fig. 1 (a)). Both of these event definitions are chosen primarily to relate to the impacts of theextreme heat on the ecosystem and human health. Changes in likelihood are expressed throughprobability ratios (PR), i.e. the change in probability of occurrence of an event at least asextreme as that observed, calculated as the ratio of the threshold exceedance probabilities attwo different times. An alternative way to analyse the event is to consider intensity changes,representing the change in temperature of the event for a fixed probability.While the record temperature north of the Arctic circle on the 20th of June made headlines,impacts potentially linked directly or in part to the extreme heat have been widespread.Persistent and unusually many wildfires have been observed. About 7900 mile2 of Siberianterritory had burned this year as of the 25th of June, compared to a total of 6800 mile2 as of thesame date a year ago, according to official data (New York Times 2020a; National Geographic2020). These fires led to a release of 56 megatons of CO2 in June 2020 (COPERNICUSwildfires 2020), more than the yearly CO2 emissions of some countries (e.g. Switzerland(Global Carbon Atlas)). High temperatures and also the dry conditions in the first 6 monthsprobably exacerbated these fires. Further impacts include health impacts on the population(New York Times 2020b) and the melting of permafrost which led to high damages, includingenvironmental pollution: ‘A fuel tank near the isolated Arctic mining city of Norilsk burst inlate May after sinking into permafrost that had stood firm for years but gave way during awarm spring, officials said. It released about 150,000 barrels of diesel into a river’ (New YorkTimes 2020b).It is important to highlight that the meteorological extremes assessed here only representpart of one component of these impacts, the hazard, whereas the impacts also depend stronglyon exposure and vulnerability, as well as other climatological components such as the durationof extreme heat.The high temperatures in Siberia in January–April were associated with below-normalsurface pressure over the Arctic Ocean, extending south into northern Siberia (Fig. S1). In thisseason, low pressure is associated with milder temperatures as it inhibits the clear skies of the
Climatic Change(2021) 166:9Page 3 of 189Fig. 1 Extreme Siberian heat of 2020. a ERA5 near-surface temperature (T2m) anomalies (with respect to 1981–2010) [ C] for January–June 2020. The region used in the study (black box) 60 N–75 N, 60 E–180 E saw ananomaly of 4.5C w.r.t. 1981–2010. The location of Verkhoyansk is also shown. b Daily maximum temperature(TX) observations [ C] from January to June 2020 at station Verkhoyansk with positive and negative departuresfrom the 1981–2010 climatological mean shaded red and blue, respectively. TX peaks at 38 C on the 20th ofJuneSiberian High that cause strong longwave radiative cooling from the snow. This patternpersisted, being very strong in January–March and less strong in April. It also supports directadvection of relatively warmer and moister air from lower latitudes. A detailed analysis offactors that can lead to such situations is provided in Wu and Chen (2020). In May–June, theopposite connection holds: higher pressure leads to more sunshine, which increases thetemperature. We indeed find high sea-level pressure during June in the study area. Persistenceof the high-temperature anomalies was likely enhanced during May and June due to earliersnowmelt (Fig. S2). The bare soil absorbs more solar radiation and hence can cause highertemperatures.The synoptic development that led to the record temperatures in Verkhoyansk (Fig. 1 (b))was initially associated with the blocking of the subpolar jet by a persistent low over CentralSiberia. The blocking developed on 6–8 June 2020, resulting in a moderate ridge over easternSiberia (east of Verkhoyansk). This pattern likely originated from a cut-off of the North Pacificanticyclone and preconditioned the high-temperature anomaly in the second half of June. Thispattern was characterized by geopotential height at 500 mbar (z500) exceeding 5580 gpm and
9Page 4 of 18Climatic Change(2021) 166:9mean sea-level pressure (MSLP) peaking at 1013–1014 hPa. Notably, daily maximum temperatures increased locally to 27.8–28.0 C on the 8th of June. After the 12th of June, thishigh-pressure centre expanded over much of eastern Siberia (including Verkhoyansk) whilelocal temperature experienced a short-term decrease. Starting from the 16th–17th of June, thishigh-pressure centre was under the influence of the intense transport of the tropical air massesassociated with propagation of the tropical high-pressure ridge from the south northeastward,potentially associated with the impact of the spring-early summer Asian monsoon (e.g. Choiand Ahn 2019). This resulted in sustained high-pressure centred east of Verkhoyansk withmaximum z500 exceeding 5800 gpm and advection of very hot air from the south. Mean dailytemperatures between the 17th and 27th of June exceeded 10 C above the 1960–2010 normand peaked at 13.7 C above normal. Additionally, the period 10th to 30th of June was anexceptional dry spell, exceeding the 99.9th percentile of dry spell duration estimated accordingto the methodology of Zolina et al. (2013).To investigate potential trends in the frequency of occurrence of prolonged Siberian hightemperatures, similar to the first half of 2020, we choose to analyse January–June averaged 2m temperature over land in the region 60 N–75 N, 60 E–180 E (region Fig. 1 (a), series Fig. 2(a)). This region covers most of Siberia and includes the area affected by the 2020 springmonthly anomalies and Verkhoyansk, the station where the daily maximum temperaturerecord was broken in June. The region is chosen to be representative of Siberia and, to avoidselection bias, is deliberately broader than the region that experienced the highest January–June temperatures in 2020. The January–June climatological mean temperatures are alsorelatively homogeneous across the study region (Fig. S3).To investigate if human-induced climate change played a role in increasing the likelihoodof the record-breaking temperature at the station Verkhoyansk, we analyse June maximumvalues of daily maximum 2-m temperature, i.e. the maximum temperature of the hottest Juneday (June TXx), at the location of the station Verkhoyansk (Fig. 2(b)). Rather than analysesummer maxima, we restrict it to the month of June because there is a strong seasonal cycle intemperature that peaks in July (Fig. S4).Our analysis follows the approach taken by the World Weather Attribution (WWA)group (see Section 2). The aim of the study is to provide a rapid assessment of changesin frequency and intensity (temperature change at fixed probability) of the event. Weapproach that aim using both observational trends and a large sample of climate modelswith differing representations of climate processes and response to external forcing andalso require that each model pass a validation step against observations. To that end,after describing the data and statistical methods in Section 2, we go on to perform initialobservational analyses in Section 3. The observational analysis gives us our firstestimates of frequency and intensity changes but also provides parameters that formpart of the statistical validation each model must pass in Section 4. Section 5 thenpresents model analysis results which are combined with the observational estimates toform our synthesis results. In Section 6, we discuss our results in light of regionalexposure and vulnerability to this hazard.2 Data and methodsIn this section, we present details of the statistical methods and datasets to which they areapplied (both observational and model output).
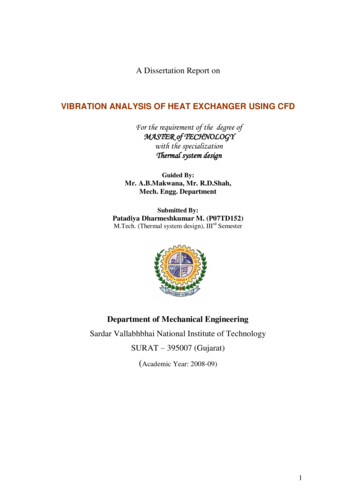
Climatic Change(2021) 166:9Page 5 of 189Fig. 2 Observed time series examined in this study. 2020 values are a record in both series. a GISTEMPanomalies (to 1951–1980) of the near-surface air temperature [ C] for January–June 2020. b The observed seriesof maximum June daily maximum temperatures (June TXx) at Verkhoyansk2.1 Statistical methodsWe first perform an analysis of time series from observational gridded data sets and stationdata where long records of observed data are available followed by analyses of climate modeloutput with the same method and for the same quantities. The observational analysis plays tworoles, giving us an assessment of changes that is independent of numerical climate models (butnot attributed to anthropogenic climate change) as well as providing validation criteria thatmust be satisfied by all models included in the subsequent model-based attribution analysis.We also repeat the observational analyses with alternative datasets or methods where possible.The WWA methodology, Philip et al. (2020a), has been used in previous publications, forexample, in Van Oldenborgh et al. (2018) (heat extremes) or Van der Wiel et al. (2017)(precipitation extremes). The variable of interest is assumed to be described by a nonstationarydistribution whose location (or location and scale for precipitation) changes with time andwhose other parameters may be assumed constant. For regional temperature, a linear relationship with global mean surface temperature (GMST) is often well motivated (so-called patternscaling, Tebaldi and Arblaster (2014)) and is used to describe changes in the locationparameter. This fit also provides parameters whose values are used in the statistical validation
9Page 6 of 18Climatic Change(2021) 166:9of the climate models (Section 4). Observational changes in probability and intensity of eventsat the event threshold may then be found by evaluating the distribution for different values ofthe covariate series. For the early-industrial climate baseline, we take the year 1900 and for thecurrent climate the year 2020. An equivalent analysis is then performed for each climate modelpassing the validation step in which each model
Prolonged Siberian heat of 2020 almost impossible without human influence Andrew Ciavarella 1 & Daniel Cotterill1 & Peter Stott1 & Sarah Kew2 & Sjoukje Philip2 & Geert Jan van Oldenborgh2 & Amalie Skålevåg 3 & Philip Lorenz3 & Yoann Robin4 & Friederike Otto5 & Mathias Hauser6 & Sonia I. Seneviratne 6 & Flavio Lehner6 & Olga Zolina7,8 Received: 20 August 2020/Accepted: 25 February