Transcription
United StatesDepartmentof AgricultureAnimal andPlant HealthInspectionServiceVeterinaryServicesPart I:Baseline Reference of1998 EquineHealth and ManagementNational Animal Health Monitoring SystemAugust 1998
AcknowledgmentsThis report has been prepared from material received and analyzed by the U.S. Department ofAgriculture (USDA), Animal and Plant Health Inspection Service (APHIS), Veterinary Services (VS)during a nationwide study of management and animal health on equine operations.The Equine ‘98 Study was a cooperative effort between State and Federal agricultural statisticians,animal health officials, university researchers, extension personnel, and equine owners and operators.We want to thank the hundreds of industry members who helped determine the direction andobjectives of this study by participating in focus groups and responding to interactive Internet andtelephone surveys.Thanks also to the National Agricultural Statistics Service (NASS) enumerators and State and FederalVeterinary Medical Officers (VMO’s) and Animal Health Technician’s (AHT’s) who visited theoperations and collected the data for their hard work and dedication to the National Animal HealthMonitoring System (NAHMS). The roles of the producer, Area Veterinarian in Charge (AVIC),NAHMS Coordinator, VMO, AHT, and NASS enumerator were critical in providing quality data forEquine ‘98 reports. Thanks also to the staff at the Centers for Epidemiology and Animal Health(CEAH) for their efforts in generating timely reports from Equine ‘98 data.All participants are to be commended for their efforts, particularly the producers whose voluntaryefforts made the Equine ‘98 Study possible.Dr. Nora Wineland, NAHMS Program LeaderContacts for Further InformationQuestions or comments on Equine ‘98 Study methodology or data analysis: . . . . . Dr. Lindsey GarberInformation on reprints or other NAHMS reports: . . . . . . . . . . . . . . . . . . . . Ms. Nina StantonTelephone: (970) 490-8000E-mail: NAHMSweb@usda.gov
Part I: Table of ContentsIntroduction . . . . . . . . . . . . . . . . . . . . . . . . . . . . . . . . . . . . . . . . . . . . . . . . . . 1Terms used in this report . . . . . . . . . . . . . . . . . . . . . . . . . . . . . . . . . . . . . . . . . . 2Section I: Population Estimates (Part I). . . . . . . . . . . . . . . . . . . . . . . . . . . . . . . . . . . . 3A. Equine Demographics . . . . . . . . . . . . . . . . . . . . . . . . . . . . . . . . . . . . . . . . . 31. All equids . . . . . . . . . . . . . . . . . . . . . . . . . . . . . . . . . . . . . . . . . 32. Type of equids. . . . . . . . . . . . . . . . . . . . . . . . . . . . . . . . . . . . . . . 73. Horse breeds. . . . . . . . . . . . . . . . . . . . . . . . . . . . . . . . . . . . . . . . 94. Resident equids . . . . . . . . . . . . . . . . . . . . . . . . . . . . . . . . . . . . . 10B. Health and Health Management . . . . .1. Record keeping. . . . . . . . . . . . .2. Health care responsibility . . . . . . .3. Health care information sources . . . .4. Use of a veterinarian . . . . . . . . . .5. Hoof care . . . . . . . . . . . . . . . .6. Dental care . . . . . . . . . . . . . . .7. Fecal, feed, and water tests performed.8. Equine infectious anemia (EIA) . . . .9. Vaccinations . . . . . . . . . . . . . .10. Deworming . . . . . . . . . . . . . . . . . . 1515161819202123252932C. Births, Illnesses, and Deaths1. Born alive or born dead .2. Foaling location . . . . .3. Neonatal practices . . . .4. Morbidity. . . . . . . . .5. Mortality . . . . . . . . . . . . . 343436373842.Section II: Methodology. . . . . . . . . . . . . . . . . . . . . . . . . . . . . . . . . . . . . . . . . . . 47Appendix I: Sample Profile . . . . . . . . . . . . . . . . . . . . . . . . . . . . . . . . . . . . . . . . . 51A. Responding operations . . . . . . . . . . . . . . . . . . . . . . . . . . . . . . . . . . . . . . . . 51Appendix II: 1992 Census - Horses & Ponies . . . . . . . . . . . . . . . . . . . . . . . . . . . . . . . 52U.S. Inventory of Horses & Ponies on Farms & Number of Farms Reporting Horses & Ponies . . . . 52
Part II: Table of ContentsProvided in Part I for reader reference.See the back cover of this report for Part II’s anticipated release date.Introduction . . . . . . . . . . . . . . . . . . . . . . . . . . . . . . . . . . . . . . . . . . . . . . . . . 53Terms used in this report . . . . . . . . . . . . . . . . . . . . . . . . . . . . . . . . . . . . . . . . . 54Section I: Population Estimates . . . . . . . . . . . . . . . . . . . . . . . . . . . . . . . . . . . . . . . 55A. Biosecurity . . . . . . . . . . . . . . . . . . . . . . . .1. Operation management: visiting non-resident equids .2. Operation management: additions to resident equids .3. Contact with other animals. . . . . . . . . . . . . . . . . . . 55555766B. Animal Movement . . . . . . . . . . . . . . . . . .1. Vehicle transportation off operation and return . .2. Number of trips . . . . . . . . . . . . . . . . . .3. Distance traveled (whether or not by vehicle) . . .4. Boarding off home operation 30 days or more . .5. Disposition of resident equids (excluding deaths) .6. Identification methods . . . . . . . . . . . . . . . . . . . 67677071737276C. Nutrition Management . . . . . . . . .1. Source of nutrition/diet information .2. Dried forage fed . . . . . . . . . . .3. Grain/carbohydrate source . . . . . .4. Winter feeding . . . . . . . . . . . .5. Supplements . . . . . . . . . . . . .6. Drinking water . . . . . . . . . . . . . . . . 79798285878788.D. Pasture Management . . . . . . . . . . . . . . . . . . . . . . . . . . . . . . . . . . . . . . . . . 891. Turnout management. . . . . . . . . . . . . . . . . . . . . . . . . . . . . . . . . . . 892. Pasture use for 3 months or more in 1997 . . . . . . . . . . . . . . . . . . . . . . . . 91E. Housing Management . . . . . .1. Cooling and heating methods2. Primary housing . . . . . . .3. Stall housing . . . . . . . . . . . . . 92929495F. Bedding and Manure Management . . . . . . . . . . .1. Removal from stalls . . . . . . . . . . . . . . . . .2. Bedding type . . . . . . . . . . . . . . . . . . . . .3. Disposal methods for manure and/or waste bedding. . . . . 96969799Section II: Methodology . . . . . . . . . . . . . . . . . . . . . . . . . . . . . . . . . . . . . . . . . . 103Appendix I: Sample Profile . . . . . . . . . . . . . . . . . . . . . . . . . . . . . . . . . . . . . . . . 107A. Responding operations . . . . . . . . . . . . . . . . . . . . . . . . . . . . . . . . . . . . . . . 107Appendix II: 1992 Census - Horses & Ponies. . . . . . . . . . . . . . . . . . . . . . . . . . . . . . . 108U.S. Inventory of Horses & Ponies on Farms & Number of Farms Reporting Horses & Ponies . . . . . 108
Part I: Regional InformationRegions for NAHMS Equine ‘98 Study . . . . . . . . . . . . . . . . . . . . . . . . . . . . . . . . . . 2Operation and equid demographics . . . . . . . . . . . . . . . . . . . . . . . . . . . . . . . . . . . . 3Use of equids. . . . . . . . . . . . . . . . . . . . . . . . . . . . . . . . . . . . . . . . . . . . . . . . 5Function of equid operations. . . . . . . . . . . . . . . . . . . . . . . . . . . . . . . . . . . . . . . . 6Equids by type (percent operations) . . . . . . . . . . . . . . . . . . . . . . . . . . . . . . . . . . . . 7Equids by type (percent equids) . . . . . . . . . . . . . . . . . . . . . . . . . . . . . . . . . . . . . . 7Horse breeds . . . . . . . . . . . . . . . . . . . . . . . . . . . . . . . . . . . . . . . . . . . . . . . . 9Resident equids . . . . . . . . . . . . . . . . . . . . . . . . . . . . . . . . . . . . . . . . . . . . . . 10Resident equids owned by operation . . . . . . . . . . . . . . . . . . . . . . . . . . . . . . . . . . . 10Fecal tests and feed or pasture and water analyses . . . . . . . . . . . . . . . . . . . . . . . . . . . . 23EIA familiarity . . . . . . . . . . . . . . . . . . . . . . . . . . . . . . . . . . . . . . . . . . . . . . 25EIA testing (percent of operations testing) . . . . . . . . . . . . . . . . . . . . . . . . . . . . . . . . 26EIA testing (percent of equids tested) . . . . . . . . . . . . . . . . . . . . . . . . . . . . . . . . . . 27EIA testing (primary reason for testing) . . . . . . . . . . . . . . . . . . . . . . . . . . . . . . . . . 28Vaccines. . . . . . . . . . . . . . . . . . . . . . . . . . . . . . . . . . . . . . . . . . . . . . . . . . 29Deworming . . . . . . . . . . . . . . . . . . . . . . . . . . . . . . . . . . . . . . . . . . . . . . . . 32Foaling location. . . . . . . . . . . . . . . . . . . . . . . . . . . . . . . . . . . . . . . . . . . . . . 36Morbidity, resident equids 6 months of age or older (percent equids). . . . . . . . . . . . . . . . . . 39Morbidity, resident equids 6 months of age or older (percent operations) . . . . . . . . . . . . . . . . 40Mortality by age, foals 3 days of age or younger. . . . . . . . . . . . . . . . . . . . . . . . . . . . . 42Mortality by age, resident equids older than 30 days of age . . . . . . . . . . . . . . . . . . . . . . . 44Mortality by cause, resident equids older than 30 days of age . . . . . . . . . . . . . . . . . . . . . . 46
Part II Regional InformationProvided in Part I for reader reference.Regions for NAHMS Equine ‘98 . . . . . . . . . . . . . . . . . . . . . . . . . . . . .Non-resident equid visitors . . . . . . . . . . . . . . . . . . . . . . . . . . . . . . . .Addition of equids to the non-resident population . . . . . . . . . . . . . . . . . . . .Health requirements for new additions . . . . . . . . . . . . . . . . . . . . . . . . . .Routine quarantine of new arrivals . . . . . . . . . . . . . . . . . . . . . . . . . . . .Domestic animal contact with equids or their feed . . . . . . . . . . . . . . . . . . . .Transportation of equids off of and returned to home operation . . . . . . . . . . . . .Destination of resident equids transported off of and returned to home operation. . . .Maximum distance resident equids traveled one way (operation average percent miles)Maximum distance resident equids traveled one way (percent operations) . . . . . . .Animal identification methods used (percent of operations) . . . . . . . . . . . . . . .Animal identification methods used (percent of resident equids) . . . . . . . . . . . .Types of dried forage/hay fed to equids . . . . . . . . . . . . . . . . . . . . . . . . .Grain/concentrate fed by source (operation average percent) . . . . . . . . . . . . . .Grain/concentrate fed by source (percent operations) . . . . . . . . . . . . . . . . . .Feed types fed during the winter . . . . . . . . . . . . . . . . . . . . . . . . . . . . .Sources of drinking water for resident equids . . . . . . . . . . . . . . . . . . . . . .Continuous access to water . . . . . . . . . . . . . . . . . . . . . . . . . . . . . . . .Availability of field or pasture for equid turnout during summer . . . . . . . . . . . .Turnout management (operation average maximum number of equids per acre) . . . .Turnout management (percent of operations by maximum number of equids per acre) .Pasturing resident equids . . . . . . . . . . . . . . . . . . . . . . . . . . . . . . . . .Pasture providing at least 90 percent of roughage for equids . . . . . . . . . . . . . .Methods used to keep equids cool . . . . . . . . . . . . . . . . . . . . . . . . . . . .Methods used to keep equids warm . . . . . . . . . . . . . . . . . . . . . . . . . . .Resident equid access to shelter or windbreak . . . . . . . . . . . . . . . . . . . . . .Stall availability. . . . . . . . . . . . . . . . . . . . . . . . . . . . . . . . . . . . . .Housing resident equids in stalls . . . . . . . . . . . . . . . . . . . . . . . . . . . . .Bedding types used . . . . . . . . . . . . . . . . . . . . . . . . . . . . . . . . . . . .Composting equine manure or waste bedding . . . . . . . . . . . . . . . . . . . . . 39395959899
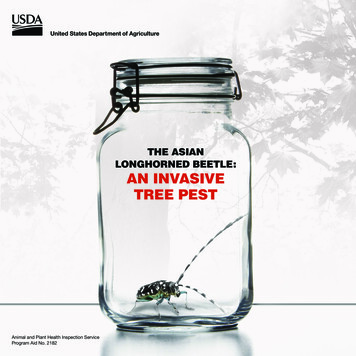
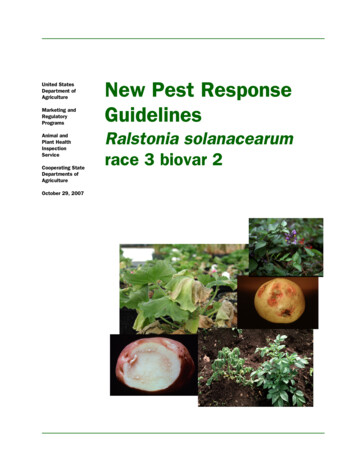
IntroductionIntroductionThe National Animal Health Monitoring System’s (NAHMS) Equine ’98 Study was designed toprovide both participants and the industry with information on the nation’s equine population foreducation and research. NAHMS is sponsored by the USDA:APHIS:Veterinary Services (VS).NAHMS developed study objectives by exploring existing literature and contacting industry membersabout their informational needs and priorities. The objectives are listed inside the back cover of thisreport.The USDA’s National Agricultural Statistics Service (NASS) collaborated with VS to select astatistically-valid sample such thatEquine '98 Participating Statesinferences can be made for all placeswith equids and for all equids in the 28states. The sample provided 2,904participating operations from 28 statesfor Equine ‘98 (see map at right andSection II for further details). The28-state target population represented78.2 percent of U.S. horses and poniesand 78.0 percent of farms with horsesand ponies (see Appendix II).Parts I and II: Baseline Reference of1998 Equine Health and Managementare the first in a series of releases#3760*documenting Equine ‘98 Study results.NASS enumerators collected data forthese reports via a questionnaire administered on-site from March 16, 1998, through April 10, 1998.Inventory data from the 133 participating race tracks were included in this report, tables A.1.a.through A.2.c., but not in other Equine ‘98 estimates.Results of the Equine ‘98, NAHMS’ first equine study and other NAHMS studies are accessible onthe World Wide Web at http://www.aphis.usda.gov/vs/ceah/cahm (menu choices: National AnimalHealth Monitoring System and Equine).For questions about this report or additional Equine ‘98 and NAHMS results, please contact:Centers for Epidemiology and Animal HealthUSDA:APHIS:VS, attn. NAHMS555 South Howes; Fort Collins, CO 80521Telephone: (970) 490-8000Internet: NAHMinfo@usda.govWorld Wide Web: ion numbers are assigned to each graph in this report for public reference.USDA:APHIS:VS1Equine ‘98
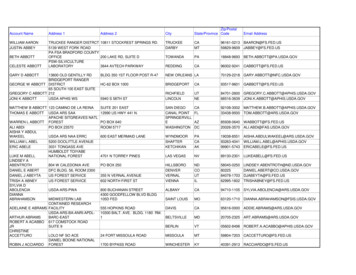
Terms Used in This ReportIntroductionTerms Used in This ReportEquid: Animal of the family Equidae. For this study, included only domestic horses, miniature horses, ponies,mules, and donkeys/burros.Horse: For this study, a domestic equid that was at least 14 hands tall when full grown.N/A: Not applicable.Operation: An area of land managed as a unit by an individual, partnership, or hired manager.Operator: The person responsible for the day-to-day decisions on the operation.Operation average: A single value for each operation is summed over all operations reporting divided by the number of operations reporting.Perceived cause (of illness or death): Causes of illnesses or deaths were derivedfrom observations of clinical signs reported by participating owners/operators andnot necessarily substantiated by a veterinarian or laboratory.Percent equids: The total number of equids with a certain attribute divided by thetotal number of equids.Percent equids on those operations: The total number of equids residing on anoperation with a given attribute, divided by the total number of equids on all operations.Examples of a95% Confidence ulation estimates: Averages and proportions weighted to represent the population. For this report, the reference population was all equine operations in the 28Standard Errors#2360selected States. Most of the estimates in this report are provided with a measure ofvariability called the standard error. Chances are 95 out of 100 that the intervalcreated by the estimate plus or minus two standard errors will contain the true population value. In the example atright, an estimate of 7.5 with a standard error of 1.0 results in a range of 5.5 to 9.5 (two times the standard errorabove and below the estimate). The second estimate of 3.4 shows a standard error of 0.3 and results in a range of 2.8to 4.0. Similarly, the 90 percent confidence interval would be created by multiplying the standard error by 1.65 instead of two. Most estimates in this report are rounded to the nearest tenth. If rounded to 0, the standard error wasthen reported. If there were no reports of the event, no standard error was reported.Ratio: The sum of one variable across all operations divided by the sum of another variable across all operations.For example, on page 13, the sum of equids on August 1, 1997, is divided by the sum of equids on January 1, 1998.The nearer to one, the more the two variables are similar.Resident equid: An equid that spent or was expected to spend more time at the operation than at any other operation. The operation was its home base.Regions for NAHMS Equine ‘98:-Western: California, Colorado, Montana, New Mexico, Oregon, Washington, and Wyoming.-Northeast: New Jersey, New York, Ohio, and Pennsylvania.-Southern: Alabama, Florida, Georgia, Kentucky, Louisiana, Maryland, Oklahoma, Tennessee, Texas, and Virginia.-Central: Illinois, Indiana, Kansas, Michigan, Minnesota, Missouri, and Wisconsin.Sample profile: Information that describes characteristics of the operations from which Equine ‘98 data were collected.Size of operation: Size groupings based on number of equids present on January 1, 1998. Size of operation wascategorized as 1-2, 3-5, 6-19, and 20 or more equids present on January 1, 1998.Equine ‘982USDA:APHIS:VS
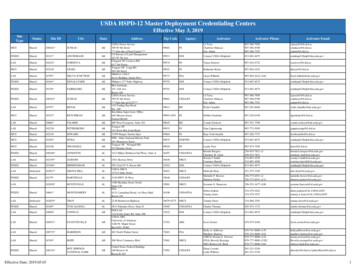
Section I: Population EstimatesA. Equine DemographicsSection I: Population EstimatesA. Equine Demographics1. All equidsEquine ‘98 estimates represent the 28 study states only. The National Agricultural Statistics Service(NASS) will publish equine inventory estimates for the U.S. in February 1999.For the 28 states in the Equine ‘98 Study, the largest percentages of operations (41.5 percent) and equids(40.1 percent) were in the Southern region. The smallest percentages were in the Northeast region (12.9percent of operations and 13.0 percent of equids).The percentage of operations paralleled the percentage of equids in each region, i.e., 12.9 percent of theoperations and 13.0 percent of the equids were in the Northeast region. These percentages reflect onlythose states included in the Equine ‘98 Study and regions as defined for reporting.a. Percent of operations and equids by region:Percent by rrorAll .8)13.0(1.1)26.2(1.6)20.7(1.6)100.0Percent of Equids by Region, 1997Central: 20.7%Northeast:13.0%Western:26.2%Shaded states participating states.Southern: 40.1%#3761aAlthough the Southern region had the largest percentage of equids (see Table A.1.a. above), theNortheast had the greatest equine density (3.1 equids per square mile).i. Number of equids per square mile by region:Number Equids by rdErrorNumberErrorNumber(0.3)1.13(0.1)1.6All (0.1)Equine ‘98
A. Equine DemographicsSection I: Population EstimatesSmaller operations (five or fewer equids) accounted for 78.6 percent of all operations and only 39.6 percent ofthe equid population. Large operations (20 or more equids) accounted for few (3.7 percent) operations but27.0 percent of equids.b. Percent of operations and equids by size of operation:Percent by Size of Operation (Number 1.4)33.4(1.8)27.0(1.9)100.020Primary Function33.7Race track 01.15.2Breeding farm33.432.629.6Other006-192020 or MoreSize of Operation (Number Equids)54.735.93.87.23.73-514.8Residence (pers. 4.53.7Boarding/Training facility44.930PercentPercent of Operations* (and Percent of All Equids on thoseOperations) by Primary Function of the Operation, 1997OperationsEquids40All OperationsStandardErrorPercent of Operations and Equidsby Size of Operation, 1997Percent20 or MoreStandardError4060Percent*With equids present on January 1, 1998.#3763#3762Operations with primary functions of boarding and/or training and breeding accounted for 3.7 and 5.2 percentof all equine operations, respectively, yet each accounted for over 10 percent of all equids, indicating theywere generally larger operations. Operations that were residences with personal use of equids accounted for54.7 percent of operations and 35.9 percent of equids.Race tracks accounted for less than 0.1 percent of operations (rounded to 0.0 in the table below) and 1.1percent of equids. Race tracks were included in estimates of the population inventory, but were not includedin health events and management estimates.c. Percent of operations (and percent of all equids on those operations) with equids present on January 1,1998, by primary function of the operation:Percent by Primary Function of sEquidsEquine ‘98PercentStand.Error3.711.4Race TrackPercentStand.Error(0.6)0.0(1.4)1.1Breeding onal VS
Section I: Population EstimatesA. Equine DemographicsFarm or ranch use of equids represented 15.2 percent of all operations. Breeding as a primary use ofequids represented 6.0 percent of operations. The categories of racing and showing/competitionrepresented a total of 8.4 percent of operations.Pleasure was the primary use of equids on the largest percentage of operations regardless of region (66.8percent). Larger percentages of operations in the Western and Southern regions used equids primarilyfor farm/ranch work (20.6 and 18.4 percent, respectively) than in the Central (8.9 percent) and Northeast(5.7 percent) regions. Outfitting, carriage horses, and teaching horses are examples of uses included inthe other category.d. Percent of operations by primary use of equids present on January 1, 1998, and region:Percent Operations by wing/competition(not 2)Breeding6.3Racing2.7Primary Use of andardError(5.3)65.59.0(3.3)(1.2)6.3(0.8)2.9All 0.0100.0100.0As the size of operation (number equids) increased, percentages of operations where pleasure was theprimary use of equids decreased. Percentages for operations where equids were primarily forshowing/competition, racing, or breeding increased along with size of operation.e. Percent of operations by primary use of equids present on January 1, 1998, and size of operation:Percent Operations by Size of Operation (Number Equids)1-2Primary Use of andardError20 or not e ‘98
A. Equine DemographicsSection I: Population EstimatesAbout one-third of operations in each region had a primary function of farm or ranch except for the Northeast(21.6 percent). Race tracks accounted for less than 0.1 percent of operations in each region (rounded to 0.0 inthe table below).f. Percent of operations with equids present on January 1, 1998, by primary function of the operation andregion:Percent Operations by RegionSouthernPrimary Functionof .0)2.9(1.2)Race track0.0(0.0)0.0(0.0)0.0(0.0)0.0(0.0)Breeding (3.3)21.6(4.6)34.9(4.3)33.3(4.1)Residence with equidsfor personal 0Roughly one-half of the boarding/training and breeding operations were in the 6 to 19 equid operation sizerange. Nearly one-half of race tracks had less than 20 equids present, which may have been due to a lack ofraces or meets occurring at the time of reporting (January 1, 1998). About one-half of the farms/ranches andresidences with equids for personal use had one or two equids present.g. Percent of operations with equids present on January 1, 1998, by primary function of the operation andsize of operation:Percent Operations by Size of Operation (Number Equids)1-2Primary Functionof OperationBoarding/training facilityPercent3-5StandardError12.0(7.5)Race track4.9Breeding farm1.1Farm/ranch50.3Residence with equids forpersonal useOtherEquine ‘98Percent6-1920 or HIS:VS
Section I: Population EstimatesA. Equine Demographics2. Type of equidsThe percentage of operations across regions with various categories of equids present was relativelyconsistent, taking into account the standard error of these estimates. Operations with horses were thelargest percentage in each region.The Southern region had a lower percentage of operations with ponies than other regions.a. Percent of operations with equids present on January 1, 1998, by type of equid and region:Percent Operations by 6)Miniature horses4.1Ponies8.9MulesDonkeys 4.8)(1.5)1.9(1.5)20.34.5(0.9)7.3(1.4)CentralAll 2(0.6)5.8(3.0)6.3(1.0)The number of horses as a percent of total equids was similar across regions. The Southern region hadthe lowest percentage (3.8 percent) of ponies (as a percent of total equids within the region) and thehighest percentage (4.0 percent) of donkeys or burros.b. Percent of equids on operations with equids present on January 1, 1998, by type of equid and region:Percent Equids by PercentStandardError88.1(1.3)88.4(2.2)Miniature s entralAll .4(1.3)2.7(0.4)Percent100.0100.07100.0100.0Equine ‘98
A. Equine DemographicsSection I: Population EstimatesMore than 85 percent of each type of equid were 18 months or older. Fewer mules than other types of equids,i.e., horses, ponies, and donkeys/burros, were less than 18 months of age.c. Percent of equids present on January 1, 1998, by age and type:Percent Equids by AgeLess than 18 Months18 Months or 00.0Miniature 4)100.0TypeDonkeys orburrosPercentStandardErrorTotalNOTE: Race tracks were not included beyond this point.For equids 18 months of age and older, miniature horses had the highest percentage of intact males, indicatingcastration was not as common a practice for male miniature horses as it was for other types of equids.Percentages of miniature horses (7.4 percent) and mules (6.8 percent) of unknown gender status were largerthan percentages for unknowns of other equid types.d. Percent of equids 18 months of age or older on January 1, 1998, by gender and type:Percent Equids by GenderIntact ----6.8(5.8)100.017.8(3.7)28.0(6.6)44.6(7.8)8.5
United States De part ment of Ag ri cul ture Ani mal and Plant Health In spec tion Serv ice Vet eri nary Serv ices Na tional Ani mal Health Moni tor ing Sys tem August 1998 Part I: