Transcription
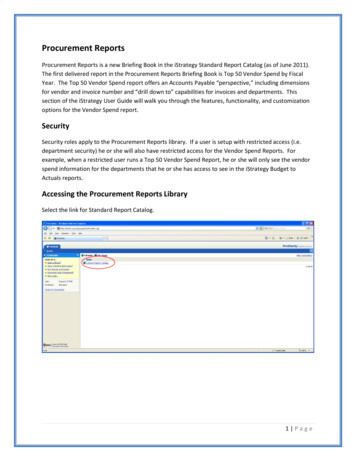
Procurement ReportsProcurement Reports is a new Briefing Book in the iStrategy Standard Report Catalog (as of June 2011).The first delivered report in the Procurement Reports Briefing Book is Top 50 Vendor Spend by FiscalYear. The Top 50 Vendor Spend report offers an Accounts Payable “perspective,” including dimensionsfor vendor and invoice number and “drill down to” capabilities for invoices and departments. Thissection of the iStrategy User Guide will walk you through the features, functionality, and customizationoptions for the Vendor Spend report.SecuritySecurity roles apply to the Procurement Reports library. If a user is setup with restricted access (i.e.department security) he or she will also have restricted access for the Vendor Spend Reports. Forexample, when a restricted user runs a Top 50 Vendor Spend Report, he or she will only see the vendorspend information for the departments that he or she has access to see in the iStrategy Budget toActuals reports.Accessing the Procurement Reports LibrarySelect the link for Standard Report Catalog.1 Page
Select the link for Procurement Reports.Currently, there is one report in this library but we will add to this as new reports are identified anddeveloped.Procurement ReportsSelect the link for Top 50 Vendor Spend by Fiscal Year.2 Page
The tabs at the top of the screen are the same tabs that appear for all reports.Note the slicer at the top of the report for Calendar Fiscal. The Budget to Actuals Report references theBudget Ref dimension, while the Calendar Fiscal references the Fiscal Year information.Click on the slicer and change the Calendar Fiscal slicer to display vendor spend for other fiscal years.3 Page
In this example, the Vendor “Sodexo” is selected. Notice that the vendor ID associated with the vendoris displayed to the right of the vendor name.Using “Drill Down To” to list invoices associated with a particular vendorWith the Vendor Sodexo (0000011652) selected, click on the Drill Down to drop-down box on the leftside and select Invoice. It is important to note that because we are looking at a different dimension(Accounts Payable) than the Budget to Actuals Reports, there may be different drill down to itemsavailable to select.4 Page
After selecting Invoice, note that the Vendor Spend Report only displays the data for the one vendor(Sodexo). The report now shows all invoices for FY2011 that make up the voucher spend amount forthis vendor.To use the breadcrumbs to get back to the Vendor Spend Report, select the link Top 50 Vendor Spendby Fiscal Year in the breadcrumbs at the top of the page. You will be brought back to the initial report.5 Page
Select the Vendor “TIAA (0000000127)”Use the Drill Down to feature again to select another dimension. Select Calendar Fiscal – Last 7 FiscalYears.6 Page
7 Page
Note that the data displayed for the Vendor “TIAA (0000000127)” is now shown for multiple FiscalYears.Drilling to DetailTo use the breadcrumbs to get back to the Vendor Spend Report, select the link Top 50 Vendor Spendby Fiscal Year in the breadcrumbs at the top of the page. You will be brought back to the initial report.8 Page
On the main report, click directly on the Voucher amount for Georgia Power (0000004165). After doingthis, a drill action will display on the bottom left of the screen under the Actions section – Drill AccountsPayable.Note: iStrategy displays the drill for Accounts Payable instead of the budget, encumbrance and actualsdrills since this is a different perspective of data than the Budget to Actual Reports.Select the Drill Accounts Payable link. Another pop-up screen will display showing the voucher linesthat make up the Voucher total for Georgia Power.In the middle of the page there is a column for Payment Info that shows the Check # related to thevoucher. Other key fields available are the voucher ID and invoice ID as well as chart field data.9 Page
Users have the option to export this data to Microsoft Excel if needed - Please see page 29 (section 5) onthe iStrategy Executive User Training Guide for tips on exporting iStrategy report data to Excel.Additional Options for Displaying Procurement ReportsView TabJust like the budget to actual reports, you can use the view tab to show a grid and/or a chart for vendorspend data.In this example, the chart shows vendor spend by year and the differences between the year. To chartthis data, select the View tab and then select the Grid and Chart option on the left side of the screen.10 P a g e
Sort TabBy default, the data on the Vendor Spend report is sorted high to low. However, to sort the datadifferently, select the Sort tab at the top of the screen.On the left side of the screen, change the sort option from No Sort to Voucher.11 P a g e
You are then prompted to select how to sort the data. For this example, the sort order is Low to High.Click the Apply button (flashing).12 P a g e
The data now displays from low to high.Filter TabThe Filter tab allows users to change the number of vendors that display on the Vendor Spend report. Inthis example, we ran the Top 50 Vendor Spend by Fiscal Year report and selected the Filter tab at thetop of the screen.On the left side of the screen, note that the criteria is already entered by the developer to display thetop 50 rows by voucher.13 P a g e
To modify the report to show only the top 10 vendors, change the in the top number from 50 to 10 andthen select the Apply button.The report now shows the top 10 vendors.Other filtering options exist to show different views of the report.In this example, we want vendors whose voucher spend is above 100,000 for the fiscal year. To seethis data, change the Filter 1 criteria from Top to Above and then enter 100000 in the is above line.Click Apply.14 P a g e
The report now shows vendors whose voucher spend is above 100,000 for the selected Fiscal Year.Customizing the Vendor Spend ReportThe Data Layout tab is used similarly in Vendor Spend reports as it is in Budget to Actuals reports. Inboth reports, users have the option to customize the report to fit their preferences.To customize the report, select the Data Layout tab at the top of the screen.15 P a g e
Edit FunctionalityTo edit the vendor information in the Data Layout tab, make sure the vendor is highlighted in the rowssection and click on the Edit button.16 P a g e
Expand the vendor dimension and scroll down to find vendors you wish to display on the report.As an alternative users can search by Vendor Name and/or Vendor ID to quickly identify a vendor usingthe Search tab.In this example, select the Search tab and type in the vendor name “Stap” and click the “Go” button.Note: iStrategy is not case sensitive, so the same results will show for “STAP,” “stap,” or “Stap.”17 P a g e
Next, select the Remove button. This will clear out the Show in View section.18 P a g e
Then select the Staples vendor. Click the Add button.Alternately, a user can also search by Vendor ID by following the same steps.19 P a g e
Select OK.The report will show just the vendor spend for Staples.20 P a g e
Add another vendor to the report by selecting the Edit button again.For this example, click on the Search tab and type in “hewle.” Results should come back to display thevendor “Hewlett-Packard.” Or, type “hp” to make sure that all Hewlett Packard vendors are covered inthe search.21 P a g e
22 P a g e
Once the vendor information returns in the search engine, click the Add All button and select OK.The report now shows data for Hewlett-Packard and Staples.23 P a g e
Continuing with this example, we will customize the report to see the spend data for these vendors formultiple fiscal years. To do this, we must remove the slicer for fiscal year and make it a dimension in thecolumns section - this is called nesting.First, go to the Data Layout page and find the Calendar Fiscal Dimension. In this example, it is in theBackground section on the left side of the page. Select the Calendar Fiscal Dimension and click the Upbutton.This will move the dimension from the Background section to the Columns section. Click the Applybutton.24 P a g e
The Fiscal Year slicer has been removed and the data is now displayed for multiple fiscal years from2012 to 2006.For this example, we also want to add the invoices that make up the voucher spend to this report. Thisinvolves nesting to show the vendor and the invoice in the same section.First, scroll down in the Background section and select Invoice.25 P a g e
Once invoice is selected, click on the Rows heading above the Vendor dimension. This will move theinvoice up to the Rows section with the Vendor. Note: This is an alternative to using the Up button.When the Invoice is in the Rows section, click the Apply button.26 P a g e
The report now shows all invoices for the vendors Hewlett Packard and Staples for multiple fiscal years.Note: To expand all invoices, select the (Expand) just to the left of All Invoices. This expands theinvoices to show the report by Invoice ID.27 P a g e
You may preserve this report for future use by selecting the Save to My Views icon.Type a name for the report and click Save.28 P a g e
Users have the option to export this data to Microsoft Excel if needed - Please see page 29 (section 5) on the iStrategy Executive User Training Guide for tips on exporting iStrategy report data to Excel. Additional Options for Displaying Procurement Reports View Tab Just like the budget to actual reports, you can use the view tab to show a grid and/or a chart for vendor spend data. In this .