Transcription
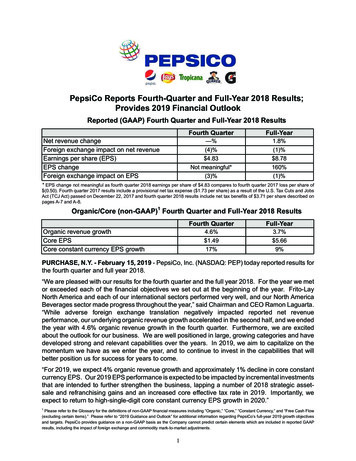
PepsiCo Reports Fourth-Quarter and Full-Year 2018 Results;Provides 2019 Financial OutlookReported (GAAP) Fourth Quarter and Full-Year 2018 ResultsNet revenue changeForeign exchange impact on net revenueEarnings per share (EPS)EPS changeForeign exchange impact on EPSFourth QuarterFull-Year—%1.8%(4)% 4.83Not meaningful*(3)%(1)% 8.78160%(1)%* EPS change not meaningful as fourth quarter 2018 earnings per share of 4.83 compares to fourth quarter 2017 loss per share of (0.50). Fourth quarter 2017 results include a provisional net tax expense ( 1.73 per share) as a result of the U.S. Tax Cuts and JobsAct (TCJ Act) passed on December 22, 2017 and fourth quarter 2018 results include net tax benefits of 3.71 per share described onpages A-7 and A-8.1Organic/Core (non-GAAP) Fourth Quarter and Full-Year 2018 ResultsOrganic revenue growthCore EPSCore constant currency EPS growthFourth QuarterFull-Year4.6% 1.493.7% 5.6617%9%PURCHASE, N.Y. - February 15, 2019 - PepsiCo, Inc. (NASDAQ: PEP) today reported results forthe fourth quarter and full year 2018.“We are pleased with our results for the fourth quarter and the full year 2018. For the year we metor exceeded each of the financial objectives we set out at the beginning of the year. Frito-LayNorth America and each of our international sectors performed very well, and our North AmericaBeverages sector made progress throughout the year,” said Chairman and CEO Ramon Laguarta.“While adverse foreign exchange translation negatively impacted reported net revenueperformance, our underlying organic revenue growth accelerated in the second half, and we endedthe year with 4.6% organic revenue growth in the fourth quarter. Furthermore, we are excitedabout the outlook for our business. We are well positioned in large, growing categories and havedeveloped strong and relevant capabilities over the years. In 2019, we aim to capitalize on themomentum we have as we enter the year, and to continue to invest in the capabilities that willbetter position us for success for years to come.“For 2019, we expect 4% organic revenue growth and approximately 1% decline in core constantcurrency EPS. Our 2019 EPS performance is expected to be impacted by incremental investmentsthat are intended to further strengthen the business, lapping a number of 2018 strategic assetsale and refranchising gains and an increased core effective tax rate in 2019. Importantly, weexpect to return to high-single-digit core constant currency EPS growth in 2020.”1Please refer to the Glossary for the definitions of non-GAAP financial measures including “Organic,” “Core,” “Constant Currency,” and “Free Cash Flow(excluding certain items).” Please refer to “2019 Guidance and Outlook” for additional information regarding PepsiCo’s full-year 2019 growth objectivesand targets. PepsiCo provides guidance on a non-GAAP basis as the Company cannot predict certain elements which are included in reported GAAPresults, including the impact of foreign exchange and commodity mark-to-market adjustments.1
Summary Fourth Quarter 2018 PerformanceRevenueGAAPReported% ChangeVolumePercentage Point Exchangeand OtherTranslationChanges*Organic Volume % GrowthOrganic% ———(0.5)2——2Latin l—4151—NAB(1)* Includes acquisitions, divestitures and other structural changes, as well as sales and certain other taxes. See A-6 and A-8for additional information.Operating Profit and EPSGAAPReported% ChangePercentage Point anslationCore ConstantCurrency% ChangeFLNA8(1)—7QFNA5(2)—3(12)5—(7)Latin e m - not meaningfulNote: Rows may not sum due to rounding.* EPS change not meaningful as fourth quarter 2018 earnings per share of 4.83 compares to fourth quarter 2017 loss per share of (0.50). Fourth quarter 2017 results include a provisional net tax expense ( 1.73 per share) as a result of the TCJ Act passed onDecember 22, 2017 and fourth quarter 2018 results include net tax benefits of 3.71 per share described on pages A-7 and A-8.Organic revenue and core constant currency results are non-GAAP financial measures. Please refer to the reconciliation of GAAPand non-GAAP information in the attached exhibits and to the Glossary for definitions of “Organic,” “Core” and “Constant Currency.”2
Summary of Fourth Quarter Financial Performance: Reported fourth-quarter and year-ago results were impacted by the following items which areexcluded from core results. See A-6 to A-8 for further details.Merger and integration charges,charges related to bond cash tender and exchange offers,2018 net tax benefit and 2017 provisional net tax expense related to the TCJ Act,other net tax benefits resulting from the reorganization of our international operations,a non-cash state tax benefit resulting from our resolution with the Internal Revenue Serviceof all open matters related to the audits of taxable years 2012 and 2013 (the 2012 and 2013audit resolution),restructuring charges, andcommodity mark-to-market net impacts. Reported net revenue was even with the prior year. Foreign exchange translation had a 4-percentagepoint unfavorable impact on reported net revenue performance and acquisitions and divestitureshad an unfavorable impact of 1 percentage point. Organic revenue, which excludes the impacts offoreign exchange translation, acquisitions, divestitures, structural and other changes, grew 4.6percent. Reported gross margin expanded 75 basis points and core gross margin expanded 90 basis points.Reported operating margin contracted 70 basis points and core operating margin expanded 55 basispoints. Reported operating profit decreased 5 percent and core constant currency operating profit increased7 percent. Commodity mark-to-market net impacts and restructuring charges negatively impactedreported operating profit performance by 5 percentage points and 1 percentage point, respectively.The impact of merger and integration charges related to the acquisition of SodaStream InternationalLtd. (SodaStream) and the prior year gain from the refranchising of a portion of our bottling operationsin Jordan negatively impacted reported operating profit performance by 3 percentage points and 5percentage points, respectively. A gain from the refranchising of our entire beverage bottlingoperations and snack distribution operations in Czech Republic, Hungary and Slovakia (CHS)positively impacted reported operating profit performance by 2 percentage points. Unfavorableforeign exchange translation reduced reported operating profit performance by 3 percentage points. The reported effective tax rate in the fourth quarter of 2018 was (254.8) percent and the core effectivetax rate was 17.9 percent. The reported and core effective tax rates in the fourth quarter of 2017were 129.8 and 25.0 percent, respectively. The fourth quarter 2018 reported effective tax rate reflectsnet tax benefits of 5.3 billion, collectively, associated with net tax benefits resulting from thereorganization of our international operations, a net tax benefit related to the TCJ Act and a noncash state tax benefit from the 2012 and 2013 audit resolution. The fourth quarter 2017 reportedeffective tax rate reflects the impact of the provisional net tax expense of 2.5 billion as a result of3
the TCJ Act. Reported EPS was 4.83, an increase from the 0.50 loss per share in the fourth quarter of 2017.Foreign exchange translation negatively impacted reported EPS growth by 3 percentage points. Core EPS was 1.49. Excluding the impact of foreign exchange translation, core constant currencyEPS increased 17 percent (see schedule A-11 for a reconciliation to reported EPS, the comparableGAAP measure). Net cash provided by operating activities was 4.7 billion.4
Discussion of Fourth Quarter 2018 Reported Division Results:Frito-Lay North America (FLNA)Operating profit grew 8%, reflecting net revenue growth and productivity savings, partially offset by certainoperating cost increases.Quaker Foods North America (QFNA)Operating profit grew 5%, reflecting productivity savings and lower advertising and marketing expenses,partially offset by certain operating cost increases and a 5-percentage-point impact of higher commoditycosts.North America Beverages (NAB)Operating profit declined 12%, reflecting certain operating cost increases, including increased transportationcosts, a 9-percentage-point impact of higher commodity costs and higher advertising and marketingexpenses. These impacts were partially offset by net revenue growth, productivity savings and a 4percentage-point impact of prior-year hurricane-related costs.Latin AmericaOperating profit grew 9%, reflecting effective net pricing and productivity savings, partially offset by certainoperating cost increases, a 20-percentage-point impact of primarily foreign exchange-driven highercommodity costs and higher advertising and marketing expenses. Unfavorable foreign exchange reducedoperating profit growth by 6 percentage points.Europe Sub-Saharan Africa (ESSA)Operating profit grew 23%, reflecting effective net pricing, productivity savings, volume growth, a 15percentage-point net impact of refranchising our entire beverage bottling operations and snack distributionoperations in CHS and a 6-percentage-point impact of the sale of a portion of our water business in Russia.These impacts were partially offset by certain operating cost increases and a 19-percentage-point impactof primarily foreign exchange-driven higher commodity costs. Unfavorable foreign exchange reducedoperating profit growth by 15 percentage points.Asia, Middle East and North Africa (AMENA)Operating profit declined 46%, reflecting a 45-percentage-point impact of refranchising a portion of ourJordan beverage business in 2017, certain operating cost increases, higher advertising and marketingexpenses and a 4-percentage-point impact of higher commodity costs. These impacts were partially offsetby productivity savings and effective net pricing.5
Summary Full-Year 2018 PerformanceRevenueVolumePercentage Point ImpactOrganic Volume % GrowthGAAPReported% titures,Structural,and )NAB1——0.5Latin talOrganic% ChangeSnacksBeverages(1)* Includes acquisitions, divestitures and other structural changes, as well as sales and certain other taxes. See A-6 and A-8for additional information.Operating Profit and EPSGAAPReported% ChangePercentage Point ImpactItemsForeignAffectingExchangeComparability TranslationCore ConstantCurrency% tin America13(2)213ESSA45311AMENA93(1)11Corporate Note: Rows may not sum due to rounding.Organic revenue and core constant currency results are non-GAAP financial measures. Please refer to the reconciliation of GAAP andnon-GAAP information in the attached exhibits and to the Glossary for definitions of “Organic,” “Core” and “Constant Currency.”6
Summary of Full-Year 2018 Financial Performance: Reported full-year 2018 and 2017 results were impacted by the following items which are excludedfrom core results. See A-6 to A-8 for further details.Merger and integration charges,charges related to bond cash tender and exchange offers,2018 net tax benefit and 2017 provisional net tax expense related to the TCJ Act,other net tax benefits resulting from the reorganization of our international operations,non-cash tax benefits resulting from the conclusion of certain international tax audits and the2012 and 2013 audit resolution,restructuring charges, andcommodity mark-to-market net impacts. Reported net revenue increased 2 percent. Foreign exchange translation and acquisitions anddivestitures each had an unfavorable impact of 1 percentage point. Organic revenue, which excludesthe impacts of foreign exchange translation, acquisitions, divestitures, structural and other changes,grew 4 percent. Reported gross margin contracted 10 basis points and core gross margin expanded 5 basis points.Reported operating margin contracted 55 basis points and core operating margin contracted 10 basispoints. Reported operating profit decreased 2 percent and core constant currency operating profit increased2 percent. Commodity mark-to-market net impacts and merger and integration charges related toour acquisition of SodaStream negatively impacted reported operating profit performance by 2percentage points and 1 percentage point, respectively. Restructuring charges had a nominal impact.Foreign exchange translation negatively impacted reported operating profit performance by 0.5percentage points. The reported effective tax rate in 2018 was (36.7) percent and core effective tax rate was 18.8percent. The reported and core effective tax rates in 2017 were 48.9 and 23.3 percent, respectively.The 2018 reported effective tax rate reflects the impacts of 4.3 billion of net tax benefits resultingfrom the reorganization of our international operations, 717 million of non-cash tax benefits resultingfrom both the favorable conclusion of certain international tax audits and the 2012 and 2013 auditresolution and a 28 million net tax benefit related to the TCJ Act. Reported EPS was 8.78, an increase of 160 percent. Foreign exchange translation negativelyimpacted reported EPS growth by 1 percentage point. Core EPS was 5.66, an increase of 8 percent. Excluding the impact of foreign exchange translation,core constant currency EPS increased 9 percent (see schedule A-12 for a reconciliation to reportedEPS, the comparable GAAP measure). Net cash provided by operating activities was 9.4 billion. Free cash flow (excluding certain items)was 7.6 billion.7
Discussion of Full
Jordan beverage business in 2017, certain operating cost increases, higher advertising and marketing expenses and a 4-percentage-point impact of higher commodity costs. These impacts were partially offset by productivity savings and effective net pricing. 6 Summary Full-Year 2018 Performance Revenue Volume GAAP Reported % Change Percentage Point Impact Organic % Change Organic Volume %
