Transcription
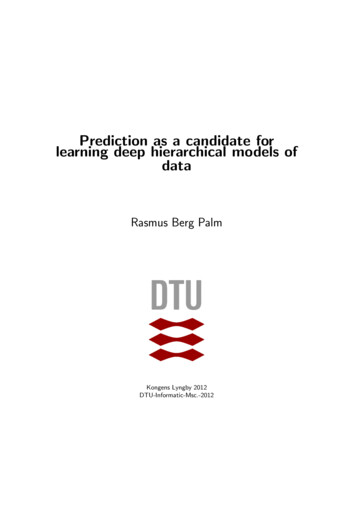
2304IEEE ROBOTICS AND AUTOMATION LETTERS, VOL. 6, NO. 2, APRIL 2021FusionVLAD: A Multi-View Deep Fusion Networksfor Viewpoint-Free 3D Place RecognitionPeng Yin , Lingyun Xu , Ji Zhang, and Howie ChosetAbstract—Real-time 3D place recognition is a crucial technologyto recover from localization failure in applications like autonomousdriving, last-mile delivery, and service robots. However, it is challenging for 3D place retrieval methods to be accurate, efficient, androbust to the variant viewpoints differences. In this letter, we propose FusionVLAD, a fusion-based network that encodes a multiview representation of sparse 3D point clouds into viewpoint-freeglobal descriptors. The system consists of two parallel branches: aspherical-view branch for orientation-invariant feature extraction,and the top-down view branch for translation-insensitive featureextraction. Furthermore, we design a parallel fusion module toenhance the combination of region-wise feature connection betweenthe two branches. Experiments on two public datasets and two generated datasets show that our method outperforms state-of-the-artwith robust place recognition accuracy and efficient inference time.Besides, FusionVLAD requires limited computation resources andmakes it extremely suitable for low-cost robots’ long-term placerecognition task.Index Terms—Recognition, SLAM, visual learning.I. INTRODUCTIONAPPING and localization are fundamental capabilitiesfor mobile robotics, and researchers have extensivelystudied this area over the past two decades. In many robotapplications such as autonomous vehicles, search-rescue robots,delivery robots, and warehouse automation, localization failurescan cause severe problems in navigation and decision making,which requires an accurate and real-time 3D place recognition.However, it remains a challenging task in many real scenarios,especially in complex outdoor and GPS-denied environments.Generally, 3D place recognition is considered as a searchingproblem to find the most similar place on the map by measuringthe similarity of correspondences.Recent studies on 3D feature learning (PointNet [1], PointNet [2]) have brought light to the 3D place recognitiontask. PointNet-based place recognition methods, such as PointNetVLAD [3], LPDNet [4], PCAN [5], can extract place descriptors directly from the 3D point cloud, which allows them toachieve robust place recognition performance on public datasets.This direct matching is either robust but intractable on the mobileplatform, or optimized for efficiency but fragile. The mainMManuscript received September 22, 2020; accepted January 5, 2021. Date ofpublication February 23, 2021; date of current version March 12, 2021. Thisletter was recommended for publication by Associate Editor F. Fraundorfer andEditor S. Behnke upon evaluation of the reviewers’ comments. (Correspondingauthor: Lingyun Xu.)The authors are with the Robotics Institute, Carnegie Mellon University, Pittsburgh, PA 15213 USA (e-mail: pyin2@andrew.cmu.edu;hitmaxtom@gmail.com; zhangji@cmu.edu; choset@cs.cmu.edu).Digital Object Identifier 10.1109/LRA.2021.3061375Fig. 1. Fusion enhanced place recognition. We generate multi-view projections from 3D point cloud, which are then fed into the proposed FusionVLADnetwork to extract global descriptors. Different projections (spherical view,top-down view) can capture different perspectives of the original 3D map.drawback of PointNet-based methods is that they are sensitive toorientation differences, which are the typical situations in largescale place recognition tasks. As depicted in Fig. 1, long-termodometry drift will introduce massive orientation differences.In this letter, we propose FusionVLAD, a parallel fusionnetwork structure to learn the point cloud representations frommulti-view projections, and embed them into viewpoint-freelow-dimensional place descriptors for efficient global recognition. As depicted in Fig. 1, FusionVLAD includes two parallelbranches: the spherical-view encoding (SVE) branch and topdown view encoding (TVE) branch. As we can see in Fig. 2,the SVE branch can encode the spherical projections into anorientation-invariant feature descriptor. In the top-down viewperspective, it has a higher tolerance to local translation differences, which benefits our TVE branch for translation-insensitivefeature extraction. To further enhance the extracted place descriptor inherits orientation- and translation- invariant properties, we design a “parallel fusion” layer between SVE and TVE,which enables the end-to-end training and inferencing for theglobal place descriptors.The key contributions of this letter are summarized as follows:r We propose a viewpoint-free 3D place recognition system, FusionVLAD. Compared with current state-of-the-artmethods, our method show better place recognition abilityin most cases under variant viewpoint differences.2377-3766 2021 IEEE. Personal use is permitted, but republication/redistribution requires IEEE permission.See l for more information.Authorized licensed use limited to: Carnegie Mellon Libraries. Downloaded on May 26,2021 at 16:03:54 UTC from IEEE Xplore. Restrictions apply.
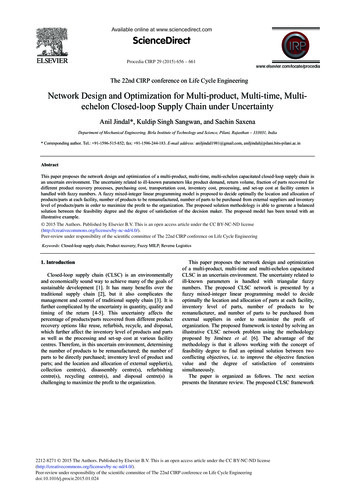
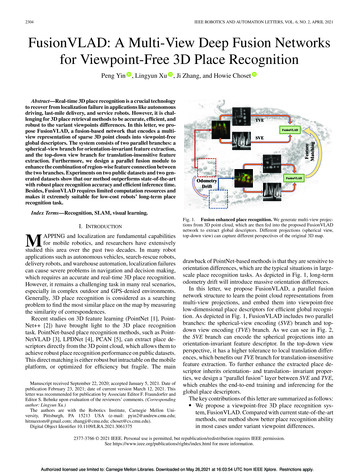
YIN et al.: FusionVLAD: A MULTI-VIEW DEEP FUSION NETWORKS FOR VIEWPOINT-FREE 3D PLACE RECOGNITIONFig. 2. Different representations from local dense map. Second and thirdrow represent the same area under locally translation or orientation differencerespectively. Different columns show the dense local map, the top-down and thespherical projections.r We design a parallel multi-views fusion network, which cansimultaneously encode spherical and top-down projectionsfor robust place description learning.r Based on traditional triplet loss in place recognition, wedesign a lazy viewpoint-free metric to enhance the learntdescriptors to viewpoint-invariant place recognition.r We design the experiments with both public and selfrecorded datasets to evaluate the place recognition performance of our method under variant translational androtational differences.Notably, with public odometry datasets and collected datasetsfrom our hardware platform, the experiment results show thatour method is remarkably more robust to viewpoint differencesthan other methods. Additionally, our FusionVLAD consumesless GPU memory and can inference each place within 18 ms,making it suitable for low-cost robot systems in large-scalemapping applications.II. RELATED WORKPlace recognition has been widely applied in SLAM andnavigation tasks. In this letter, we focus on 3D LiDAR-basedlarge-scale place recognition. In this section, we will brieflyreview the relative works for 3D place recognition.Unlike SIFT [6] and SURF [7] in image fields, handcraftedfeatures for the 3D point-cloud did not achieve great success.Distance and angle based feature ESF [8], structure basedScan-Context [9], and histogram-based feature SHOT [10] areboth focused on local areas and not suitable for extracting globaldescriptors. Fast Histogram [11] uses a histogram to representthe entire point-cloud distribution. M2DP [12] projects all pointsto several planes, and they can obtain a global descriptor. Thesemethods are robust to the orientation differences but sensitive tothe translation differences.Traditional LiDAR-based place recognition methods [13]usually rely on a global, off-line, high-resolution map, andcan achieve centimeter-level localization, but at the cost oftime-consuming off-line map registration and data storage requirements. Recently, learning-based point-cloud descriptorshave shown outstanding performance and gradually replacinghandcrafted features. Instead of extracting raw LiDAR points2305in the current scan for geometry matching, SegMatch [14]proposed a matching-by-segmentation method where static objects are segmented out as landmarks to reduce the matchingcomplexity. However, the 3D point-level segmentation processis computational expensive and the assumption of enough staticobjects is not always a satisfied in the real world. Based onthe PointNet-based [1], [2] feature learning techniques, recent3D place recognition approaches [3]–[5] have made significantprogress. In [3], the authors combined the feature extractionability of PointNet [1] and VLAD-based [15] feature aggregation to obtain translation-invariant 3D place descriptor. Compared with traditional approaches, the extracted features fromPointNetVLAD [3] is robust to locally translation differences.Based on Mikaela’s work, LPDNet [4] further improved placerecognition accuracy by enhancing the local feature extractionability with PointNet [2], which is designed to capture different scaled point features. PCAN [5] further improve the placerecognition accuracy by modifying the VLAD layer with additional attention module, which can evaluate the point weightingin the feature aggregation.III. PROPOSED METHODAs shown in Fig. 3, our method include two modules: amulti-view generation to obtain different perspectives, and thedeep fusion network to deeply fuse the multi-view featuresinto a global place descriptor. The single LiDAR scan mayeffect the place recognition accuracy, our multi-view generationmodule can generate dense and stable top-down and sphericalprojections by accumulate LiDAR scans and taking account ofupdating noises. Different projections share different properties.Fig. 2 shows the geometry changes of the dense local map,top-down view and spherical-view, under locally translation ororientation differences. As we can see that, under the local translation difference, the geometry structure of top-down views arerelative stable than spherical-views; with orientation difference,the geometry changes in spherical-view will not change thelocal feature extraction via convolution networks, while it willaffect the feature extraction in the top-down view branch. Ourfusion operation can enhance the learnt feature capturing bothtranslation-insensitive propriety of top-down view features androtation-invariant propriety of spherical-view features.A. Multi-View GenerationWe utilize the octree structure to cache the local map. Following the original Octomap [16], we apply a log-odds functionL(n) to describe a probability distribution P (n), n R3 , whereP (n)we have L(n) log[ 1 P(n) ]. As stated in [16], if the initialoccupancy P (n) is set to 0.5, the log-odds L(n z1:t ) can beestimated by,L(n z1:t ) L(n z1:t 1 ) L(n zt )(1)In the measurement updating step, observation uncertaintymay introduce additional occupancy noise. We cope with suchnoise by modifying the log-odds updating function. For eachnode updating factor L(n zt ), we define a weighting functionW(zt pt , qpt ) to measure the points’ dynamic property,W(zt pt , pt 1 ) 122 e pt qpt /2σσ 2πAuthorized licensed use limited to: Carnegie Mellon Libraries. Downloaded on May 26,2021 at 16:03:54 UTC from IEEE Xplore. Restrictions apply.(2)
2306IEEE ROBOTICS AND AUTOMATION LETTERS, VOL. 6, NO. 2, APRIL 2021Fig. 3. The network structure of our method. Our FusionVLAD mainly includes two modules: Multi-view Generation module and Deep Fusion Networksmodule. With the given sequence of LiDAR scans, the first module can generate multi-view representations with the consideration of observation and odometryerrors. The Deep Fusion Networks can parallel encode the top-down view and spherical-views, and tightly coupled the output features.where pt is point within current LiDAR scan ST , and qpt is thenearest point of pt in the last LiDAR scan ST 1 , σ is a constantparameter. The original log-odds updating function Eq. (1) istransformed into,L(n z1:t ) L(n z1:t 1 ) L(n zt ) · W(zt pt , qpt )(3)In the motion updating step, the occupancy of each leaf node(from map MT 1 to map MT ) is updated with a motion errormodel N (0, σT ). The covariance σtp can be evaluated based onthe LiDAR odometry [13] estimation. Thus, we can update thelog-odds during the motion updating step byL(n z1:t ) L(n z1:t ) · NM (0, σtp )(4)The above mechanisms enhance the robot setting a higherbelief when the observation is relative accurate and odometry ismore stable, or lower belief on the contrary. Then, as shown inFig. 2 we can generate multi-view representation by projectingthe 3D point-cloud from the octree map into the top-down viewand the spherical-view respectively.1) Top-Down View Projection: The top-down view projection is encoded with height and intensity values, where theintensity can reflect the materials’ properties. To avoid the pitchand roll difference in top-down projections, we first estimate themajor 2D plane on the z-axis via RANSAC [17], and project the3D points onto the major plane with 1 m resolution level. Foreach grid on the 2D plane, we use the maximum height of thepoints within this grid as the height feature, and average intensityas the intensity feature.2) Spherical View Projection: For the spherical projections,we encode the geometry information on the spherical-views.However, different from single LiDAR scan, the point cloud weused are cached into a dense 3D map via the octree data structure.Given a 3D point p (x, y, z), the relative Zenith and Azimuthangle on the spherical-view can be estimated by,RZ arctan(y, x) RA arctan(z, x2 y 2 )(5)(6)Within the same range of spherical projection, we may encounter points with different distances. To capture more abundant geometric structures from the 3D environment, the pointcloud is divided equally into M slices based on the points’ranges. In our current configuration, the maximum point’s distance is 30 meters and M 5. Thus the points within range0 6 are projected on m1 , and points within range 24 30are projected on m5 . Similar to [18], given a desired resolutionK, we generate the 3D grids with size of [K K M ]. Onthe grid (RZ i , RAj ), we set d(RZ i , RAj ) as distance to nearestpoints within this grid. We also compute the angle α(RZ i , RAj )between the ray and the surface normal at the intersecting face.Thus, for each grid, we get two channels to extract the geometricfeatures on the spherical view.B. Deep Fusion NetworksThe overall of our FusionVLAD network is shown in Fig. 3.We use two separate 2D convolution networks to extract the localfeatures. Both top-down view ([K K 2]) and sphericalview ([K K M 2]) are fed into the convolution layers.In our application, we set K 64 and M 5. In both thespherical-view encoding (SVE) and the top-down view encoding(TVE) branch, the convolution operation for each branch arefollowing the convolution layers in VGG16. By utilizing theVLAD layer [15], we extract the 512-dimension place featuresfrom top-down view (ftop ) and Spherical view (fsph ) separately.To combine information from different representations, we design a tightly coupled fusion network between the top-downand spherical views. As we can see in Fig. 3, with the extractedplace features from different perspectives, we obtain the joint0feature fjointby applying the fully connected layer F C1 onthe concatenate features [ftop , fsph ]. Based on the joint feature022, we utilize two fully connected layer F Ctopand F Csphfjointto estimate the feature mapping function Ftop (fˆtop ftop , fsph )and Fsph (fˆsph ftop , fsph ). To keep the recognition property intop-down and spherical feature respectively, we use the same22and F Csphinshared weights fully connected networks F Ctopthe top-down and spherical branches respectively. For the fully1211connected networks F Ctop, F Ctop, F Csphand F Csph, both input and output filter size is 512. For the fully connected networksF Cf1usion , F Cf2usion , they have the same input filter at 1024,but different output filter sizes (1024 and 512 respectively).Learning place descriptor differences from the joint featuredistributions [ftop , fsph ] is more complicated than from isolatedperspectives. In the training procedure, our share-weights fullyAuthorized licensed use limited to: Carnegie Mellon Libraries. Downloaded on May 26,2021 at 16:03:54 UTC from IEEE Xplore. Restrictions apply.
YIN et al.: FusionVLAD: A MULTI-VIEW DEEP FUSION NETWORKS FOR VIEWPOINT-FREE 3D PLACE RECOGNITION2307where α is constant threshold to control the relative margin. Thusthe “lazy viewpoint” loss function LLazyV iew can be written as,LLazyV iew LLazyT rans LLazyRotFig. 4. Lazy Viewpoint-free metric enhance place feature learning. Theproposed “lazy viewpoint” loss can enhance the margin ψ between the queryframe and rotated-query frames, and the margin α between the positive frames(with small translation difference) and negative frames (with large translationdifference).connected layers can build the inter-connections between theisolated top-down/spherical feature distribution and joint featuredistribution. In the next section, we will introduce the metricloss that helps the fusion branch learn viewpoint-invariant placedescriptors.C. Lazy Viewpoint Learning MetricWe propose a novel supervision objective Lazy viewpoint-freeloss metric to learn the viewpoint-invariant and distinguishableplace descriptors. For convenience of illustrating the loss functions, some necessary definitions are first described in following.As we can see in Fig. 4, each training tuple consists of fourcomponents: S [Sq , {Srot }, {Spos }, {Sneg }}], where Sq isthe query frame of a local 3D scan, {Srot } is the rotatedquery set obtained by rotating Sq with random heading angles([0 , 30 , . . .330 ]). Similar to the PointNetVLAD [3], {Spos }denotes a set of local map representations of 3D scans (“positive”) whose mapping center to {Sq } is within 5 m; and {Sneg }denotes a set of 3D scans (“negative”) whose mapping center to{Sq } is beyond 10 m. To reduce feature difference between Sqand Srot , we define the following “lazy rotation” triplet loss,LLazyRot (S)ij)) d(f (Sq ), f (Spos)) max([ψ d(f (Sq ), f (Sroti,jij max([ψ δrot δpos] )i,j(7)here f (.) is the function that encodes LiDAR representationsinto the global descriptors. d(·) denoted the squared Euclideandistance between features, and [.] denotes the hinge loss. ψ is aconstant parameter to mark corresponding margin between Srotand Spos . The above triplet loss LLazyRot can also combine withijik), f (Spos)) and d(f (Srot), f (Sneg)) to further extendd(f (Srotthe orientation-invariant property. Similarly to NetVLAD [15],we also apply a transitional triplet loss to reduce feature difference between f (Sq ) and f (Spos ) by,LLazyT rans (S)ij)) d(f (Sq ), f (Sneg)) max([α d(f (Sq ), f (Sposi,jij max([α δpos δneg] )i,j(8)(9)In the training procedure, we can train the FusionVLAD inthe deep version: applying the “lazy viewpoint” loss eitherall branches (top-down view-, spherical view-, and fusionbranches); or non-deep version: only applying the “lazy viewpoint” loss on the Fusion branch. In the experiment part, wewill investigate the performance of different FusionVLAD configurations. We use the Adam as the optimizer with the initiallearning rate at 1e 4.IV. EXPERIMENTSIn this section, we compare the proposed method with thecurrent state-of-the-art in learning-based 3D place recognition on both public and self-recorded datasets. To generateour datasets, we designed a data recording mobile platform.The platform contains a LiDAR device (Velodyne-VLP 16),an inertial measurement unit (Xsense MTi 30, 0.5 error inroll/pitch, 1 error in yaw, 550 mW), a mini PC (Intel NUCi7, 3.5 GHz, 28 W) and an embedded GPU device (NvidiaXavier, 8 G memory). We trained our network model on a GPUserver with a Ubuntu 18.04 system with a single Nvidia 1080TiGPU and 64 G RAM. In the rest of this section, we will firstdescribe both the public and self-recorded datasets. Then weanalyze the place recognition performance and efficiency of ourmethods, other state-of-the-art learning-based methods [3]–[5],and non-learning based methods [10], [12], [19], [20]. Finally,in the ablation study section, we also analyze our methods’performance under different network configurations.Datasets: Our evaluation datasets include two public datasetsand two self-recorded datasets:r KITTI odometry datasets, which consists of 21 trajectoriesgenerated with Velodyne-64 LiDAR scanner, around themid-size city of Karlsruhe. We use trajectory {1 8} fornetwork training, and {9, 10} for evaluation.r NCLT datasets, which consists of 103 trajectories generated with Velodyne-32 LiDAR scanner, around the midsize city of Karlsruhe. We use trajectory {1 8} for network training, and {9, 10} for evaluation.r Campus dataset, we created a Campus dataset with 11trajectories by driving our data generating mobile platformto traverse a 2 km outdoor route around the campus ofCarnegie Mellon University.r City dataset, we created a City-scale dataset by mountingour data generating system on the top of a car and repeatlytraversing 11 km trajectories in the city of Pittsburgh. Wecollected 12 trajectories, and we use trajectories {1 10}for network training, and {11, 12} for evaluation.To provide training/evaluation data, we first generate theglobal map with all the LiDAR sequences through a traditionalLiDAR odometry method [13]. We generate the local LiDARmaps given the ground truth trajectories on each datasets, andseparate them into training and evaluation datasets with shuffledindex. The train/inference datasets are gathered individually, andwe only train the network with the specific training dataset ineach dataset. We also prepare the corresponding position forAuthorized licensed use limited to: Carnegie Mellon Libraries. Downloaded on May 26,2021 at 16:03:54 UTC from IEEE Xplore. Restrictions apply.
2308IEEE ROBOTICS AND AUTOMATION LETTERS, VOL. 6, NO. 2, APRIL 2021TABLE IDATASET FRAMES NUMBER IN TRAINING/EVALUATION ON THE FOUR DATASETSTABLE IIPLACE RECOGNITION EVALUATION ON DIFFERENT AREAS OF CMUeach local map, which is necessary to calculate the position{Spos } and negative {Sneg } samples for each query data Sq .Table I shows the data separation in training/evaluation on thefour datasets. Especially, to verify the generalization abilityof different methods in the evaluation step, we generate thetesting data with random delta translation ([0, 2, 4, 6, 8, . . .]mon 2D–XY plane) or delta orientation ([0, 45, 90 135, . . .] inyaw) differences comparing the ground truth trajectory.On the other hand, to verify the place recognition performanceof two slightly different trajectories within the same area, we alsorecord the testing/reference sequence data from different areason the campus area as we can see in the Table II. The ground truthpositions of testing/reference sequence queries are obtained withan offline ICP-based point cloud registration method, where eachframe will take around 200 500 ms with accuracy around 0.1 0.2 m.Methods: To evaluate our approach’s performance, wefirstly compared it with the current state-of-the-art methods oflearning-based place recognition methods, PointNetVLAD [3],which are re-implied from the Github.1 For the non-learningbased method, we also compare the frame-level descriptorsFast Histogram [20] and M2DP [12] from the Github,2 and3D keypoint-based methods ESF [19] and SHOT [10] in thePCL library. For all the above approaches, we provide the denselocal maps generated by our local mapping module, as shownin Section III-A. For the all the learning-based method, we usethe same data configuration on each datasets and same trainingepochs, and training the new network models on each of fourdatasets. To inference different real trajectories in the Campus(Table II), we use the pre-trained model on the joint Campusdataset.Evaluation Manners and Metrics: We evaluate the placerecognition accuracy under two different matching manners:single-scan and sequence-scan based place recognition. Thefirst manner retrieves corresponding places by evaluating featuresimilarity with K-nearest neighbor search. The second mannerfollows sequence-matching based place recognition in SeqSLAM [21]. Here we only use the sequence matching steps inthe original SeqSLAM. For both manners, similar to PointNetVLAD [3], we use the Average Recall, Precision-RecallCurve and Average Precision Score (AP score) to assess theplace recognition accuracy between the relative reference andtesting sequence trajectories.1 https://github.com/mikacuy/pointnetvlad2 https://github.com/LiHeUA/M2DPFig. 5. Sub-map generation. Each sub-map (the highlighted area) is generated from the global map M api . In the evaluation step, both testing andreference queries are extracted with local viewpoints differences in translation([0, 2, 4, 6, . . .]m on 2D–XY plane) and orientation ([0, 45, 90 135, . . .] ) inyaw.TABLE IIIAVERAGE RECALL AT TOP @5 ON FOUR DATASETS UNDER VARIANTVIEWPOINT DIFFERENCES FOR BOTH NON-LEARNING/LEARNING METHODSA. Place Recognition Results1) Orientation- and Translation- Tolerance Analysis: Weconduct experiments on four datasets to evaluate the robustnessof place recognition of different methods. As we can see inFig. 6, we calculate the average recall at top 1% betweenreference/testing trajectories (under translation [0, 2, 4, 6]m andyaw orientation [0, 45, 90 135] ). For all the non-learning basedapproaches, they can achieve robustly place recognition under variant orientation difference, while on the other hand,translation difference will significantly reduce their matchingaccuracy. We can also notice that the PointNet-based methodcan handle translation differences locally but is sensitive to orientation differences, the matching accuracy of PointNetVLADquickly declined as rotation differences increasing. Compareto the above techniques, the place descriptors of FusionVLADare invariant to orientation-differences and can guarantee theaverage recall at top 1% are above 80% on each dataset.Table III further provides the average recall at top @5, wecan see that on all the four datasets. Here Fusion (top-down)and Fusion (spherical) indicates the network with only oneperspective. As we mentioned in Section III-C, Fusion (no deep)means FusionVLAD network but only with fusion-branch lossin the training procedure, and Fusion (deep) is with all the threebranches. Fusion (without rot) means the training procedurewithout ‘rotation loss’ metric. FusionVLAD can achieve moreaccurate place retrieval with average recall above 85%. Table IVAuthorized licensed use limited to: Carnegie Mellon Libraries. Downloaded on May 26,2021 at 16:03:54 UTC from IEEE Xplore. Restrictions apply.
YIN et al.: FusionVLAD: A MULTI-VIEW DEEP FUSION NETWORKS FOR VIEWPOINT-FREE 3D PLACE RECOGNITION2309Fig. 6. Average Recall at Top 1% under variant viewpoint differences. Each sub-graph represent 16 trails of the place recognition average recall (z-axis) ondifferent translation (x-axis) or orientations (y-axis). Each trail includes a reference trajectory and a testing trajectory (with translation/orientation noise).TABLE IVAVERAGE RECALL AT TOP @5 UNDER DIFFERENT AREAS OF THE CAMPUSFig. 8. Average precision score of sequence-matching [21] results on theNCLT dataset.Fig. 7. Average precision score of single-matching results on the NCLTdataset.shows the place recognition performance on the datasets of II,and all the learning methods use the pre-trained model on theCampus datasets.2) Single- and Sequence-Matching Results: Fig. 7 andFig. 8 shows the place recognition results of single-scan andsequence-scan based matching on the NCLT dataset. In bothmatching manners, we use the precision-recall curve and Average Precision Score to analyze the matching accuracy. In thecases of lower translation differences, both non-learning andlearning-based methods can achieve robust place recognitionability. For significant translational or rotational differences,transitional methods or PointNet-based method cannot guarantee an accurate place retrieval. In most cases, the sequencematching manner can improve the matching performances,however, for M2DP method without translation differences,sequence-matching may reduce the recognition accuracy. ForFusionVLAD, with the benefit of merging both top-down viewand spherical-view branches, our method can achieve stableplace retrieval in both single- and sequence- matching manner.Especially, we can achieve 80% Average Precision Score undersequence-matching manner within 6 m translation differences.Please not the sequence-matching can only find one singlebest matching for each query, thus this manner need to furthermodified when dealing with query with more than two matches.Authorized licensed use limited to: Carnegie Mellon Libraries. Downloaded on May 26,2021 at 16:03:54 UTC from IEEE Xplore. Restrictions apply.
2310IEEE ROBOTICS AND AUTOMATION LETTERS, VOL. 6, NO. 2, APRIL 2021TABLE VCOMPARISON OF TIME, GPU MEMORY (MEGABYTE), AND FEATURE SIZEREQUIREMENTS OF DIFFERENT METHODSdatasets show that our method notably outperforms the stateof-the-art in 3D place recognition tasks. Our method can workwith limited computation resources and storage spaces, makingit extremely suitable for low-cost robots in large-scale mappingtasks. In future works, we will fuse information from differentsource (image, radar) to further improve the performance.REFERENCESB. Time and Storage AnalysisIn Table V, we analysis the time and memory usage of our FusionVLAD and other methods. Compared with PointNetVLAD,our method consumes about 31% GPU memory for training andtakes about 20% time for extracting place descriptor for a pointcloud. While comparing to non-learning method, FusionVLADis more robust and efficient. In the inference step, the multi-viewgeneration step will consume 100 ms on the NUC i7 computer.FusionVLAD also only requires 10 ms and 37M b on the GPUdevice or 87 ms on a CPU device. which make it easy to implyin the Nvidia embedded system (Nvidia Jetson TX2, or Xavier)or the NUC computer, and suitable for low cost robot systemsin long-term SLAM or navigation tasks.C. Discussion & LimitationsAs s
design a lazy viewpoint-free metric to enhance the learnt descriptors to viewpoint-invariant place recognition. We design the experiments with both public and self-recorded datasets to evaluate the place recognition per-formance of our method under variant translational and rotational differences. Notably .