Transcription
Psychosomatic MedicineAuthor’s Accepted ManuscriptDArticle Title: Neural, Hormonal, and Cognitive Correlatesof Metabolic Dysfunction and Emotional ReactivityAuthors: Tovah Wolf, Vera Tsenkova, Carol D. Ryff,Richard J. Davidson, and Auriel A. WilletteTEDOI: 10.1097/PSY.0000000000000582EPReceived Date: December 21, 2016Revised Date: January 23, 2018This manuscript has been accepted by the editors of Psychosomatic Medicine, but ithas not yet been copy edited; information within these pages is therefore subject tochange. During the copy-editing and production phases, language usage and anytextual errors will be corrected, and pages will be composed into their final format.CPlease visit the journal’s website (www.psychosomaticmedicine.org) to check for a finalversion of the article.ACWhen citing this article, please use the following: Psychosomatic Medicine (in press)and include the article’s digital object identifier (DOI).Copyright 2018 by the American Psychosomatic Society. Unauthorized reproduction of this article is prohibited.
Psychosomatic Medicine Publish Ahead of Print10.1097/PSY.0000000000000582Neural, Hormonal, and Cognitive Correlates of Metabolic Dysfunction andEmotional Reactivity122,3Tovah Wolf, MS , Vera Tsenkova, PhD , Carol D. Ryff, PhD ,2,3,4,51Department of Food Science and Human Nutrition, Iowa State University, Ames, IA, United45Institute on Aging, University of Wisconsin-Madison, Madison, WI, United States.Department of Psychology, University of Wisconsin-Madison, Madison, WI, United States.EP3TEStates.21,6,7,8, Auriel A. Willette, PhDDRichard J. Davidson, PhDCenter for Healthy Minds, University of Wisconsin-Madison, Madison, WI, United States.Waisman Laboratory for Brain Imaging and Behavior, University of Wisconsin-Madison,Madison, WI, United States.7Department of Biomedical Sciences, Iowa State University, Ames, IA, United States.AC8Department of Psychology, Iowa State University, Ames, IA, United States.C6Department of Neurology, University of Iowa, Iowa City, IA, United States.Conflicts of Interest and Source of Funding:No potential conflicts of interests relevant to this article to report.This work was funded in part by the College of Human Sciences at Iowa State University, a BigData Brain Initiative grant through the Iowa State University Office of Vice President forResearch, NIH grant AG047282, and the Alzheimer's Association Research Grant to PromoteCopyright 2018 by the American Psychosomatic Society. Unauthorized reproduction of this article is prohibited.
Diversity grant AARGD-17-529552. Neither funding source had any involvement in the report.MIDUS is funded by the National Institute on Aging (PO1-AG020166; Carol D. Ryff, PrincipalInvestigator). John D. Catherine and Catherine T. MacArthur of the Foundation ResearchNetwork on Successful Midlife Development were the supporters of the original project.224A MacKay Hall Ames, IA 50011ACCEPTEE-mail: awillett@iastate.eduDSend Correspondence To: Auriel A. WilletteCopyright 2018 by the American Psychosomatic Society. Unauthorized reproduction of this article is prohibited.
AbstractObjectivePre-diabetes and type 2 diabetes (i.e., hyperglycemia) are characterized by insulin resistance(IR). These problems with energy metabolism may exacerbate emotional reactivity to negativelyDvalenced stimuli and related phenomena like predisposition toward negative affect, as well ascognitive deficits. Higher emotional reactivity is seen with hyperglycemia and IR. Yet, it isTElargely unknown how metabolic dysfunction correlates with related neural, hormonal, andcognitive outcomes.MethodsEPAmong 331 adults from the Midlife in the United States (MIDUS), we cross-sectionallyexamined eye- blink response (EBR) to gauge reactivity to negative, positive, or neutrallyvalenced pictures from international affect picture system (IAPS) stimuli proximal to an acousticCstartle probe. Increased EBR to negative stimuli was considered an index of stress reactivity.Frontal alpha asymmetry, a biomarker of negative affect predisposition, was determined usingACresting electroencephalography (EEG).Baseline urinary cortisol output was collected. Cognitive performance was gauged using theBrief Test of Adult Cognition by telephone (BTACT). Fasting glucose and insulin characterizedhyperglycemia or the homeostatic model assessment of IR (HOMA-IR).ResultsHigher HOMA-IR corresponded to an increased startle response, measured by EBR magnitude,for negative versus positive stimuli [R2 0.218, F(1,457) 5.48, p .020, euglycemia:Mean SD .092 .776, hyperglycemia: Mean SD .120 .881]. Participants with hyperglycemiaCopyright 2018 by the American Psychosomatic Society. Unauthorized reproduction of this article is prohibited.
vs. euglycemia showed greater right frontal alpha asymmetry [F(1,307) 6.62, p .011,euglycemia: Mean SD .018 .167, hyperglycemia: Mean SD -.029 .160] and worse BTACTarithmeticperformance[F(1,284) 4.25,p .040,euglycemia:Mean SD 2.390 1.526),hyperglycemia: Mean SD 1.920 1.462]. Baseline urinary cortisol (log10 μg/12 hr) was alsodysregulated in individuals with hyperglycemia [[F(1,324) 5.09, p .025, euglycemia:DMean SD 1.052 .332, hyperglycemia: Mean SD .961 .362].TEConclusionThese results suggest that dysmetabolism is associated with increased emotional reactivity,EPpredisposition toward negative affect, and specific cognitive deficits.Keywords: Insulin resistance, International Affective Picture System, HOMA-IR, Type 2Cdiabetes, EEG, CortisolAcronyms: BTACT Brief Test of Adult Cognition by telephone; EBR Eye-blink response;ACEEG electroencephalography; EMG electromyography; HOMA-IR (log10) Homeostaticmodel assessment of insulin resistance (logarithm base 10); IAPS International AffectivePicture System; IR insulin resistance; MDD major depressive disorder; Pre-T2D Pre-type2 diabetes; T2D Type-2 diabetes; WHR waist-hip-ratio.Copyright 2018 by the American Psychosomatic Society. Unauthorized reproduction of this article is prohibited.
INTRODUCTIONOne-third of Americans are obese (1), where 22 million adults have type 2 diabetes andnearly 40% of middle-aged adults develop pre-type 2 diabetes (2). Pre-type 2 diabetes etiology ischaracterized by insulin resistance (IR), which is a reduced cellular response to insulin (3). WhileDit is well established that IR and type 2 diabetes contribute to cardiovascular disease and otherpathologies, they also affect behavior. For example, IR is related to deficits in cognitive (4) andTEaffective processing, particularly reactivity to psychological stress in humans (5) and monkeys(6). IR in euglycemic or hyperglycemic (i.e., pre-type 2 diabetes and type 2 diabetes) participantsis also associated with neural sequelae that affect these behavioral outcomes (7–9). It is unclearhow IR affects cognitive and emotional processing. It has been suggested that oxidative stress,EPneuronal apoptosis, neuroinflammation, and electrophysiological abnormalities can causearchitectural changes and contribute to brain dysfunction in type 2 diabetes (10).IR and hyperglycemia also manifest with major depressive disorder (MDD) and severalCother anxiety and mood disorders. Participants with MDD showed impaired insulin sensitivity(i.e., IR) after an oral-glucose tolerance test that was resolved after antidepressant treatment (11).ACIndeed, if depression is resolved, fasting glucose levels tend to improve (12,13). Recent metaanalyses suggest that MDD (14) and bipolar disorder (15) are associated with higher rates of type2 diabetes. For example, individuals with type 2 diabetes are twice as likely to have MDD (16)and impaired cognitive performance (17,18) compared to those without type 2 diabetes.Conversely, MDD may increase the risk of developing type 2 diabetes (19). Some of thisincreased risk of MDD, and in general emotional reactivity, may be due to stigma anddiscrimination toward individuals who are obese (20). However, IR may be a critical biologicalmechanism underlying emotional reactivity and psychopathology (9,21,22). It is chronic stressrather than acute stress that has an influence on human physiology (23– 25). Animals studiesCopyright 2018 by the American Psychosomatic Society. Unauthorized reproduction of this article is prohibited.
show chronic stress leads to low-grade chronic inflammation in the brain (26), resulting inmacrophage infiltration in the the gut that can induce metabolic dysfunction (27).Thus, it is important to further investigate biological, psychological, and neural correlatesexamining associations between behavioral reactivity and metabolic dysfunction. TheInternational Affective Picture System (IAPS) is commonly used for experimental investigationDof emotion and attention. Brain regions have been examined in regards to which areas areassociated with emotional reactivity. Multiple studies have shown the visual cortex beingTEactivated when viewing emotional pictures (28,29). The visual cortex has differing activationbetween the left and right hemisphere in response to emotional stimuli (30,31). Other brainregions showing activation include the amygdala- hippocampal region (28), dorsolateralprefrontal cortex (32), basal ganglia (28), ventromedial prefrontal (vPFC) and medialEPorbitofrontal cortex (28), and anterior cingulate (28,32). Human (21,22,33,34) and monkey (8)studies have demonstrated that IR is related to brain atrophy, as well as less glucose uptake inhumans (35), in most of these areas but particularly vPFC (22). The vPFC is essential for top-Cdown modulation of stress-induced emotional reactivity, as well as medial temporal areas likeamygdala and hippocampus that in part grade for threat detection and emotional regulation (36).ACOne method of examining emotional reactivity is the eyeblink startle response, which is aninvoluntary periorbital eye reflex to a typically loud acoustic stimulus. Vrana and colleagues (37)initially found that pairing a startle probe with an aversive or pleasant stimulus respectivelyfacilitated or inhibited the automatic eyeblink response, allowing assessment of state and traitaffective disposition as well as emotional reactivity (38,39). IAPS have been commonly used asa primary or foreground stimulus paired with acoustic startle (40). It is also the case thatemotion-modulated startle varies based on when IAPS stimuli are presented. For example,Larson and co-workers found that startle modulation of the eyeblink response disappears 4-7seconds after a given picture disappears from the screen (41), suggesting that examining earlyCopyright 2018 by the American Psychosomatic Society. Unauthorized reproduction of this article is prohibited.
versus late eyeblink startle response may help better distinguish affect facilitation or inhibitionversus a response just due to the startle probe.Despite associations between stress reactivity and metabolic dysfunction, a fullunderstanding of how this relates to the startle eyeblink response and other neural correlatesremains unknown. Therefore, it was worthwhile to determine in otherwise healthy, middle-agedDadults if hyperglycemia and IR were related to psychophysiological and behavioral measures ofpsychological emotional reactivity, or negative affect predisposition. Our central hypothesis isTEmetabolic dysfunction is related to neural biomarkers of emotional reactivity. By usingelectromyography (EMG) and electroencephalogram (EEG) data from the MIDUS (Midlife inthe United States) study (42), differences between healthy adults and those with IR and pre-type2 diabetes or type 2 diabetes (i.e., hyperglycemia) can be identified. In this study, weEPinvestigated if hyperglycemia and IR were associated with: 1) worse cognitive performance anddysregulated cortisol; and 2) higher psychophysiological measures of emotional reactivity, bothat rest and during picture presentation paired with acoustic startle using eye-blink responseC(EBR).ACRESEARCH DESIGN AND romtheMIDUSdatabase(www.midus.wisc.edu/midus2). MIDUS II is a cross-sectional study that started in 2002 whichwas a follow up to the original MIDUS I study launched in 1995. The follow up study wascompleted by 2009 and included a collection of neuroscience data in a subset of 331 respondentsfrom 1,255 MIDUS participants who were part of the biomarker project within the study. TheMIDUS protocols were reviewed by the University of Wisconsin-Madison Institutional ReviewCopyright 2018 by the American Psychosomatic Society. Unauthorized reproduction of this article is prohibited.
Board. All participants signed verbal consent for the biomarker project and gave verbal consentfor the telephone and mail survey data before the initiation of the study. Participants wereexcluded from the analysis if biomarker data was missing, or if 2 of 3 EBR measurements weremissing. Among the participants with biomarker data, there were no significant differencesbetween age, sex, income level or marital status (43). However, Love et al. indicated thatDcompared to the larger MIDUS sample from which they were drawn, the biomarker participantshad significantly higher educational levels, with 52.2% attending high school/some college, andTE42.1% being a college graduate or beyond (43). The sample also was predominately white(78.3%), and 13.8% of responders reported that they smoke cigarettes (43).EPBiological MeasuresAs described in the MIDUS protocol (44), fasting blood samples were collected during anovernight stay. Cobas Integra Systems assay (Roche Diagnostics, Indianapolis, USA) was usedCto measure glycated hemoglobin (HbA1c) with an inter-assay CV of the control 1.1-3.4%, anintra-assay CV of 0.43%, and a reference range of 4.0-5.6% . An enzymatic assayACphotometrically measured fasting glucose (Roche Modular Analytics P, Indianapolis, USA) andan ADVIA Centaur Insulin immonoassay (Siemens, Malvern, USA) was used to measure fastinginsulin. Insulin inter-assay CV of the control was 2.4-4.6%, an intra-assay CV of 2.5-4.0%, and areference range of 4-27 uIU/mL . Glucose inter-assay CV of the control was 1%, an intra-assayCV of 1%, and a reference range of 70- 99 mg/dL. An established formula was used to calculatehomeostatic model assessment of IR (HOMA-IR) (45), which is used to measure peripheral IR.Urine was collected over 12 hours to measure neuroendocrine hormones like cortisol andcreatinine, which were isolated using high- performance liquid chromatography - massspectrometry.Copyright 2018 by the American Psychosomatic Society. Unauthorized reproduction of this article is prohibited.
Determination of Hyperglycemia (Pre-Type 2 Diabetes, Type 2 Diabetes)Current criteria from the American Diabetes Association were used to define presence ofprediabetes (HbA1c between 5.7-6.5% or glucose between 100-126 mg/dL, and not takingdiabetes medications) and diabetes (HbA1c above 6.5%, fasting glucose above 126 mg/dL, orTEAffective Neuroscience AssessmentsDtaking medications that lower glucose levels such as Metformin) (46).The neuroscience project of MIDUS II investigated emotional reactivity and recovery byobtaining EMG data and EBR magnitude and amplitude in response to 90 IAPS pictures of 30positive, 30 neutral or 30 negative emotional valence using EMG (29). Please see Figure S1EP(Supplemental Digital Content, http://links.lww.com/PSYMED/A464) for an illustration ofstimulus presentation. Facial muscle recordings like EBR provide differential facets of emotionalresponse stemming from processing emotional stimuli (47,48). EB provides objective estimatesCof time, magnitude, and amplitude of emotional response during and following IAPS.For the EBR scoring, EBR magnitudes were calculated by subtracting the amount ofACintegrated EMG at reflex onset from that at peak amplitude (maximum amount of integratedEMG between 20 and 120 ms following probe onset). Trials with no detected EBR wereassigned a magnitude of zero and included in the analysis. EBR magnitudes were logtransformed to normalize the data, then z- scored to range-correct the data separately for eachparticipant. A participant’s data was excluded when the participant did not respond with adetectable EBR on less than 75% of the total number of probes. EBR amplitudes were calculatedsimilarly, except trials with no detectable eyeblink reflex were excluded from the analysis (49).Text S1 (Supplemental Digital Content, http://links.lww.com/PSYMED/A464) describesadditional EBR processing.Copyright 2018 by the American Psychosomatic Society. Unauthorized reproduction of this article is prohibited.
After accounting for missing EBR and HOMA-IR data, our analysis includedapproximately 123 euglycemia, 89 pre-type 2 diabetes, and 44 type 2 diabetes individuals. EBRis an objective index of the startle response. The human startle response is commonly used inresearch studies and in clinical practice to measure central nervous system activity and EMG isfrequently used to obtain it.DEBR in response to acoustic startle stimuli was measured by placing two mini electrodesbelow the eye. The pictures shown to the participants were from the IAPS (29). For a given trial,TEthe acoustic startle stimuli (105 dB) was administered for 50ms during one of three phases: 1)The ―early‖ phase at 2,900ms after picture onset while the picture was on the screen to assessreactivity; 2) the ―middle‖ phase at 400ms after picture onset; and 3) the ―late‖ phase at 1,900msafter picture offset and removal to assess longer-term recovery (Figure S1, SupplementalEPDigital Content, http://links.lww.com/PSYMED/A464). Schaefer et al. showed across allvalences that EBR at a 2nd ―middle‖ phase probe occurring 400ms after picture offset haddecreased magnitude, which suggested that pre-pulse inhibition may have affected the 2nd probeCmagnitude due to close temporal proximity to the picture offset (50,51). Taking their finding intoACconsideration, we dropped this time point from our analysis.ElectroencephalographyEEG data were also collected to assess scalp electrical activity and thereby indirectlyassess cortical brain activity. A geodesic electrode net on the scalp with 128 channels of EEGwas used to collect the data (www.egi.com). Resting frontal asymmetry was defined as thedifference between theright and left side prefrontal cortex activation, as measured by EEG. Higher activation of the leftside of the prefrontal cortex compared to the right is related to a predisposition toward positiveCopyright 2018 by the American Psychosomatic Society. Unauthorized reproduction of this article is prohibited.
affect (52), whereas higher activation of the right side of the prefrontal cortex compared to theleft is associated with predisposition toward negative affect (48). This is gauged using Alphawave frequency. Resting EEG asymmetry was collected before image presentation. To constraintype 1 error, we focused on alpha wave output comparing the f3/f4 and f7/f8 channels, whichhave been used to assess right frontal asymmetry (52). EEG methodology is further described inTEDigital Content, http://links.lww.com/PSYMED/A464).DText S2 and the EEG lower and upper alpha bands are shown in Table S1 (SupplementalCognitive AssessmentPart of the Brief Test of Adult Cognition by telephone (BTACT) included a numbercompletion series and a catergory fluency task. Accuracy and total number correct of 1 thru 5EPnumbers series tasks were recorded and the number of unique words mentioned in a particularcatergory in 15 seconds. Number series tests have been used to measure fluid intelligence andStatisticsCreasoning (53).ACAll analyses were conducted using SPSS 23 (IBM Corp, New York, USA). Fasting labs,including glucose, insulin and HOMA-IR were log transformed to produce a normal distribution.Restricted maximum likelihood linear mixed models were used to analyze the main effects orinteractions of HOMA-IR or hyperglycemia on EBR during the early vs. late phase of IAPSstimulus presentation for the following contrasts: 1) negative minus positive; and 2) negativeminus neutral. Covariates include age, sex, and waist:hip ratio (54–56). The same model wasused to predict resting frontal EEG asymmetry, as well as cognition and cortisol output duringthe arithmetic task. One subject had predictor values greater than 3 standard deviations from themean and was excluded from analysis. Significance was determined as p .05.Copyright 2018 by the American Psychosomatic Society. Unauthorized reproduction of this article is prohibited.
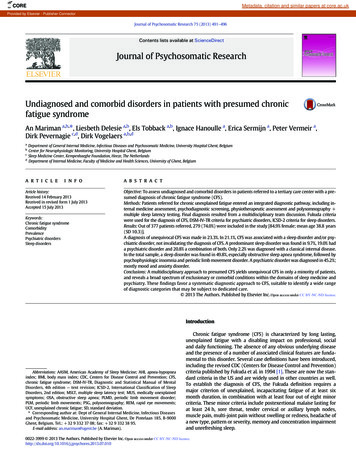
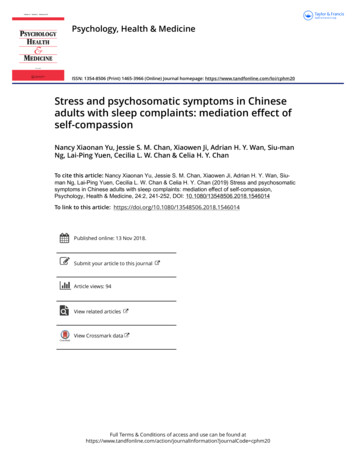
RESULTSData SummaryTable 1 lists demographics, HOMA-IR, EEG, EBR, and other baseline sampleEMG EBR startle reflexDcharacteristics, as well as comparisons between the euglycemia versus hyperglycemia groups.TEFor EBR startle reflex magnitude, there was a HOMA-IR x Trial Phase interaction[F(1,457) 5.48, p .020], indicating that HOMA-IR differentially predicted EBR for various trialphases. Specifically, higher HOMA-IR corresponded to an increased startle response fornegative relative to positive stimuli [R2 .218, p .001] (Figure 1a), but not during the late phaseEPafter the image disappeared (Figure 1b). For EBR startle reflex amplitude, participants with pretype 2 diabetes and type 2 diabetes were more responsive for negative relative to neutral stimuliCduring early picture onset than euglycemic participants [F(1, 290) 4.06, p .045].EEG frontal asymmetryACFor resting EEG, subjects with pre-type 2 diabetes or type 2 diabetes had lower alphawave output in right versus left frontal areas including f3/f4 [F(1,307) 6.62, p .011] (Figure 2)and f7/f8 [F(1,307) 5.99, p .015] (Euglycemia Mean SEM: .0007 .0064; HyperglycemiaMean SEM: - 0.0210 .0062), which reflects greater right frontal activity. Higher log HOMA-IRwas not related to f3/f4 output [p .310], but was modestly associated with greater f7/f8 rightfrontal asymmetry [R2 .030, p .002].Copyright 2018 by the American Psychosomatic Society. Unauthorized reproduction of this article is prohibited.
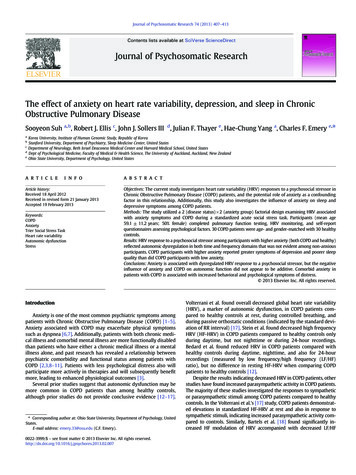
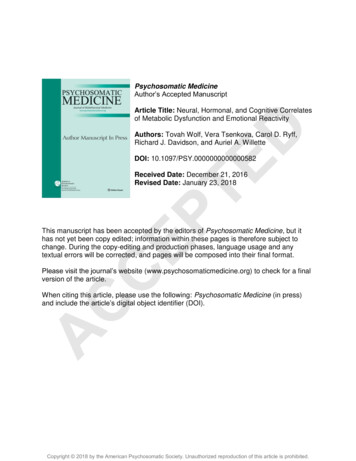
Basal cortisolAt baseline, a main effect for cortisol urine output showed that baseline urinary cortisolwas lower in type 2 diabetes and pre-type 2 diabetes participants compared to those with normalblood glucose levels [F(1,324) 5.09, p .025] (Figure 3). Similarly, higher HOMA-IR wasDrelated to lower baseline urine cortisol corrected for creatine [F(1,324) 9.27 p .003].Cognitive AssessmentTEParticipants with pre-type 2 diabetes or type 2 diabetes showed lower total performancescores on the arithmetic task than those with euglycemia [F(1,284) 4.25, p .040] (Figure 4).Lower repetition scores on the BTACT category fluency task was not related to glycemic statusDISCUSSIONEP[F(1,286) 1.27, p .282].Our results suggest that some degree of metabolic dysfunction is related to brain-basedCemotional reactivity, urinary cortisol levels, and cognitive function. Individuals with pre-type 2diabetes and type 2 diabetes showed a heightened startle-related stress response to negativeACversus positive stimuli during picture presentation, but not after picture offset during therecovery period. These results suggests that IR predicts heighted early stress response for―unpleasant‖ vs. ―pleasant‖ emotional stimuli. It has been previously shown that IR is related todeficits in cognitive and affective processing among rhesus monkeys (8) and humans (5). Thelink between stress and insulin is not clear and requires further investigation. Long-term calorierestriction substantially reduces IR and stress reactivity in rhesus monkeys, who do not manifestbias toward obese cage mates, suggesting that the association is at least partly neurobiological inorigin (7,8). It is interesting to note that calorie restriction in aged rhesus monkeys reduces IR,emotional reactivity to novel stressors, and related neurodegeneration in the vPFC andCopyright 2018 by the American Psychosomatic Society. Unauthorized reproduction of this article is prohibited.
hippocampus without affecting activity or attention behavior (6,8). This suggests that weight lossand lower IR may reduce emotional reactivity. It should be noted that WHR was covaried in thisreport’s statistical models, though, suggesting variance related to weight or adiposity may not bedirectly affecting associations with IR and glycemic status.Alternatively, the start of IR could contribute to further weight gain. Pathologies ofDexcess stress may affect eating behaviors, and thus induce obesity (57,58). Most studies havereported that during times of stress, individuals change their eating behaviors to consume moreTEcalories rather than less calories (59)(60)(61). Indeed, individuals who are overweight are morelikely to gain weight in response to stress than those who are of a normal weight (61). Stress caninduce corticosteroids, which can increase one’s appetite for food (62), but stress can also lead toa decrease in food intake (63). Increased insulin levels can be induced by stress, which in turnEPhas been shown to decrease food intake (64). Insulin and leptin receptors in the arcuate nucleusof the hypothalmus help sustain energy by governing food intake (65). Other examples ofsignaling molecules involved are cholecystokinin (66) and tumor necrosis factors (67), as well asClipids (68) and sugars that can affect the hypothalamus but also limbic and autonomic brainregions (69). Some individuals maybe predisposed to IR due to epigenetics and genetics. ForACinstance, the fat mass and obesity-related gene (FTO) has been associated with obesity, with anapproximately 0.4 kg/m2 rise in BMI correlated with each copy of a specific allele (70).Our study also observed modestly dysregulated cortisol output due to hyperglycemia,suggesting dysregulation of the hypothalamic-pituitary-adrenal axis underlying stress perceptionand response (71). Abraham et al. (72) similarly found weak to moderate associations betweenmetabolic dysfunction markers, cortisol, and self-reported stress. Another study showedindividuals with type 2 diabetes had flattened cortisol during the day compared to others in thestudy who did not have type 2 diabetes (73). The authors suggested individuals with type 2diabetes showed heightened cortisol levels in the evening when they would normally declineCopyright 2018 by the American Psychosomatic Society. Unauthorized reproduction of this article is prohibited.
(73). Regardless, hyperglycemia has been related to increased anxiety and depression scoresusing measures like the Patient Health Questionnaire (PHQ-9) (74) and the Generalized Anxietydisorder scale (GAD-7) (74).Resting EEG confirmed our EBR findings, where greater right frontal asymmetry wasseen in pre-type 2 diabetes and type 2 diabetes. This is a well-established neural biomarkerDassociated with predisposition toward negative affect (48). Makine et al. similarly found thatindividuals with type 2 diabetes who are not yet on insulin were more likely to be depressed andTEhave negative attitudes about insulin therapy (75) than non-diabetic controls. Our EEG resultsshowed very modest associations with HOMA-IR compared to pre-type 2 diabetes and type 2diabetes, suggesting that overt metabolic disease such as type 2 diabetes, but not relatively milddysfunction such as IR, may be related to a neurobiological predisposition to focus on negativeEPaffect (48). More research is needed at the behavioral and biological level that link psychologicalstress to type 2 diabetes related morbidity.Our study found that individuals with type 2 diabetes and pre-type 2 diabetes scoredCworse on a math task than euglycemic individuals. There is strong evidence to suggest that type2 diabetes is related to worse cognitive performance (18,76), possibly due to greater atrophy,ACwhite matter lesions, and infarcts in subcortical brain regions related to executive processes (77).It would be useful to see if deficits in glucose metabolism or lower brain volume mediate theseassociations.This study has several limitations and strengths. The participants of the MIDUS studylive in a U.S. geographical region that was predominantly white, so it may not be representativeof the entire U.S. population. Additionally, the relationships were specific to glycemic status orIR, where hyperglycemia and hyperinsulinemia have overlapping but specific effects on neuralfunction such as memory formation (33). Since this study is correlational in nature, it cannot beruled that relationships we found are causal. Longitudinal data acquired in MIDUS or otherCopyright 2018 by the American Psychosomatic Society. Unauthorized reproduction of this article is prohibited.
cohorts may help to establish more causal relationships. Specifically, data collected over timecould help strengthen our understanding of whether variation in IR over time predicts subsequentchanges in emotional reactivity, urinary cortisol, and cognitive performance or whether thesecorrelates predict possible subsequent changes in IR. A strength of this research includes thelarge sample size, robust statistical methods (78), and the consistency of our findings with theDexisting literature. The relationship of HOMA-IR with the biological facets of emotionalreactivity should prompt more research to uncover underlying mechanisms.TEThis study provides evidence that metabolic dysfunction may be related to the tendencyto react more strongly to negative stimuli, and to increase frontal neural asymmetry, a biologicalmeasure that has been used to gauge predisposition of part of prefrontal cortex to attend tonegative stimuli. This implies that metabolic dysfunction may be a potential mechanism thatEPcould partly modulate emotional reactivity to negative stimuli. Positive affect can lead toimproved physical and mental health (79), and lifestyle interventions can prevent and delay type2 diabetes for people at risk more than metformin (80). IR mechanisms of action need to beCfurther explored at a psychological,
This manuscript has been accepted by the editors of Psychosomatic Medicine, but it has not yet been copy edited; information within these pages is therefore subject to change. During the copy-editing and production phases, language usage and any textual errors will be corrected, and pages will be composed into their final format.