Transcription
Journal of Psychosomatic Research 78 (2015) 260–267Contents lists available at ScienceDirectJournal of Psychosomatic ResearchBlunted neuroendocrine stress reactivity in young women witheating disordersSerkan Het a, Silja Vocks b, Jutta M. Wolf c, Philipp Hammelstein d, Stephan Herpertz e, Oliver T. Wolf a,⁎aDepartment of Cognitive Psychology, Ruhr-University Bochum, GermanyDepartment of Clinical Psychology and Psychotherapy, Osnabrück University, GermanyDepartment of Psychology, Brandeis University, Waltham, USAdChristoph-Dornier Clinic for Psychotherapy, Münster, GermanyeDepartment of Psychosomatic Medicine and Psychotherapy, LWL-University Clinic, Ruhr-University Bochum, Germanybca r t i c l ei n f oArticle history:Received 23 April 2014Received in revised form 20 October 2014Accepted 4 November 2014Keywords:Anorexia nervosaBulimia nervosaCortisolHypothalamus–pituitary–adrenal (HPA) axisStressSympathetic nervous system (SNS)a b s t r a c tObjective: Stress is known to influence risk and progression of eating disorders (EDs). However, studies investigating physiological and psychological stress responses under laboratory conditions in patients with Anorexianervosa or Bulimia nervosa are scarce and often produce conflicting findings. We therefore aimed to comparethe neuroendocrine and affective stress response in ED inpatients and healthy controls.Methods: Twenty-eight female inpatients with Anorexia or Bulimia nervosa and 26 healthy women were exposedto the Trier Social Stress Test (TSST). Salivary cortisol and alpha-amylase (sAA) levels were assessed before aswell as repeatedly after stress exposure, while heart rate and heart rate variability were determined beforeand during the TSST. Negative affective state was assessed at baseline and post-TSST.Results: Compared to healthy controls, ED patients showed blunted cortisol stress responses combined with overall attenuated sAA levels. The latter was reflected in generally enhanced parasympathetic activity indicated bylower heart rate and stronger high-frequency heart rate variability throughout the TSST. Although patientsreported more negative affect overall, they did not differ in their affective stress response.Conclusions: In summary, patients suffering from eating disorders show a blunted HPA axis reactivity to stress exposure and a generally reduced sympathetic/exaggerated parasympathetic nervous system activity. This combination may contribute to elevated health risks seen in eating disorder patients, such as enhanced inflammatoryactivity, and thus provide insight into the underlying stress-related mechanisms. 2014 Elsevier Inc. All rights reserved.IntroductionEating disorder (ED) related behaviors like keeping a diet, the desireto be thinner or performing compensatory behavior such as selfinduced vomiting or excessive sport frequently occur among youngwomen [1–3]. However, only a small number of these women developan eating disorder like Anorexia nervosa (AN) or Bulimia nervosa (BN;[4]). The etiology of these disorders is still relatively unknown [5]. Stresshas been identified as a potential risk factor for the development of eating disorders [6], since there is evidence that patients often experiencesevere life events or chronic stress before the onset of the ED [7].Although chronic stress is not specific to patients with EDs [6], this finding might indicate that there is a strong activation of stress mediating⁎ Corresponding author at: Department of Cognitive Psychology, Ruhr-UniversityBochum, Universitaetsstrasse 150, D-44780 Bochum, Germany. Tel.: 49 234 32 28670;fax: 49 234 32 14308.E-mail address: oliver.t.wolf@rub.de (O.T. 11.0010022-3999/ 2014 Elsevier Inc. All rights reserved.physiological systems before the onset of an ED. This is in line withcurrent stress–disease models suggesting that chronic stress or aninadequate stress response facilitates emotional disorders [8–11].The two prominent physiological systems that mediate thestress response are the sympathetic nervous system (SNS) andthe hypothalamus–pituitary–adrenal axis (HPAA; [12]). The former system belongs to the autonomic nervous system and allows short-term adaptation to challenging conditions within a few seconds through therelease of epinephrine and norepinephrine from the adrenal medulla aswell as through direct innervation of target tissues. The latter systemcomplements the former through the release of corticotropin-releasinghormone (CRH), adrenocorticotropic hormone (ACTH) and glucocorticoids (GCs), mainly cortisol in humans [13]. Cortisol permeates theblood–brain barrier and activates central corticosteroid receptors, thereby regulating its own release [12,14].Besides acute cortisol increases indicating HPAA reactivity, cortisolalso shows a circadian rhythm indicating basal HPAA activity [15].This rhythm is characterized by a cortisol awakening response (CAR)
S. Het et al. / Journal of Psychosomatic Research 78 (2015) 260–267associated with 50–100% increase in cortisol over the first 30–45 minafter awakening followed by a steady decline over the course of theday and a nadir in the first half of the night [16]. The CAR is significantlyrelated to various psychosocial factors, chronic stress, health andphysical conditions [17–20].Past research on patients with EDs showed a relatively consistentpattern in terms of SNS and HPAA activity under resting conditions.In contrast to healthy controls (HC), patients with AN or BN show ablunted activity of the SNS as indicated by heart rate frequency (HRF;[21,22]), blood pressure [23,24], heart rate variability (HRV; [25]), salivary alpha-amylase (sAA; [26]), and serum norepinephrine [21,22]level. Furthermore, ED patients often display an enhanced HPAA activitywith higher concentrations of CRH in cerebrospinal fluid [27] andcortisol in serum or saliva [28–31]. In terms of CAR, only one studyinvestigated this HPAA activity marker in AN patients and found it tobe enhanced compared to HC [26]. These changes were often attributedto (at least intermitted) starvation [32,33] but could be interpreted as apredisposing condition which preceded the development of an ED andmake individuals more vulnerable for EDs as well [22,24].The patterns become less consistent when looking at stress systemreactivity instead of activity. While patients with AN or BN typicallyshow a blunted SNS response to acute laboratory stressors comparedto HC [21,22,30,31,34], the findings on HPAA activity are more heterogeneous. For example, in one study [31], no group differences werefound between ED patients and HC in the cortisol response to a mirrorexposure task. Contrarily, Zonnevylle-Bender et al. [34] and Gintyet al. [35] reported a blunted stress response to the Trier Social StressTest (TSST; [36]) and to a ten minute mental arithmetic stress task inpatients with AN and BN. Another study reported elevated cortisollevels in women with AN throughout the investigation period whencompared to women with BN and HC [30]. In this study the TSST wasused as well. These conflicting results may in part be due to methodological issues. Several of the studies used stress induction methodsthat activate the SNS but may not be very effective in eliciting a HPAAresponse [37]. For instance, studies used a modified Stroop color wordtest [38,39], an imagination task [40,41], a mental challenge task[21,24], an auditory stimulation test [42], speech tasks [43,44] or paininduction [23]. Additionally, often rather small sample sizes were investigated. The aim of the present study was thus to investigate differencesin physiological and psychological stress responses between ED patientsand HC using a larger sample size and the TSST as an effective laboratorystress induction protocol [37]. Therefore the SNS, HPAA and the affectivestress responses were assessed and analyzed. We expected differencesin the HPAA stress response and the CAR between ED patients andHC and a lower SNS stress response and a stronger negative affectafter the TSST in ED patients compared to HC. The latter predictionwas based on a recent study showing that stress exposure resultedin stronger sadness responses as well as insecurity in ED patientscompared to HC [45].Importantly, for the purpose of the current study, patients with ANand BN were investigated as one group according to the transdiagnosticperspective [46,47]. This conceptualization is based on the longitudinalobservation that patients with AN, BN and atypical eating disorders(AED; eating disorders of clinical severity that do not meet thecriteria for AN or BN) share a core psychopathology characterized byover-evaluation and control of eating, shape and weight [47]. Thisis expressed in similar attitudes and behaviors, such as rigid restriction of food intake, vomiting, and over-exercise. However, thebalance of under- and over-eating differs between the groupsresulting in differences in body weight. Indeed, patients who donot recover from AN frequently cross-over to BN (1/4 of patientswith BN had AN in the past) or AED [48–50]. Moreover, BN typicallystarts as AN or an AED and a particularly common outcome of BN is achronic AED. In summary, AN, BN and AED are states on a psychopathology continuum with patients moving between these diagnosticstates [51–53].261MethodsParticipantsA total of N 54 women were recruited. Prior to testing, participantsunderwent a diagnostic examination using the German versions of theStructured Clinical Interview for Axis I of the DSM-IV (SCID-I; [54]), theBeck-Depression-Inventory (BDI; [55]), the Symptom-Checklist-90-Revised(SCL90-R; [56]) and the Eating Disorder Examination-Questionnaire(EDE-Q; [57]). The SCID was administered by trained professionalswith at least one year experience in the use of this diagnostic instrument.Twenty-eight inpatients with ED participated during the first week oftheir treatment. Of those, n 18 fulfilled the diagnostical criteria ofthe text revised 4th edition of the Diagnostic and Statistical Manual ofMental Disorders (DSM-IV-TR, [58]) of AN and n 10 patients thoseof BN. All patients were consecutive patients and were asked for participation to the study directly on the first or the second day after admissionto the clinic. They were medication-free (except of oral contraceptives)and were combined into one group according to the transdiagnostictheory of EDs [47]. Due to well-known changes in HPAA activity inpost-traumatic stress disorder, borderline personality disorder or schizophrenia [59,60], patients with EDs fulfilling the criteria of at least one ofthose diagnoses were excluded. Duration of illness was not restricted butconsidered in subsequent analyses. To ensure comparability, ambulantpatients were excluded as well. All patients were recruited from theChristoph-Dornier Clinic for Psychotherapy, Münster (Germany) andthe Department of Psychosomatic Medicine and Psychotherapy,LWL-University Clinic, Bochum (Germany), both are specialized in thetreatment of EDs. The group of HC was composed of n 26 physicallyand mentally healthy, medication-free (except of oral contraceptives)and drug-free female students with a body mass index (BMI) withinthe normal range (18.5–26 kg/m2) recruited at the University of Bochumand Münster via advertisements at the bulletin boards. Participants withprevious TSST exposure and participants who did not refrain from physical exercise or eating 1 h before testing were excluded. Since ED patientsoften use oral contraceptives and/or smoke, we did not exclude womenwho smoked and/or used oral contraceptives. However, due to potentialeffects on HPAA reactivity [61], frequencies of both behaviors wereassessed and statistically controlled. All participants provided writteninformed consent. The study protocol was approved by the institutionalreview board of the Ruhr-University of Bochum.Trier social stress test (TSST)The TSST was performed as described by Kirschbaum et al. [36]. Inshort, participants were told to introduce themselves to a committeeand to convince the committee that they were the perfect applicantfor a vacant position in their ‘dream job’. After a five minute preparationperiod, each participant had to talk about her job-relevant personalitytraits for a duration of 5 min. If the participant finished her speech inless than 5 min, standardized questions were used. During the subsequent 5 min, the participants were asked to count backwards in stepsof 17 from 2043 as fast and as accurately as possible. Whenever theparticipant made a mistake, she had to start over at 2043. Both membersof the committee were dressed in white lab coats and acted in areserved manner. The TSST has been shown to be highly effective ineliciting a HPAA response [37], a SNS response, and a negative affectstate [62].Saliva sampling and biochemical analysesSaliva samples were obtained using the Salivette sampling device(Sarstedt, Nümbrecht, Germany) to assess free cortisol and sAA levelsas HPAA and SNS markers, respectively [63,64]. To assess stress systemreactivity, saliva samples were collected 1 min before ( 1) and 1 ( 1),10 ( 10) and 25 ( 25) min after the TSST. To assess the CAR (basal
262S. Het et al. / Journal of Psychosomatic Research 78 (2015) 260–267HPAA activity/reactivity), saliva samples were collected on two consecutive days before the TSST to increase reliability of the CAR assessments[65,66]. On each day, the first sample was collected immediately afterawakening ( 0) and the second sample 30 min after awakening( 30). Participants were asked to protocol the awakening time andthe times of saliva sampling by using a saliva diary. Doing so the diaryallowed us to assess the (self-reported) compliance following the mostcommon compliance procedure in this section. Participants wereinstructed not to brush their teeth and to refrain from eating, drinkingand smoking during the sampling procedure. All samples were frozenand after study completion, cortisol concentrations were measuredusing a commercially available immunoassay with chemiluminescencedetection (IBL-Hamburg, Germany). Salivary alpha-amylase was measured using a quantitative enzyme kinetic method, as described earlier[63]. Inter- and intra-assay coefficients of variation were below 10% forboth assays.pre-TSST baseline cortisol levels [15]. After arrival at the lab, participantswere seated in a quiet room. The Polar watch was fitted and startedto continuously record HRF and HRV until the end of the test day.Additionally, participants answered the PANAS for the first time. Afterwards the participants completed a cognitive task on working memoryand autobiographic memory (results will be reported elsewhere)lasting about 30 min. Subsequently, a first saliva sample (baseline)was obtained and the PANAS was answered for the second time.Next, the participants were exposed to the TSST and immediately afterwards, post-treatment saliva sample ( 1) and PANAS self-report werecollected. Finally, the third ( 10 min) and the fourth ( 25 min)saliva samples were obtained and the PANAS was filled outsimultaneously.Assessment of cardiac parametersDemographic and descriptive variables were investigated byPearson's Chi-square test and Student's t-test. All data were tested fornormal distribution with Kolmogorov–Smirnov test (K–S test). In caseof a significant K–S test, data were log-transformed and the subsequentstatistical analyses were performed with the transformed data. The CARwas operationalized by the difference between the baseline and the 30minute sample and averaged across the two days [66]. Using the salivadiaries, compliance for CAR sampling was operationalized as deviationin minutes from the 30 minute time difference between the wake-upsample and 30 min samples. More than 10 minute deviation wascoded as non-compliant behavior and considered in the followingstatistical analyses. Area under the curve (AUC, [74]) was calculatedwith respect to increase (AUCI) for the neuroendocrine variables(cortisol and sAA) to assess HPAA and SNS stress reactivity. Cortisolresponders to the TSST were defined as showing a 1.5 nmol cortisolincrease between baseline and 10 min post-stress value as recentlyrecommended [75]. Mixed model analyses of variance (ANOVA) for repeated measures were performed on cortisol and sAA levels, on PANASscores, HRF, and HRV to reveal possible effects of time and group.Greenhouse–Geisser adjusted p-values are reported in case of violatedsphericity assumption. Differences of interest between the groups within a particular variable and a specific sampling time were evaluatedpost-hoc by using Student's t-test for independent samples. In thiscase, level of significance was Bonferroni-adjusted. The CAR wasanalyzed using the paired t-test for the increase within each groupand the t-tests for independent groups for between-group differences.Statistical analyses were performed using IBM SPSS 21 (Chicago, IL)for Mac OS X. Level of significance was defined as p .05. Effects withp .10 were interpreted as trends.HRF as beats per minute and HRV were registered as an indicator ofautonomic changes. For this purpose, the Polar watch system (RS800CX,Polar, Finland) for heart-beat monitoring was used, since it has beenshown to be of good validity and reliability [67–70]. Spectral analysisof HRV was performed with the Polar Pro Trainer 5 Professional TrainingSoftware, based on interbeat intervals (R–R intervals). The softwareextracts HRV in various frequency bands and expresses it as ms2.Frequency domain variables as described by the Task Force of theEuropean Society of Cardiology and the North American Society ofPacing and Electrophysiology [71] were derived from HRF measurements during a timespan of 5 min before the TSST (baseline) and duringthe first 5 min of the TSST. High-frequency HRV (HF-HRV, 0.15–0.4 Hz)is thought to reflect cardiac vagal function by representing the respiratory sinus arrhythmia, therefore indicating primarily parasympatheticactivity. Low-frequency HRV (LF-HRV, 0.04–0.15 Hz) is thought toreflect both parasympathetic and sympathetic activity.Assessment of affectTo complement the assessment of physiological stress responseswith psychological stress response assessments as well as for manipulation check, participants filled out the Positive and Negative AffectSchedule (PANAS; [72]) at arrival at the laboratory, shortly before andimmediately after cessation of the TSST and 10 and 25 min after theTSST. The PANAS is a reliable and valid measure for the current affectivestate [73]. It consists of 10 items for positive affect (e.g., interested,enthusiastic) and 10 items for negative affect (e.g., upset, ashamed).Participants are asked to rate the items on a five-point scale rangingfrom 1 “very slightly or not at all”, to 5 “extremely”, with higheraverage scores indicating more positive and more negative affect,respectively.ProcedureThe study took place on three consecutive days. On the first studyday, participants provided informed consent as well as informationpertaining to their menstrual cycling phase and responses to questionnaires. Diagnoses were confirmed with SCID-I. Lastly, each participantreceived four saliva sampling devices and detailed instructions onhow to use these devices over the following two days. More specifically,on the second as well as third study day, participants collected a salivasample right upon awakening followed by a second sample collection30 min post-awakening. Patients collected saliva samples in the hospitaland healthy controls at home. On the third day, participants were exposed to the TSST either in the hospital (all patients, 50% of healthy controls) or in the laboratory. All TSSTs were administered in the afternoonbetween 2 pm and 5 pm to minimize between-participant variation inStatistical analysesResultsSample characteristicsED patients and HC did not differ in terms of age and body height (Table 1). However,patients had lower body weight and a lower body mass index. They reported more disturbed eating behavior (EDE-Q), more depressive symptoms (BDI) and more psychologicalstrain (GSI score of the SCL-90-R). The EDE-Q mean score of the current patients was notsignificantly different from the normative EDE-Q mean score (z .91, p N .05). Diseaseduration varied between seven months and 347 months, with a mean duration of76.22 96.04 months. The two groups did not differ in smoking behavior, averagecigarettes per day, menstrual cycle phase or intake of oral contraceptives. However, theydiffered in level of education (χ21 23.69, p b .01) with a higher graduation level withinHC. Importantly, ten patients showed comorbid Major Depressive Disorder (MDD) andthus subsequent analyses controlled for MDD diagnosis. Furthermore, patients reported awide range of somatic comorbidities consistent with an ED diagnosis, such as sleep problems, headaches, joint pain, fatigue, dizziness, nausea, thinning hair, hair loss, lanugo, dryskin (hands), sensitivity to cold, tooth decay, amenorrhea, anemia, iron deficiency anemia,protein deficiency, hypoglycemia, hypertriglyceridemia, hypotension, bradycardia, hypocalcemia, jaundice, hypothyroidism, leukopenia, IgE-dependent allergic disposition, atopicdermatitis, arthrosis, osteoporosis, disturbed blood flow (cold hand and feet), stomachache,heartburn, gastro-esophageal reflux, diarrhea, postprandial nausea, indigestion.
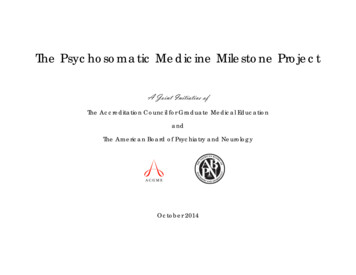
S. Het et al. / Journal of Psychosomatic Research 78 (2015) 260–267263Table 1Means and standard error of means for different descriptive variables for each group. Asterisks indicate a significant group difference.VariableEating disordersHealthy controlst-testAge (years)Body height (cm)Body weight (kg)*BMI (kg/m2)*EDE-Q (mean score)*BDI (mean score)*SCL-90-R GSI score*SmokingAverage number of cigarettes per dayMenstrual cycling phaseFollicularLutealOral contraceptives25.1 ( 8.1)169 ( .01)50.3 ( 2.2)17.7 ( .70)4.3 ( .28)22.2 ( 2.5)70.9 ( 2.2)811.722.9 ( 4.7)169 ( .01)61.7 ( 1.6)21.6 ( .51).55 ( .11)3.1 ( .56)40.7 ( 1.6)47.6t 1.24, p .22t .15, p .88t 4.13, p b .001t 4.57, p b .001t 14.40, p b .001t 9.06, p b .001t 11.28, p b .001χ12 1.36, p .24t11 1.28, p .2304821212χ21 .64, p .42χ21 1.80, p .18Cortisol stress responseCortisol concentrations are displayed in Fig. 1A. Statistical analyses were conducted onlog-transformed cortisol data, since K–S test revealed a skewed distribution for allsampling times (p b .001). A mixed 4 2-factorial ANOVA for repeated measures withTime as within-subject factor and Group as between-subject factor revealed a significanteffect of Time (F(2.37/116.0) 3.14, p .03) and a significant Time-by-Group interaction(F(2.37/116.0) 5.84, p b .01; Group: F(1/49) 1.25, p .27), indicating an increase incortisol levels in response to the TSST in the HC group compared to a blunted response observed in ED patients (cortisol increase from baseline to 10 min post-TSST: t49 4.08,p b .001). This was confirmed when assessing AUCi, which was significantly higher inHC compared to ED patients (t49 3.26, p .002; see Fig. 1B). Examining responderrates, we found that 16 HC participants responded to the TSST in contrast to only four ofthe ED patients (χ21 11.1, p .001). The significant Time-by-Group interactionwas even seen when MDD (F(2.3/112.3) 5.47, p .003), duration of illness inmonths (F(2.35/110.3) 3.86, p .018) or symptom severity as measured by the EDE-Q(F(2.4/78) 2.9, p .05) were considered as covariates or the patients were divided intoAN and BN (F(4.7113.9) 3.1, p .01). Specifically, neither patients with AN nor patientswith BN showed a cortisol response to the TSST.Time Group interaction: F(2.3/104.8) .76, p .5), duration of illness in months (Time:F(2.3/104.8) 13.9, p b .001; Group: F(1/45) 4.3, p .04; Time Group interaction:F(2.3/104.8) 0.29, p .70) and symptom severity as measured by the EDE-Q (Time:F(2.1/64.4) .23, p N .05; Group: F(1/32) 12.5, p .001; Time Group interaction:F(2.1/64.4) 1.1, p N .05) were considered as covariates. When dividing patients into ANand BN, only an effect of Time (F(2.3/107.3) 14.2, p b .001), but no main effect of Group(F(2/46) 2.7, p .08) or a Time Group interaction effect (F(4.7107.3) .30, p .93)was observed.Heart rate frequency and variability during stress exposureThe results of HRF and HRV are presented in Table 2. Using a mixed 2 2 ANOVA forrepeated measures, we found a significant main effect of Group with respect to HRF andparasympathetic activity as assessed by HF-HRV, such that ED patients showed lowerHRF and thus a higher parasympathetic activity than HC. However, the two groups didnot differ in sympathetic activity (LF-HRV). Consequently, examining the ratio betweenthe two measures, i.e., the sympatho-vagal balance (LF/HF), revealed only a significantmain effect of Time and a trend for HC to show a stronger sympathetic activity in relationto parasympathetic activity pre and peri-TSST.Alpha-amylase stress responseAffective stress responseSalivary AA levels are presented in Fig. 2A. Similarly to cortisol, sAA data were logtransformed before being subjected to statistical analyses. The mixed 4 2-factorialANOVA for repeated measures revealed significant main effects of Time (F(2.3/109.5) 18.04, p b .001) and Group (F(1/47) 4.55, p .04) but no Time-by-Group interaction effect (F(2.3/109.5) .09, p .94), indicating comparable stress responses across the twogroups, but overall higher sAA levels in the HC group compared to patients (sAA increasepre-TSST to 1 min post-TSST: t47 4.02, p .69). This was confirmed by a higher AUCi inHC relative to patients (t47 2.52, p .01; see Fig. 2B). The statistical effects for sAA didnot change when MDD (Time: F(2.3/104.8) 12.7, p b .001; Group: F(1/46) 5.0, p .03;Data on negative affect assessed by the PANAS are presented in Fig. 3. A 5 2-factorialANOVA for repeated measures on log-transformed PANAS scores revealed a significantmain effect of Time (F(2/92.1) 11.8, p b .001) and Group (F(1/46) 15.8, p b .001), butno significant Time-by-Group interaction effect (F(2/92.1) 1.35, p .26), such thatboth groups showed an increase in negative affect immediately after the TSST, however,ED patients started at significantly higher negative affect baseline levels. Due to significantbetween-group differences in depressive mood as a consequence of MDD comorbidity inED patients, the main effect of group disappeared when BDI scores were included as acovariate (F(1/35) .31, p N .05).*14120108642Eating DisorderSalivary Cortisol AUC (nmol/l*min)100TSSTSalivary Cortisol (nmol/l)12A6040*20Eating Disorder110Time (Minutes)*0-20Healthy Controls0-180Healthy Controls-4025GroupBFig. 1. Means and standard error of means of cortisol concentrations within each group, measured at four sampling times (A) and by the increase function of the area under the curve(AUCI) (B). Only healthy controls showed a peak in cortisol levels after the TSST. The asterisk indicates a significant between-group difference.
264S. Het et al. / Journal of Psychosomatic Research 78 (2015) 260–267*14085080604020Eating DisorderSalivary Alpha-Amylase AUC (u/ml*min)100TSSTSalivary Alpha-Amylase (u/ml)120110Time (Minutes)65055045035025015050Healthy Controls0-1750-5025Eating DisorderHealthy ControlsGroupABFig. 2. Means and standard error of means of salivary alpha-amylase levels within each group, measured at four sampling times (A) and by the increase function of the area under the curve(AUCI) (B). Healthy controls showed a stronger salivary alpha-amylase output in general. The asterisk indicates a significant between-group difference.Cortisol awakening responseMean cortisol awakening responses are shown in Fig. 4. Values from correspondingday 1 and day 2 samples correlated significantly (awakening: r .43, p .004; 30 min: r .54, p b .001). A mixed 2 2-factorial ANOVA revealed significant increasesin cortisol values from awakening to 30 min post-awakening (Time: F(1/40) 27.8, p b.001) for both groups (Group: F(1/40) .52, p .48; Time-by-Group: F(1/40) 1.48, p .23). Controlling for compliance did not change CAR-related results (Time: F1/38 25,3,p b .001; Time-by-Group: F1/38 53,1, p .26; Group: F1/38 5,2, p .48).DiscussionThe present study investigated the neuroendocrine, cardiovascularand emotional reactivity of a representative sample of patients withED. Compared to healthy controls, patients showed blunted cortisolstress responses to the TSST in combination with a stronger parasympathetic activity, as indicated by generally lower sAA levels, lower HRF,and higher HF-HRV. Furthermore, while negative affect increased in response to the stressor in both groups, patients' affect was more negativethroughout the entire study. Lastly, no group differences were observedfor the cortisol awakening responses.In line with previous studies utilizing the TSST, HC displayed a peakin cortisol 10 min after the stress test followed by a decrease in levelsthereafter [36,61,62]. Contrarily, ED patients showed a blunted cortisolresponse. This finding was robust in that it was observed independentof ED diagnosis (AN versus BN) and when taking into account comorbidMDD, making the presence of a comorbid MDD as an explanation for theresults improbable. As such, our observations are in line with findingsfrom Zonnevylle-Bender et al. [34] who investigated ten adolescentinpatients with AN and reported a lack of cortisol increases and only amarginal increase in heart rate. Similarly, Ginty et al. [35] comparedtwelve HC with twelve BN patients after exposure to a ten minute mental arithmetic stress task and reported a blunted cortisol reaction. However, in contrast, one recent study in outpatients reported a comparablecortisol peak in BN patients and an exaggerated cortisol response to theTSST in AN patients compared to HC [30]. One possible explanation forthe discrepancy betwe
the Department of Psychosomatic Medicine and Psychotherapy, LWL-University Clinic, Bochum (Germany), both are specialized in the treatment of EDs. The group of HC was composed of n 26 physically . review board of the Ruhr-University of Bochum. Trier social stress test (TSST) The TSST was performed as described by Kirschbaum et al. [36].In