Transcription
Lesson 2.7 fromOCEAN SCIENCES SEQUENCEFOR GRADES 6–8Teacher’s GuideUnit 2:How Does Carbon Flow through the Ocean,Land, and Atmosphere?Great Explorations in Math and Science (GEMS )Lawrence Hall of ScienceUniversity of California, BerkeleyUnit 2 141
National Oceanic and Atmospheric AdministrationFunding for this GEMS Ocean Sciences Sequence was provided by the NOAA EnvironmentalLiteracy Grant Program. reat Explorations in Math and Science (GEMS) is an ongoing curriculum development programGand professional development network. There are more than 70 teacher’s guides and handbooks inthe GEMS Series, with materials kits available from Carolina Biological. GEMS is a program of theLawrence Hall of Science, the public science education center of the University of California, Berkeley.Marine Activities, Resources & Education (MARE), a program of the Lawrence Hall of Science,is a whole-school interdisciplinary ocean science immersion program. MARE has provided professional development forteachers, curricular materials, and resources for families for 20 years. It is the longest running elementary and middle schoolmarine science program in the country.Lawrence Hall of ScienceUniversity of California, Berkeley, CA 94720-5200.Director: Elizabeth K. StageGEMS Director: Jacqueline BarberMARE Director: Craig StrangProject Directors: Catherine Halversen (Co-Director, MARE), Janice McDonnell (Institute of Marine and Coastal Sciences,Rutgers University), Craig Strang, and Jacqueline BarberCurriculum Development Team: Catherine Halversen, Kevin Beals, Jonathan Curley, Emily Weiss, Carolyn Willard;Emily Arnold, Lynn Barakos, and Sarah PedemonteAssessment Development: Seth Corrigan, Lauren Brodsky; and Lynn BarakosScience Advisors and Reviewers: Dr. Bob Chant, Dr. Jim Miller, Dr. John Wilkin, Dr. Elizabeth Sikes, Dr. Oscar Schofield,Dr. Josh Kohut, Dr. Carrie Ferraro, Kristin Hunter-Thomson, and Janice McDonnell (Institute of Marine and CoastalSciences, Rutgers University), Dr. Drew Talley (University of San Diego), Dr. Adina Paytan (University of California,Santa Cruz), Dr. Robert Rhew and Dr. John Chiang (University of California, Berkeley), Dr. Michael Mann (Universityof Pennsylvania), Paulo Maurin (NOAA Coral Reef Conservation Program), Dr. John Manderson (National MarineFisheries Service), Eric Simms and Daniel Richter (Scripps Institution of Oceanography), Dr. Fritz Stahr (University ofWashington), and Dr. Jen Skene (University of California, Berkeley)Ocean Science Educator Advisors and Reviewers: Terri Kirby Hathaway (North Carolina Sea Grant), Dr. Diana Payne(University of Connecticut, Sea Grant), and Sarah Ferner (San Francisco National Estuarine Research Reserve, RombergTiburon Center for Environmental Studies, San Francisco State University)Technology Development: Igor Heifetz, Brian Yan, Sage Lichtenwalner, Carrie Ferraro, and Janice McDonnell (Institute ofMarine and Coastal Sciences, Rutgers University), Steven Dunphy (Lawrence Hall of Science)Field Trial Management and Research: Phaela Peck and Lynn TranEditor: Barbara ClintonProduction Manager: Steven DunphyIllustrations: Lisa Haderlie Baker, Barbara Clinton, Sarah Kessler, and Carolyn WillardNOAA Program Officer: Sarah SchoedingerThis curriculum and DVD were prepared by the University of California, Berkeley, under award NA09SEC4690010 fromthe National Oceanic and Atmospheric Administration (NOAA), U. S. Department of Commerce. The statements, findings,conclusions, and recommendations are those of the author(s) and do not necessarily reflect the views of the National Oceanicand Atmospheric Administration (NOAA) or the U. S. Department of Commerce.This book is part of the GEMS Ocean Sciences Sequence for Grades 6–8: The Ocean–Atmosphere Connection and Climate Change.The sequence is printed in four volumes with the following titles:Introduction, Science Background, Assessment Scoring Guides: ISBN 978-1-4350-1046-8Unit 1: How Do the Ocean and Atmosphere Interact? ISBN 978-1-4350-1047-5Unit 2: How Does Carbon Flow through the Ocean, Land, and Atmosphere? ISBN 978-1-4350-1048-2Unit 3: What Are the Causes and Effects of Climate Change? ISBN 978-1-4350-1049-9Complete four-volume set of the GEMS Ocean Sciences Sequence for Grades 6–8: The Ocean–Atmosphere Connection andClimate Change: ISBN 978-1-4350-1045-1 2014 by The Regents of the University of California. All rights reserved. Printed in the United States of America. Studentdata sheets and other pages intended to be reproduced for students during the activities may be duplicated for classroomand workshop use. No other text may be reproduced in any form without the express written permission of the copyrightholder. For further information, please contact GEMS.www.lhsgems.org (510-642-7771)Published by Carolina Biological Supply Company. 2700 York Road, Burlington, NC 27215.Call toll free: 1-800-334-5551.www.carolinacurriculum.com/GEMS/1 2 3 4 5 6 7 8 9 10 14 13 12 11 10142 Ocean Sciences Sequence 6–8
UNIT OVERVIEWStudents learn that carbon flows among reservoirs on Earth throughprocesses such as respiration, photosynthesis, combustion, anddecomposition, and that combustion of fossil fuels is causing an imbalancein this carbon cycle. Students explore a set of Carbon Cards to discoverthat carbon is found in all living things and many other parts of the Earthsystem. They conduct an experiment with yeast and learn that organismsconsume carbon, and then release it as CO2. They read and analyzeevidence about photosynthesis and observe a video animation showingplants’ absorption of CO2 at different times of the year. They read anddiscuss short articles to discover what can happen to the carbon in anorganism after it dies. Students explore a computer model and manipulatea desktop model of the carbon cycle. They use math to investigateindustry’s impact on the carbon cycle, and they read about oceanacidification. Throughout the unit, students learn about the practices ofscience, with a focus on scientific explanations and the role of evidence.144 Ocean Sciences Sequence 6–8
SESSION SUMMARIES2.1 Finding Out about CarbonStudents write their first ideas, telling what they know about carbon. Students then read, discuss, and sortCarbon Cards and watch a short animated video. Students learn where on Earth carbon is found and what acarbon reservoir is.2.2 Tracking Carbon through RespirationStudents feed yeast samples and use an acid indicator to answer the question, what does eating have to do withproducing carbon dioxide? Students learn that many organisms consume solid carbon in food and release carbondioxide gas. They begin work on a Carbon Cycle Diagram that they will add to throughout the unit.2.3 Tracking Carbon through Photosynthesis, Part 1The class examines photographs of an investigation with a plant in a jar with water and an acid indicator and itis established that plants take in CO2 during photosynthesis. Groups then read and discuss evidence cards toanswer the question, “where does most of the matter in a plant come from?”2.4 Tracking Carbon through Photosynthesis, Part 2Students explore some of the ways carbon flows between animals, plants, and the atmosphere. They add totheir Carbon Cycle Diagrams, and write descriptions of some ways carbon flows between reservoirs. Ananimated video and interpreting a graph help students discover that CO2 levels fluctuate seasonally throughthe year because plants absorb much more CO2 when they are growing.2.5 Investigating Carbon in the OceanStudents learn that organisms in the ocean use carbon dioxide for photosynthesis and for building shells, andstudents discuss how that carbon gets into the ocean. Students conduct two investigations to discover thatwater absorbs CO2 from the air above it.2.6 Detecting Decaying and Buried BodiesEach student reads one of four short articles to gather evidence about the question, what happens to thecarbon in organisms after they die? They share in groups of four and learn that organisms can decompose,or they can get buried in places without oxygen and over millions of years, convert into fossil fuelsor limestone. Students then make flow chart “chains” with Carbon Cards to discuss and show theirunderstanding of carbon flow.2.7 Investigating Combustion and the Carbon CycleStudents use a set of Flow cards to discover natural ways carbon can leave limestone and fossil fuel reservoirs.The teacher burns a candle to demonstrate how burning fossil fuels can move carbon from this reservoir tothe atmosphere. The class then explores a computer model and a desktop model of the carbon cycle.2.8 Crunching the Numbers for the Carbon CycleA computer model is used to introduce measurements of flows and reservoirs of carbon. Students use CarbonCycle Cards with these measurements to create tabletop diagrams of the carbon cycle. Students computetotals for various types of flows and conclude that flows from human industry are causing an imbalance in thecarbon cycle.2.9 Connecting Changes in Carbon Flow and the OceanStudents read and discuss an article, and discover that as carbon dioxide increases in the atmosphere, it is alsoincreasing in the ocean, which is changing the chemistry of the ocean water and affecting ocean organisms.Students write their revised ideas, wrapping up what they have learned in the unit.Unit 2 145
Session 2.7Investigating Combustionand the Carbon Cyclen the previous session, students learned about how carbon flowsinto the reservoirs of fossil fuels and limestone. In this session,students investigate how carbon can move out of those reservoirs.Groups examine a set of Flow Cards and identify two flows thattake carbon out of fossil fuels and two that take carbon out of limestone.The class focuses on one of these flows, Human Industry: Combustionof Fossil Fuels. The teacher burns a paraffin candle to demonstrate howthe carbon in fossil fuel is converted to CO2 in the atmosphere duringcombustion. Next, the class explores two models of the carbon cycle witha continuing focus on combustion of fossil fuels: first a computer model,the Interactive Carbon Cycle Diagram, and then a model using diceand colored paper clips that allows students to follow carbon as it flowsthrough many reservoirs. Students run that model once with only naturalflows out from fossil fuel reservoirs and once with human combustionof fossil fuels. A graph shows that human combustion of fossil fuels hasincreased dramatically in recent decades. Student learning is focused onthe following key concepts:I Carbon moves between reservoirs, but the total amount of carbonon Earth doesn’t change. Human industry moves carbon out of fossil fuel and limestonereservoirs and into the atmosphere.Students also learn:UNIT GOALSSCIENCE CONTENT Carbon CyclePRACTICES OF SCIENCE Making explanations fromevidence Interpreting and creatingdiagramsNATURE OF SCIENCE Scientific explanations are basedon evidence Technology plays a role ingathering new evidenceSCIENCE LANGUAGE Using science vocabulary Having evidence-baseddiscussions214 Ocean Sciences Sequence 6–8 Fossil fuels and many other things produce CO2 when theycombust. Natural flows move small amounts of carbon out of the reservoirsof fossil fuels and limestone. One carbon atom may move through many different reservoirs. Every scientific model has ways in which it is accurate and ways inwhich it is inaccurate.Investigating Combustionand the Carbon CycleTracing Carbon Flow out of Fossil Fuel andLimestone ReservoirsEstimated Time15 minutesDemonstrating Combustion5 minutesExploring the Interactive Carbon Cycle Diagram5 minutesExploring the Paper Clip Carbon Cycle Model20 minutesTotal45 minutesOcean Literacy Scope and Sequence and Climate Literacy Principle CorrelationsOcean Literacy S&S 6.B.10. Humans obtain energy from the ocean via wind, wave, oil, and natural gas.Climate Literacy Principle 6.A. Human activities are impacting the climate system.
WHAT YOU NEEDFor the class: projection system* computer with Internet connection* or resource disc 5 slides for Session 2.7 simulation, Interactive Carbon Cycle Diagram 1 paraffin candle matches* 1 pie tin paper towel* Copymaster PacketFor each group of students: 19 Flow cards from Carbon Cycle Cards set (set/30) 1 envelope 1 six-sided die 50 colored paper clips (10 of each color) 5 self-sealing plastic bags 1 Paper Clip Carbon Cycle Model #1 sheet 1 Paper Clip Carbon Cycle Model #2 sheetFor each student: Investigation Notebook: pages 3–4, 17; optional page 20 (DWR)*not provided in kitGETTING READYBefore the day of the session:1.2.3.4.5.Set up projection system/review multimedia. Set up and test the projectionsystem to be sure all students will be able to see items projected duringthe session. Spend a few minutes reviewing this session’s materials andsupplemental resources found at mare.lawrencehallofscience.org/oss68,follow the links (eBook), or use the resource disc (print version).Preview Interactive Carbon Cycle Diagram. Explore this computermodel to become familiar with the various settings and pop-up windows.Prepare Flow cards. Separate the Carbon Cycle Card sets by coloredborders (16 green, 11 blue, and 3 black), and for each group of students,place the 19 Flow cards (green borders and black borders) into anenvelope.Prepare self-sealing bags with colored paper clips. For each group ofstudents, place 10 paper clips of each color into a small plastic bag, soeach color is in its own bag.Prepare student sheets. Copy the following pages from the CopymasterPacket:Paper Clip Carbon Cycle Model #1 (one for each group)Paper Clip Carbon Cycle Model #2 (one for each group)LANGUAGE OF SCIENCEVOCABULARYabsorbatmosphereatomcarboncarbon cyclecarbon dioxide/CO2carbon flowcarbon fossil irationLANGUAGEOF ARGUMENTATIONWhat do you think?Why do you think that?What is your evidence?Do you agree? Why?Do you disagree? Why?How sure are we?How could we be more sure?Next Generation Science Standards (NGSS) CorrelationsAvailable online: www.mare.lawrencehallofscience.org/oss68Unit 2 215
SESSION 2.7INVESTIGATING COMBUSTION AND THE CARBON CYCLETracing Carbon Flow out of Fossil Fuel and LimestoneReservoirs1. Collect homework. Collect students’ Carbon Cycle Diagrams and tell themthat they will get them back to use during their final writing for the unit.2. Project and introduce the Interactive Carbon Cycle Diagram.Project the “Reservoirs” view of the interactive diagram. Say, “Thiscomputer model is similar to your Carbon Cycle Diagrams. You can click onparts of the carbon cycle to get more information.” Tell students that theywill use the model in this and coming sessions.3. Explore fossil fuel and limestone reservoirs on the interactivediagram. Remind students that they learned how carbon gets intoreservoirs of coal, crude oil, and limestone. Click on the fossil fuelsreservoir and have a student read the information aloud. Then do thesame for the limestone reservoir.4. Ask how carbon might flow out of these reservoirs. Say, “Lastsession, you learned how carbon flows into reservoirs of coal, crude oil, andlimestone. How do you think carbon might come out of these reservoirs?”Tell students that they will be investigating this today.5. Introduce Flow Cards and the search for carbon flowing out offour reservoirs. Hold up a set of 19 Flow Cards. Tell students thattheir group’s task will be to examine these 19 cards and find the fourcards that describe flows out of fossil fuel or limestone reservoirs. Tellstudents they should also notice the other flow cards—some describeflows students have learned about and some describe other flows.6. Groups find flow cards showing flows out of fossil fuel andlimestone reservoirs. Pass each group of four a set of Flow Cardsand have them begin looking through to identify the two cards thatdescribe flows out of fossil fuel reservoirs [Natural Leakage andBreakdown of Fossil Fuels; Human Industry: Combustion of FossilFuels.] and the two that describe flows out of limestone. [VolcanicEruptions; Human Industry: Making Cement.]216 Ocean Sciences Sequence 6–8
TEACHER CONSIDERATIONSDAILY WRITTEN REFLECTIONWhy do some dead organisms decompose and others turn intofossil fuel or limestone? What is the difference? This prompt, onpage 20 of the Investigation Notebook, asks students to refer backto what they learned in the previous session. They should explainthat the carbon in dead organisms can only become fossil fuels orlimestone if it is buried where there are no decomposer organismsand then subjected to high pressure and heat over millions of years.INSTRUCTIONAL RATIONALEReasons for Sorting through Flow Cards. The process of sortingthrough the Flow cards in order to find those that show carbonleaving fossil fuel and limestone reservoirs is beneficial in a fewways. It is a chance for students to review what they learned aboutthe carbon cycle as they examine each card. It also allows for anelement of discovery as each group finds the cards that reveal howcarbon moves out of these reservoirs.Students Will Use Gigaton information Next Session. Studentsmay notice that each Flow card includes a number for gigatons.This information will be a focus of Session 2.8. For now, you can tellstudents that these numbers will help them compare which flows arelarger and which are smaller.ENGLISH LANGUAGE LEARNERSVocabulary Scaffold. Complex science vocabulary is often achallenge for ELLs. You can help ELLs succeed in this and comingsessions by reviewing the term fossil fuels near the beginning of thesession. Have students help you complete a word map on chartpaper, as shown below, and then post the word map on the wall.Examples:How it forms:Sentence using the term:fossil fuelsRelated terms:LANGUAGE OF SCIENCEVOCABULARYabsorbatmosphereatomcarboncarbon cyclecarbon dioxide/CO2carbon flowcarbon fossil irationLANGUAGEOF ARGUMENTATIONWhat do you think?Why do you think that?What is your evidence?Do you agree? Why?Do you disagree? Why?How sure are we?How could we be more sure?Unit 2 217
SESSION 2.7INVESTIGATING COMBUSTION AND THE CARBON CYCLE7. Each group member reads aloud one of the four cards to group.Once most groups have found the correct four cards, get the class’sattention. Have groups pass one of these four cards to each groupmember, and set aside the remaining 15 Flow Cards. Have groupmembers take turns reading the back of the one Flow Card they’reholding aloud to the rest of the group. Then collect all the Flow Cards.8. Project a new guiding question. Say, “Mostof the carbon that flows out of these reservoirsis because of human industry.” Project the newguiding question and have a student read italoud.Demonstrating Combustion1. Introduce a candle as a fossil fuel. Tell students that the class will nowfocus on the combustion (burning) of fossil fuels since this is the biggestflow of carbon out of fossil fuel reservoirs. Hold up the candle andexplain that it is made of paraffin wax, which is made from crude oil.When this wax burns, it keeps the flame on the wick of the candle lit.2. Light the candle and collect soot. Set the candle in a safe locationwhere students can see it. Light the candle. After a moment, hold thealuminum pie pan directly in the candle flame for a few seconds. Whenyou remove it from the flame, show students the black soot on the piepan. Rub some off with your finger or a paper towel, then hold yourblackened finger or paper towel up for the class to see.3. Turn and Talk: discuss where carbon goes. Ask “Where is the carbonfrom the wax and wick going?” and have students discuss this with apartner. After a minute or so, have a few students share their ideas.Ask, “What do you think?” “Why?” “What is your evidence?” Thenexplain that during combustion, the fuel (in this case, mostly wax)changes into gases—including CO2—and heat is released. The blacksoot and smoke are mostly leftover carbon solids that did not changeinto gases during combustion. Blow out the candle.218 Ocean Sciences Sequence 6–8
TEACHER CONSIDERATIONSINSTRUCTIONAL SUGGESTIONSStudents Do Candle Investigation. If you feel comfortable withhaving students do the candle investigation in pairs, rather than asa teacher demo, you will need to collect a few additional materialsincluding a candle, a match, and an aluminum pie plate for each pair.Pose the question of where the carbon in the candle goes duringcombustion, and challenge students to gather information as theircandle burns. You will need to set very strict safety guidelines if youchoose this option, for example, making sure no student touches acandle or flame during the combustion, that all other materials arecleared off desks, that students hold the pie pans at a minimumheight of at least one foot above the candle, and that everyone staysseated and still once candles are burning.SCIENCE NOTESAbout Combustion. When fossil fuels combust, hydrogenmolecules in the fossil fuels react with O2 molecules in the air.One product of this reaction is CO2, which moves into the air. Theburning of fossil fuels releases carbon into Earth's atmosphereimmediately, and that rapidly increases the amount of carbon inEarth's atmosphere since it builds up in the atmosphere faster thanit can flow into other reservoirs.PROVIDING MORE EXPERIENCEExtend: Trace Back the Carbon for Combustion. Lead a briefclass brainstorm in which students generate a list of differentsubstances that people burn (wood, paper, lighter fluid, charcoal,natural gas in stoves). Tell students that engines must burn fuel torun and add to the list (gasoline, diesel fuel). Explain that all thesethings have carbon in them. Choose one of these substances as aclass, and trace back two or three steps to where its carbon camefrom. For example, wood from a tree which got its carbon from CO2in the air that it took in during photosynthesis. Have each pair ofstudents choose another substance and trace it back in a similarway. You could have them record this in writing or by making asimple diagram.LANGUAGE OF SCIENCEVOCABULARYabsorbatmosphereatomcarboncarbon cyclecarbon dioxide/CO2carbon flowcarbon fossil irationLANGUAGEOF ARGUMENTATIONWhat do you think?Why do you think that?What is your evidence?Do you agree? Why?Do you disagree? Why?How sure are we?How could we be more sure?Unit 2 219
SESSION 2.7INVESTIGATING COMBUSTION AND THE CARBON CYCLEExploring the Interactive Carbon Cycle Diagram1. Review models in science. Remind students that in science, a modelis something that is used to help understand, predict, or explain howthings work. It is like the thing it represents in some, but not allways. The class will be exploring the Carbon Cycle Diagram on thecomputer as one model of the carbon cycle, and then doing anotheractivity that uses a different model of the carbon cycle.2. Explore natural carbon flows on interactive diagram. Project the“Natural Flows into Atmosphere” view of the interactive diagram, andinvite students to comment on a few things they notice about this model.Click on the Volcanic Eruptions flow and point out that the informationis the same as that shown on the Flow Cards, but with an animationshowing the movement of carbon.3. Explore industrial carbon flows on interactive diagram. Project the“Human Industry Flows” view and invite students to comment. Click onthe Combustion of Fossil Fuels flow.4. Discuss strengths of the model. Project the “All Flows intoAtmosphere” view and ask, “What does this model show well aboutthe carbon cycle?” [There are many reservoirs; carbon atoms movefrom one reservoir to another in many different flows.] Point out thenumbers and explain that this model also shows the size of the flowsand reservoirs—which ones are larger or smaller and by how much.The class will be exploring these numbers more in the next session.5. Discuss weaknesses of the model. Ask, “What does this modelNOT show well about the carbon cycle?” [Only shows two kinds oforganisms; there are no ocean organisms; it looks like the carboncycle happens in just one small place on Earth, rather than all over theplanet.] Point out that with this model, you can’t follow individualcarbon atoms as they move through a chain of flows from reservoir toreservoir.220 Ocean Sciences Sequence 6–8
TEACHER CONSIDERATIONSSCIENCE NOTESAbout the Interactive Carbon Cycle Diagram. The InteractiveCarbon Cycle Diagram was designed by a team of scientists andocean educators because we could not find a carbon cycle diagramthat was complete or accurate enough and also developmentallyor grade-level appropriate for our purposes. We also needed it tobe interactive so flows could be isolated and/or combined to seevarious inputs and outputs from the atmosphere. The informationon each of the interactive flows and reservoirs is identical to theCarbon Cycle Cards that students use in the unit. The interactivewas designed by Brian Yan under the direction of Carrie Ferraro andKristin Hunter-Thompson from Rutgers University and Robert Rhewof University of California, Berkeley.INSTRUCTIONAL SUGGESTIONSPacing: Quick Introduction to the Interactive Diagram. Unlessyou have extra time in this session, move quite quickly through thisintroduction to the Interactive Carbon Cycle Diagram. Make sureyou leave enough time for the Paper Clip Carbon Cycle Modelsthat follow. Students will be exploring the Interactive CarbonCycle Diagram further in the coming sessions and in Unit 3. Thisdiscussion is intended to give students a little familiarity with thistool and to help reinforce the idea that every scientific model isaccurate in some way(s), but inaccurate in others.PROVIDING MORE EXPERIENCEReinforce: Students Explore the Interactive Carbon CycleDiagram. If you have access to a computer for each pair ofstudents, and if time allows, have students explore the interactivediagram on their own. Give them a few minutes to explore freely, andthen pose a few focus questions. You might provide more questionsthan students can answer in the time provided and allow studentsto choose which to investigate and write about. Possible questionsinclude: Which reservoir has the most flows going into it? Why do you think thatis? Do you think different parts of the ocean have different carbon flows?Why? Which two reservoirs have the biggest flows of carbon between them?Why do you think that is? What do you think would be the most important thing you could add tothis diagram to make it show the carbon cycle more accurately?LANGUAGE OF SCIENCEVOCABULARYabsorbatmosphereatomcarboncarbon cyclecarbon dioxide/CO2carbon flowcarbon fossil irationLANGUAGEOF ARGUMENTATIONWhat do you think?Why do you think that?What is your evidence?Do you agree? Why?Do you disagree? Why?How sure are we?How could we be more sure?Unit 2 221
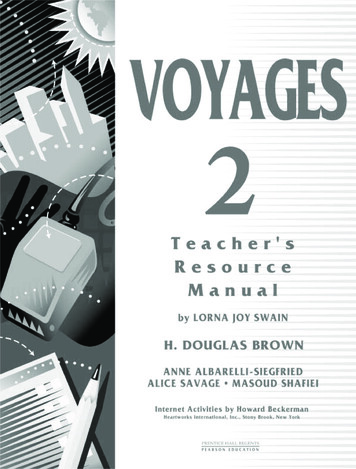
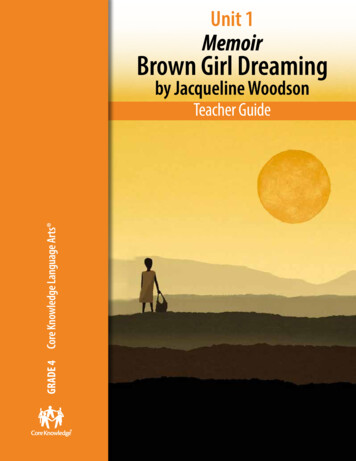
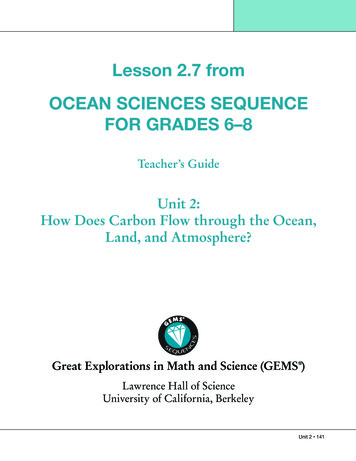
eoon➊➋ otosynthot leavStudent Sheet—Ocean Sciences Sequence 2.7Student SheetOcean Sciences Sequence 2014 The Regents of the University of California➏ (blue paper clips) OceanNatural leaks➏ theaBrakM ➌➍Permission granted to purchaser to photocopy for classroom use.➊➋(black paper clips)Fossil Fuelsand Limestone➌➍Do n otl ➏➎ ➎.ut.llsheesDand ecayburial➎ ➏(green paper clips)v oir.Animals(red paper clips) ➌➍ Animalseat plants.➌➍➎ Plants andPhotosynthetic OceanOrganisms er➊tl ➋eao t leav➊➋➌➍DonD(white paper clips) is➎➏Ph➊➋ynthesisseReleaesrbAbsoh e resno t leavoetDoPhv o ir.erh e resBou reat theniclca nsVouptioertosmA n i al sAtmosphere ett a ni m Do noo ir.Paper Clip Carbon Cycle Model #1rialh e r eservetvoir.bua lsve the resereaDeca y a n dINVESTIGATING COMBUSTION AND THE CARBON CYCLEExploring Paper Clip Carbon Cycle Modeleserv oerir. .eave thSESSION 2.71. Introduce Paper Clip Carbon Cycle Model. Tell students that theywill now use another model of the carbon cycle that WILL allow themto follow carbon atoms as they flow through many reservoirs.2. Demonstrate the model. To demonstrate howthe model works, project the student sheet forPaper Clip Carbon Cycle Model #1, using adocument camera so you can set up and movethe paper clips. If you do not have a documentcamera, project the slide of the same titleonto the board and draw paper clips on theprojected image, rather than using actual paper clips.a. What represents what. Point out that this model has only fivecarbon reservoirs, represented by the ovals on the page. The arrowsbetween the reservoirs represent flows. Carbon atoms that belongto each reservoir are represented by different-colored paper clips,ten of each. All the paper clips represent identical carbon atoms—the different colors are so students can remember which reservoireach carbon atom started in.b. Set up. Show students how groups will place ten paper clips in eachreservoir oval on the model sheet. The sheet tells which color goeswith which reservoir.c. Demonstrate running the model. Say, “Start with the oceanreservoir. One group member will roll a die. The number that comesup on the die will tell you where to move ONE carbon atom (paper clip)from that reservoir.” Demonstrate by rolling the die, then locate thenumber shown on the die, and match it to one of the flow arrowsthat exits the ocean reservoir. Move one paper clip as indicated,but note that sometimes atoms don’t actually leave the reservoir.Say, “Each group member will get one turn with the ocean reservoir,and then you will move clockwise to the next reservoir where eachgroup member gets another turn. Continue until you’ve visited all fivereservoirs.”3. Project slide; introduce focus questions. Readaloud the focus questions
the atmosphere. The class then explores a computer model and a desktop model of the carbon cycle. 2.8 Crunching the Numbers for the Carbon Cycle A computer model is used to introduce measurements of flows and reservoirs of carbon. Students use Carbon Cycle Cards with these measurements to create tabletop diagrams of the carbon cycle. Students .