Transcription
Aerosol and Air Quality Research, 20: 606–619, 2020Copyright Taiwan Association for Aerosol ResearchISSN: 1680-8584 print / 2071-1409 onlinedoi: 10.4209/aaqr.2019.10.0517Variability and Sources of Ambient Volatile Organic Compounds Based on OnlineMeasurements in a Suburban Region of Nanjing, Eastern ChinaRongrong Wu1, Yu Zhao1,2*, Jie Zhang2,3, Lei Zhang11State Key Laboratory of Pollution Control & Resource Reuse and School of the Environment, Nanjing University,Nanjing, Jiangsu 210023, China2Collaborative Innovation Center of Atmospheric Environment and Equipment Technology, CICAEET, Nanjing, Jiangsu210044, China3Jiangsu Provincial Academy of Environmental Science, Nanjing, Jiangsu 210036, ChinaABSTRACTVolatile organic compounds (VOCs) are the key precursors of ozone (O3) and secondary organic aerosol (SOA) formation.To identify the variation in VOCs emission sources, simultaneous VOCs measurements were conducted for one year at asuburban site (Xianlin Campus of Nanjing University (NJU)) in Nanjing, a highly polluted city of the Yangtze River Delta(YRD) region in China. The annual average concentration of VOCs at NJU was observed to be 18.95 14.95 ppbv, withalkanes, alkenes and aromatics contributing 67.5%, 13.6% and 18.9%, respectively, of the total mass concentration. Theratios for i-pentane/n-pentane and m,p-xylene/ethylbenzene showed that the ambient VOCs at NJU were affected by fuelevaporation and long-distance transport. A positive matrix factorization (PMF) model was applied for source apportionmentof the VOCs, and seven factors were identified. Vehicle exhaust, evaporation, natural gas (NG) and aged air masses,combustion and synthetic industries, solvents and painting, petrochemical plants and mixed industrial sources were estimatedto contribute 23.5%, 16.3%, 15.9%, 14.6%, 13.2%, 10.8% and 5.6%, respectively. The contribution from traffic emissions(i.e., vehicle exhaust) exceeded that suggested by a local emission inventory (9.7%). The concentration-weighted trajectory(CWT) model revealed that the highly polluted air masses arriving at NJU originated in the industrial areas of northeasternNanjing and the YRD. The contributions from petrochemical plants, solvents and painting, and aged air masses were foundto be increased during O3 and PM2.5 pollution days in suburban areas, indicating the importance of reducing industrialemissions and jointly controlling VOCs on a regional scale.Keywords: VOCs; Source apportionment; Positive matrix factorization; Pollution episodes.INTRODUCTIONAs the key precursors of ozone (O3) and secondary organicaerosol (SOA) formation, volatile organic compounds (VOCs)lead to severe air pollution (Huang et al., 2014; Lyu et al.,2016; Wu and Xie, 2017) and, thereby, cause damage tohuman health (WHO, 2003). Although biogenic emissionsdominate at the global scale (Guenther et al., 2006),anthropogenic sources are more influential at the regionaland urban scales (Zhao et al., 2017). Due to the unevendistribution of human activities and the associated emissionsources, there is significant variability in the spatial andtemporal distribution of individual VOCs, influencing thesecondary pollutant formation and causing difficulties in*Corresponding author.Tel.: 86-25-89680650E-mail address: yuzhao@nju.edu.cncreating strategies for the control of precursors (Latif et al.,2012; Jiang et al., 2018). Therefore, a better understandingof VOCs sources is important for regional and urban airquality improvement.With rapid economic development in China, air pollutionwith high levels of ozone (O3) and fine particulates (PM2.5)has been widely reported in many regions (He et al., 2017).The emissions of anthropogenic VOCs, the key precursorsof ambient O3 and PM2.5, have doubled during the past twodecades (Zhao et al., 2017). Previous studies have beenconducted to analyze the characteristics and identify the sourcesof ambient VOCs using receptor models on megalopolisclusters such as the Beijing-Tianjin-Hebei (BTH) region (Liet al., 2015; Wang et al., 2015), the Yangtze River Delta(YRD) region (Mo et al., 2017; Zhu et al., 2018) and thePearl River Delta (PRD) region (Zhang et al., 2015; Mo etal., 2018; Ou et al., 2018) in China. For example, An et al.(2014) used principal component analysis/absolute principalcomponent scores (PCA/APCS) to investigate VOCs sourcesat an industrial site in Nanjing. However, the variation in the
Wu et al., Aerosol and Air Quality Research, 20: 606–619, 2020VOCs sources might be different for suburban areas. In thePRD region, for example, gridded measurements of VOCswere conducted, and spatial discrepancies in VOCs sourceswere observed (Mo et al., 2018; Ou et al., 2018). A largercontribution of industrial processes was found in theindustrial area, while a larger contribution of gasoline-relatedsources was found in suburban zones. To comprehensivelyevaluate the influence of atmospheric VOCs on air qualityand to further identify the sources, further measurements ofambient VOCs at other functional areas are still needed.A few studies have shown various sources of VOCsduring pollution days. Sun et al. (2016) calculated the SOAformation potentials of VOCs during the winter haze periodin Beijing and found that emissions from vehicles, chemicalindustries and solvents were the main causes of elevatedVOCs. Wu et al. (2016) suggested that extremely high levelsof VOCs during the haze event could be primarily attributedto vehicular emissions, biomass burning and regionaltransport and were aggravated by unfavorable meteorologicalconditions. However, most studies of pollution events havefocused on particulate matter (PM) and those focusing on O3are still limited. In most developed regions of China, airpollution with high levels of O3 and PM has become one ofthe most severe environmental pollution issues (Huang etal., 2014; Xu et al., 2018), and O3 has gradually replaced PMto be the major pollutant in summer (MEP, 2018). Therefore,studies on the characteristics and source variations of VOCson O3 and PM pollution days are urgently needed to helpprovide scientific support, enabling the government toformulate effective air pollution control measures.Nanjing is a typical developed city in the YRD region ofeastern China with intensive chemical industries. The annualemissions of anthropogenic VOCs were estimated to increasefrom 148 to 253 Gg during the period of 2005–2014 (Zhaoet al., 2017). Under prevailing northeastern and southeasternwinds, Nanjing is located downwind of the entire YRDregion and is influenced by the long-distance transport ofpollutants. Ding et al. (2013) and Chen et al. (2019) reportedhigh levels of O3 and PM2.5 concentrations with near-surfaceobservation data in this region. In this study, we conductedsimultaneous online measurements of ambient VOCs atsuburban areas for a full year. The diurnal and seasonalvariations in VOCs and diagnostic ratios were evaluated tounderstand the temporal differences of VOCs levels. Thesources of VOCs were identified, and their contributions toambient concentrations were quantified through the positivematrix factorization (PMF) method. Both the PMF methodand the PCA/APCS models do not need prior informationabout the number of VOCs sources and the VOCs emissionsource profiles. However, PMF model was chosen overPCA/APCS models because it could identify VOCs sourcesby limiting all the elements in the factor profiles and thefactor loading matrix to positive values (Yuan et al., 2009),and could deal appropriately with data that are below themethod detection limit (MDL; Hu et al., 2018). Finally, thesource contribution during O3 and PM2.5 pollution days wasinvestigated to improve policy making regarding air qualityimprovement.607METHODSSite DescriptionVOCs measurements were conducted at the XianlinCampus of Nanjing University (NJU; 32.12 N, 118.96 E) inNanjing, as shown in Fig. 1. The instruments at NJU wereset on the roof of a building, 20 m above the ground. NJU isa suburban site, located in northeastern Nanjing, approximately20 km from downtown (Li et al., 2016; Chen et al., 2017).Under the prevailing southeastern winds in the summermonsoon season, NJU has often been affected by urbanplumes from the megacity Shanghai and the Suzhou-WuxiChangzhou city cluster (Zhao et al., 2019).Due to the technical problems with the instruments at NJU,other species in the atmosphere, including O3, PM2.5, carbonmonoxide (CO) and nitrogen dioxide (NO2), were measuredand reported at a state-operated air quality observation sitein Xianlin (XL; 32.11 N, 118.91 E; https://data.epmap.org).The XL site is 4.5 km west of the NJU site, as shown in Fig. 1.Our previous study demonstrated that the relatively closedistances did not lead to a large bias in air quality (Chen etal., 2017); thus, we can assume that the data from the XLsite is representative of the atmospheric conditions aroundNJU.Sampling and AnalysisThe concentrations of 55 VOCs species were measured byan online O3 Precursor Analyzer System (PerkinElmer (PE),Waltham, MA, USA) from March 2016 to February 2017 atNJU. At a flow rate of 15 mL min–1, air samples were collectedfor 40 min every hour and then passed through a Nafiondryer to remove water vapor. The dried samples were firstconcentrated in a trap maintained at –30 C and later desorbedwhen the trap was heated to 350 C at a rate of 40 C s–1 inthe thermal desorbers (TD 300; PE). Finally, the compoundswere transferred into a gas chromatograph system (GC 580;PE) by an ultra-pure (99.999%) helium carrier.The gas chromatograph system was operated with twocolumns and two flame ionization detectors (FIDs). 55compounds, including alkanes, alkenes and aromatichydrocarbons, were classified into C2–C6 and C6–C12categories. The former was separated in the PLOT column(Al2O3/Na2SO4, 50 m 0.32 mm 5 µm) and then identifiedby the first FID. The latter was separated in the BP-1 column(Al2O3/Na2SO4, 50 m 0.22 mm 1 µm) and then identifiedby the second FID. The temperature program for the GC ovenwas increased from 46 C to 170 C at a rate of 5 C min–1, thenincreased to 200 C at a rate of 15 C min–1, and was finallymaintained at 200 C for 9 min. The sample residence timefor measuring VOCs with GC-FID was 50 min, and achromatogram with identified retention times is presented inFig. S1.The analytical uncertainty on species was evaluated fromthe observed reproducibility and linearity of standard gas.Running for ten times, the relative standard deviations ofconcentration-response (peak area) were 0.34–2.78% for 55species. The calibration curves were obtained by running thefive diluted standards and the correlation coefficients for thecalibration curves were 0.9929–0.9999 for 55 species. The
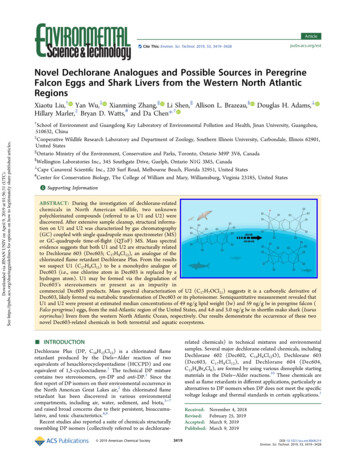
Wu et al., Aerosol and Air Quality Research, 20: 606–619, 2020608Fig. 1. The locations of the NJU and XL sites in Nanjing. The green and red marks represent NJU and XL site, respectively.The black flags are main factories with annual VOCs emission over 1 t. The (b) green lines and (c) yellow lines are riverpath and road, respectively.analytical system was checked daily with a one-pointcalibration. The standard gases from the PhotochemicalAssessment Monitoring Stations (PAMS, Linde) were usedat 00:00 every day. If the response was within 10% of theinitial calibration curve, the measurements were expected tobe reliable. Fig. S1 illustrates the retention times of speciesin a sample and a standard gas, which were consistent witheach other. The method detection limit (MDL) of a certainVOC was calculated according to Eq. (1) (Xia et al., 2014):MDL 3 N WH(1)where N is the noise (mV), W is the concentration of thecalibration sample (ppbv) and H is the response (mV). TheMDLs of individual VOCs are listed in Table S1.The methods recommended in the National Ambient AirQuality Standards in China (NAAQS-CN) were used for themeasurement of other species at the XL site. O3 and PM2.5were monitored with a Model 49i O3 Analyzer and a ThermoScientific TEOM 1405D, respectively, and the concentrationsof NO2 and CO were measured with Thermo ScientificTEOM 42i and 48i, respectively. All the samples werecollected at hourly intervals. Meteorological data, includingsolar radiation, wind speed, air temperature, precipitation,relative humidity and surface air pressure, were recorded atthe automatic weather station at NJU.Positive Matrix Factorization (PMF)The EPA PMF 5.0 program (U.S. EPA, 2014) was usedto identify VOCs sources and to quantify their contributions.For a certain number of factors, PMF analysis can obtain the
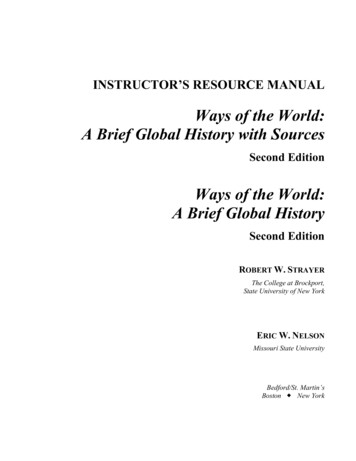
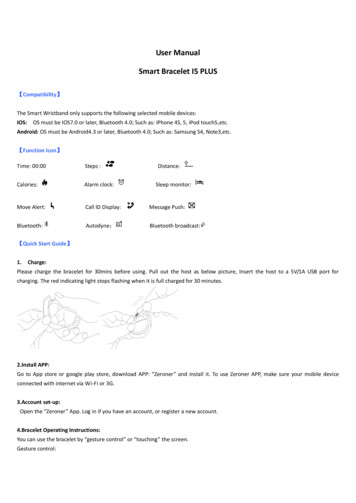
Wu et al., Aerosol and Air Quality Research, 20: 606–619, 2020factor contributions and factor profiles by minimizing theobject function Q (Paatero and Tapper, 1994; Paatero, 1997):p x g ik f kjn m ijk 1Q uiji 1 j 1 Error Fraction Conc (2)2 0.5 MDL 2(3)If the concentrations were higher than the MDL, Eq. (4)was used (Polissar et al., 1998; Reff et al., 2007):5Unc MDL6PMF ran from four to ten factors to obtain meaningfulsolutions. The determination of PMF factor number wasshown in Section S1.2where i, j and k represent the VOCs compound, emissionsource and sampling, respectively; x represents theconcentration; g represents the profile matrix; f representsthe score matrix; and u represents the residual factor.Both the concentration data file and the correspondinguncertainty data file are required as inputs of the PMF. Forthe concentrations, ND (not detected) data and data lowerthan the MDL were replaced by a value of half the MDL(Hopke et al., 2000; Yuan et al., 2012). Only species inwhich at least 70% of measurements were above the MDLwere chosen for PMF analysis. Although the procedure inPMF model would eliminate “bad variables,” it categorizesa species as “bad” only if all the samples are missing (U.S.EPA, 2014; Ou et al., 2015). The uncertainties (Unc) of thoseconcentration values (Conc) that were below or equal to theMDL were calculated using Eq. (3) (Polissar
Under prevailing northeastern and southeastern winds, Nanjing is located downwind of the entire YRD region and is influenced by the long-distance transport of pollutants. Ding et al. (2013) and Chen et al. (2019) reported high levels of O 3 and PM 2.5 concentrations with near-surface observation data in this region. In this study, we conducted
